Silver Creek Water Reclamation Facility - Division of Water Quality
Silver Creek Water Reclamation Facility - Division of Water Quality
Silver Creek Water Reclamation Facility - Division of Water Quality

Create successful ePaper yourself
Turn your PDF publications into a flip-book with our unique Google optimized e-Paper software.
TECHNICAL MEMORANDUM<br />
UDWQ POTW Nutrient Removal Cost Impact Study:<br />
Analysis <strong>of</strong> Snyderville Basin - <strong>Silver</strong> <strong>Creek</strong> <strong>Water</strong><br />
<strong>Reclamation</strong> <strong>Facility</strong><br />
PREPARED FOR:<br />
PREPARED BY:<br />
COPIES:<br />
Utah <strong>Division</strong> <strong>of</strong> <strong>Water</strong> <strong>Quality</strong><br />
CH2M HILL<br />
Snyderville Basin - <strong>Silver</strong> <strong>Creek</strong> <strong>Water</strong> <strong>Reclamation</strong> <strong>Facility</strong><br />
DATE: September 2010<br />
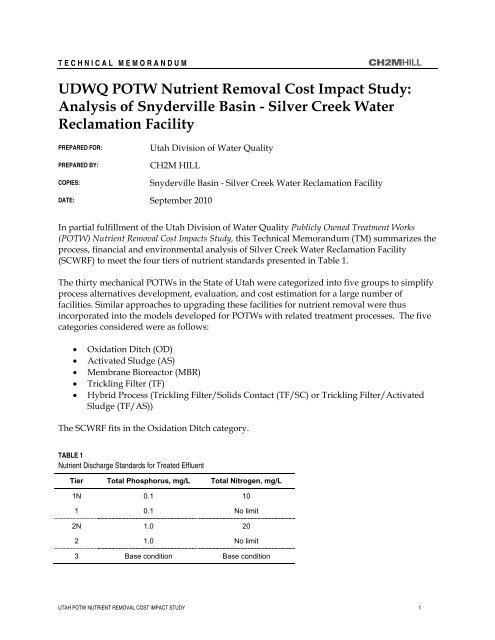
In partial fulfillment <strong>of</strong> the Utah <strong>Division</strong> <strong>of</strong> <strong>Water</strong> <strong>Quality</strong> Publicly Owned Treatment Works<br />
(POTW) Nutrient Removal Cost Impacts Study, this Technical Memorandum (TM) summarizes the<br />
process, financial and environmental analysis <strong>of</strong> <strong>Silver</strong> <strong>Creek</strong> <strong>Water</strong> <strong>Reclamation</strong> <strong>Facility</strong><br />
(SCWRF) to meet the four tiers <strong>of</strong> nutrient standards presented in Table 1.<br />
The thirty mechanical POTWs in the State <strong>of</strong> Utah were categorized into five groups to simplify<br />
process alternatives development, evaluation, and cost estimation for a large number <strong>of</strong><br />
facilities. Similar approaches to upgrading these facilities for nutrient removal were thus<br />
incorporated into the models developed for POTWs with related treatment processes. The five<br />
categories considered were as follows:<br />
• Oxidation Ditch (OD)<br />
• Activated Sludge (AS)<br />
• Membrane Bioreactor (MBR)<br />
• Trickling Filter (TF)<br />
• Hybrid Process (Trickling Filter/Solids Contact (TF/SC) or Trickling Filter/Activated<br />
Sludge (TF/AS))<br />
The SCWRF fits in the Oxidation Ditch category.<br />
TABLE 1<br />
Nutrient Discharge Standards for Treated Effluent<br />
Tier Total Phosphorus, mg/L Total Nitrogen, mg/L<br />
1N 0.1 10<br />
1 0.1 No limit<br />
2N 1.0 20<br />
2 1.0 No limit<br />
3 Base condition Base condition<br />
UTAH POTW NUTRIENT REMOVAL COST IMPACT STUDY 1
SNYDERVILLE BASIN - SILVER CREEK WATER RECLAMATION FACILITY<br />
1. <strong>Facility</strong> Overview<br />
SCWRF has a design flow <strong>of</strong> 2.4 million gallons per day (mgd) and currently receives an<br />
average influent flow <strong>of</strong> approximately 1.4 mgd annually. The facility operates an oxidation<br />
ditch with secondary clarification for solids separation. The secondary effluent is disinfected<br />
using a ultra-violet disinfection system prior to discharge. The facility has the option <strong>of</strong> filtering<br />
its secondary effluent using a traveling bridge filtration system. However, it is currently not<br />
being operated. The wasted secondary solids are mechanically dewatered using a belt filter<br />
press to obtain approximately 14.5% total solids and is utilized as a landfill top cover. A process<br />
flow diagram <strong>of</strong> the existing treatment plant is presented in Figure 1 and an aerial photo <strong>of</strong> the<br />
POTW is shown in Figure 2. The major existing unit processes are listed in Table 2.<br />
FIGURE 1<br />
Process Flow Diagram<br />
UTAH POTW NUTRIENT REMOVAL COST IMPACT STUDY 2
SNYDERVILLE BASIN - SILVER CREEK WATER RECLAMATION FACILITY<br />
SECONDARY<br />
OXIDATION<br />
FIGURE 2<br />
Aerial View <strong>of</strong> the <strong>Facility</strong> (Source: Google Earth)<br />
TABLE 2<br />
Summary <strong>of</strong> Major Unit Processes<br />
Treatment step Number <strong>of</strong> Units Size, each Details<br />
Oxidation Ditch 1 1.5 MG<br />
2 Aerators @ 100 HP<br />
each<br />
Secondary Clarifiers 2 70-ft diameter, 14-ft SWD Circular, covered<br />
Traveling Bridge Filter 2 --- Not used<br />
Belt Filter Press 1 1 m ----<br />
2. Nutrient Removal Alternatives Development<br />
A nutrient removal alternatives matrix was prepared to capture an array <strong>of</strong> viable approaches<br />
for OD facilities (See Attachment A). This matrix considers biological and chemical phosphorus<br />
removal approaches as well as different activated sludge configurations for nitrogen control.<br />
The alternatives matrix illustrates that there are several strategies for controlling nutrient limits.<br />
The processes that were modeled and described in the subsequent sections are considered<br />
proven methods for meeting the nutrient limits. There may be other ways to further optimize<br />
to reduce capital and operation and maintenance (O&M) costs that are beyond the scope <strong>of</strong> this<br />
project. This TM can form the basis for an optimization study in the future should that be<br />
desired by the POTW.<br />
UTAH POTW NUTRIENT REMOVAL COST IMPACT STUDY 3
SNYDERVILLE BASIN - SILVER CREEK WATER RECLAMATION FACILITY<br />
SCWRF currently operates an oxidation ditch without primary treatment. Process modeling<br />
efforts show that the existing plant would require a second oxidation ditch to achieve the<br />
current discharge requirements at design conditions provided by the utility. Because <strong>of</strong> this, the<br />
baseline condition (Tier 3) includes two oxidation ditches, <strong>of</strong> equal volume, in order to maintain<br />
capacity. Nutrient control approaches were then based on this Tier 3 system. As with all <strong>of</strong> the<br />
POTWs, the upgrade approaches for nutrient removal were developed with the goal <strong>of</strong> utilizing<br />
the existing infrastructure to the maximum extent possible. Figure 3 shows the selected<br />
upgrade approach used between each tier <strong>of</strong> nutrient control with the bullet points A through D<br />
below describing each upgrade step:<br />
A. From Tier 3 (existing process) to Tier 2 phosphorus control, a metal-salt addition<br />
system was implemented at the secondary clarifiers for chemical phosphorus<br />
removal.<br />
B. To go from Tier 2 to Tier 2N, no additional upgrades were required.<br />
C. To go from Tier 2 to Tier 1 level <strong>of</strong> phosphorus control, a deep bed granular<br />
media filtration system replaced the existing traveling bridge filter downstream<br />
<strong>of</strong> the secondary clarifiers to remove particulate phosphorus from the liquid<br />
stream. Metal-salt was added upstream <strong>of</strong> the filters in addition to the secondary<br />
clarifiers to enhance chemical phosphorus removal.<br />
D. To go from Tier 1 to Tier 1N, an anoxic selector was installed upstream <strong>of</strong> the<br />
existing oxidation ditches, along with a mixed-liquor recirculation system to<br />
achieve denitrification. Metal-salt addition was implemented at the secondary<br />
clarifiers and upstream <strong>of</strong> the deep bed granular media filters to achieve<br />
chemical phosphorus removal.<br />
FIGURE 3<br />
Upgrades Scheme for Meeting Increasingly More Stringent Nutrient Control<br />
Data Evaluation, Initial Modeling, and Calibration<br />
The selected progression <strong>of</strong> upgrades conceived for meeting the different tiers <strong>of</strong> nutrient<br />
control for SCWRF was analyzed using the following four steps;<br />
Step 1.<br />
Review, compile, and summarize the process performance data submitted<br />
by the POTW;<br />
UTAH POTW NUTRIENT REMOVAL COST IMPACT STUDY 4
SNYDERVILLE BASIN - SILVER CREEK WATER RECLAMATION FACILITY<br />
Step 2. Develop and calibrate a base model <strong>of</strong> the existing POTW using the<br />
summarized performance data;<br />
Step 3. Build upon the base model by sequentially modifying it to incorporate<br />
unit process additions or upgrades for the different tiers <strong>of</strong> nutrient<br />
control and use model outputs to establish unit process sizing and<br />
operating requirements;<br />
Step 4. Develop capital and O&M costs for each upgrade developed in Step 3.<br />
The facility information and data received from SCWRF per the initial data request was<br />
evaluated to (a) develop, and validate the base process model, and (b) size facilities to conserve<br />
the POTW’s current rated capacity. Table 3 provides a summary <strong>of</strong> the reported information<br />
used as the model input conditions. See Process Modeling Protocol (Attachment B) for<br />
additional information.<br />
TABLE 3<br />
Summary <strong>of</strong> Input Conditions<br />
Input Parameter 2009 (1) 2029 (2) Design (3)<br />
Flow, mgd 1.4 2 2.5<br />
BOD, lb/day 1,750 (150 mg/L) 3,600(215 mg/L) 5,630 (215 mg/L)<br />
TSS, lb/day 2,070 (177 mg/L) 3,753 (225 mg/L) 6,255 (225 mg/L)<br />
TKN, lb/day 374 (32 mg/L) 538 (32 mg/L) 898 (32mg/L)<br />
TP, lb/day 53 (4 mg/L) 67 (4 mg/L) 120 (4 mg/L)<br />
(1) Historic conditions 2007-2009<br />
Projected by the POTW<br />
(3) Design maximum month capacity <strong>of</strong> POTW<br />
The main sizing and operating design criteria that were associated with the system upgrade for<br />
SCWRF are summarized in Table 4.<br />
TABLE 4<br />
Main Unit Process Sizing and Operating Design Parameters<br />
UTAH POTW NUTRIENT REMOVAL COST IMPACT STUDY 5
SNYDERVILLE BASIN - SILVER CREEK WATER RECLAMATION FACILITY<br />
Design Parameter (Nutrient Tier)<br />
Influent design temperature (All Tiers)<br />
Value<br />
10 deg C<br />
Anoxic fraction <strong>of</strong> bioreactor (T1N) 15%<br />
Target metal:PO 4 -P molar Ratio (Tier 1 and 1N) 2:1, 7:1 (1)<br />
Metal salt storage (All Tiers)<br />
14 days<br />
Fraction <strong>of</strong> mixed-liquor return flow to influent flow (T1N) 200%<br />
Granular filter loading rate (T1 and T1N) 5 gpm/ft 2 (2)<br />
(1)<br />
Target dosing ratio at the secondary clarifiers and upstream <strong>of</strong> polishing filter, respectively. Note that polishing<br />
filter included in T1 and T1N only. Filter doses were for Tiers 1 and 1N only<br />
(2)<br />
Hydraulic loading rate at peak hourly flow<br />
3. Nutrient Upgrade Approaches<br />
The following paragraphs provide details <strong>of</strong> the nutrient removal upgrade approaches as<br />
presented previously in Figure 3.<br />
Tier 2 Phosphorus (A)<br />
The effluent limit for this alternative is 1.0 mg/L total phosphorus. SCWRF can achieve this<br />
limit by implementing a metal-salt addition system at the secondary clarifiers. This approach<br />
would dose metal salt upstream <strong>of</strong> the clarifiers for chemical phosphorus removal. A chemical<br />
storage building was required to house both the storage tanks and the metering pumps. The<br />
process flow diagram for this approach is shown in Figure 4, with the upgrades indicated in<br />
red.<br />
Figure 4<br />
Modifications to POTW for Tier 2 Nutrient Control<br />
UTAH POTW NUTRIENT REMOVAL COST IMPACT STUDY 6
SNYDERVILLE BASIN - SILVER CREEK WATER RECLAMATION FACILITY<br />
Tier 2N – Phosphorus & Nitrogen (B)<br />
The effluent limit for this alternative is 1.0 mg/L total phosphorus and 20 mg/L total nitrogen.<br />
The upgrades proposed for Tier 2 was sufficient for this nutrient removal alternative as the<br />
existing oxidation ditch process is already achieving enough nitrogen removal to meet the 20<br />
mg/L total nitrogen limit. Thus, the process flow diagram would be the same as presented in<br />
Figure 4.<br />
Tier 1 –Phosphorus (C)<br />
This alternative builds upon the Tier 2 approach for phosphorus control to meet 0.1 mg/L total<br />
phosphorus limit. The settled effluent from the secondary clarifiers was pumped to a deep bed<br />
granular media filtration system, which replaced the existing traveling bridge filters. A second<br />
feed point for metal-salt addition was introduced upstream <strong>of</strong> the filters. The metal salt feed<br />
point at the secondary clarifiers was retained and operated. A process flow diagram <strong>of</strong> this<br />
approach is provided in Figure 5.<br />
FIGURE 5<br />
Modifications to POTW for Tier 1 Nutrient Control<br />
Tier 1N – Phosphorus & Nitrogen (D)<br />
The effluent limit for this alternative is 0.1 mg/L total phosphorus and 10 mg/L total nitrogen.<br />
Total nitrogen removal was achieved by installing an anoxic selector ahead <strong>of</strong> the oxidation<br />
ditches with a nitrate-rich mixed-liquor recirculation system. This allowed sufficient<br />
denitrification to occur in order to meet the 10 mg/L total nitrogen limit. For phosphorus<br />
removal, the multi-point metal salt feed systems at the secondary clarifiers and upstream <strong>of</strong> the<br />
granular filters as proposed for Tier 1 alternative was implemented. A process flow diagram is<br />
shown as Figure 6.<br />
UTAH POTW NUTRIENT REMOVAL COST IMPACT STUDY 7
SNYDERVILLE BASIN - SILVER CREEK WATER RECLAMATION FACILITY<br />
FIGURE 6<br />
Modifications to POTW for Tier 1N Nutrient Control<br />
4. Capital and O&M Cost Estimates for Nutrient Control<br />
This section summarizes the cost-impact results from the nutrient control analysis. These<br />
outputs were used in the financial cost model and subsequent financial analyses.<br />
Table 5 presents a summary <strong>of</strong> the major facility upgrade components identified for meeting<br />
each tier <strong>of</strong> nutrient control. For Tier 2 and Tier 2N, metal-salt storage facility and new feed<br />
pumps were required ahead <strong>of</strong> the secondary clarifiers. For Tier 1, a secondary effluent pump<br />
station was installed to lift the secondary effluent to the new deep bed granular media filters. A<br />
second metal-salt feed system was added upstream <strong>of</strong> the filters to provide chemical<br />
phosphorus polishing. For Tier 1N, in addition to the metal salt feed system at the secondary<br />
clarifiers and upstream <strong>of</strong> the new deep bed granular media filters, an anoxic selector along<br />
with mixed liquor recirculation system was installed.<br />
TABLE 5<br />
Major <strong>Facility</strong> Upgrade Summary<br />
Processes Tier 2 Tier 2N Tier 1 Tier 1N<br />
Metal-salt feed and storage facility X X X X<br />
Anoxic selector<br />
Mixed-liquor recirculation system<br />
X<br />
X<br />
Secondary effluent pump station X X<br />
Deep bed granular media filters X X<br />
The capital cost estimates shown in Table 6 were generated for the facility upgrades<br />
summarized in Table 5. These estimates were prepared in accordance with the guidelines <strong>of</strong> the<br />
Association for the Advancement <strong>of</strong> Cost Engineering (AACE) International and defined as a<br />
UTAH POTW NUTRIENT REMOVAL COST IMPACT STUDY 8
SNYDERVILLE BASIN - SILVER CREEK WATER RECLAMATION FACILITY<br />
Class 4 estimate. The expected accuracy range for the estimates shown in Table 6 is -<br />
30%/+50%.<br />
TABLE 6<br />
Capital Cost Estimates ($ Million)<br />
Unit Process <strong>Facility</strong> Tier 2 Tier 2N Tier 1 Tier 1N<br />
Metal-salt feed pumps and storage<br />
facility<br />
$0.36 $0.36 $0.48 $0.48<br />
Anoxic selector $0 $0 $0 $1.64<br />
Mixed-liquor recirculation system $0 $0 $0 $0.10<br />
Secondary effluent pump station $0 $0 $1.62 $1.62<br />
Deep bed granular media filtration<br />
system<br />
$0 $0 $6.92 $6.92<br />
TOTAL TIER COST $0.36 $0.36 $9.02 $10.76<br />
December 2009 US Dollars<br />
Incremental O&M costs associated with meeting each tier <strong>of</strong> nutrient standard were generated<br />
for the years 2009 and 2029. Unit costs provided by the POTW are presented in Table 7. If a unit<br />
cost was not provided, it was assumed based on the A round trip hauling distance was also<br />
assumed and is stated in Table 7. A straight line interpolation was used to estimate the<br />
differential cost for the two years. O&M costs for each upgrade included the following<br />
components:<br />
• Biosolids management: hauling , use, and disposal<br />
• Chemical consumption costs: metal-salt, and, polymer<br />
• Power costs for the major mechanized process equipment: secondary effluent pumps,<br />
backwash pumps and dewatering units<br />
TABLE 7<br />
Operating and Maintenance Unit Costs<br />
Parameter<br />
Biosolids hauling<br />
Biosolids tipping fee<br />
Round trip hauling distance (1)<br />
Alum<br />
Polymer<br />
Power<br />
Value<br />
$17/wet ton<br />
$19/wet ton<br />
60 miles<br />
$480/ton<br />
$1/lb<br />
$0.06/kwh<br />
(1)<br />
Roundtrip biosolids hauling distance was estimated between SCWRF and the<br />
Landfill site at Magna<br />
Increased O&M relative to the current O&M cost (Tier 3) are presented in Table 8 and shown<br />
graphically in Figure 6.<br />
UTAH POTW NUTRIENT REMOVAL COST IMPACT STUDY 9
SNYDERVILLE BASIN - SILVER CREEK WATER RECLAMATION FACILITY<br />
TABLE 8<br />
Estimated Impact <strong>of</strong> Nutrient Control on O&M Costs<br />
Biosolids<br />
Metal-salt<br />
Polymer<br />
Power<br />
Total O&M<br />
Tier 2 Tier 2N Tier 1 Tier 1N<br />
2009 2029 2009 2029 2009 2029 2009 2029<br />
$0.005 $0.007 $0.005 $0.007 $0.009 $0.012 $0.008 $0.011<br />
$0.018 $0.022 $0.018 $0.022 $0.035 $0.043 $0.032 $0.037<br />
$0.000 $0.001 $0.000 $0.001 $0.001 $0.001 $0.001 $0.001<br />
$0.001 $0.001 $0.001 $0.001 $0.019 $0.023 $0.041 $0.045<br />
$0.024 $0.030 $0.024 $0.030 $0.064 $0.079 $0.081 $0.093<br />
Note: $ Million (US) in December 2009.<br />
Costs shown are the annual differential costs relative to the base line O&M cost <strong>of</strong> the POTW<br />
Annual Differential O&M Cost ($) Millions<br />
$0.12<br />
$0.11<br />
$0.09<br />
$0.08<br />
$0.06<br />
$0.05<br />
$0.03<br />
$0.02<br />
Tier 2 and 2N<br />
Tier 1<br />
Tier 1N<br />
$0.00<br />
2005 2010 2015 2020 2025 2030 2035<br />
Year<br />
FIGURE 6<br />
Impact <strong>of</strong> Nutrient Control on O&M Costs over 20 year evaluation period<br />
5. Financial Impacts<br />
This section presents the estimated financial impacts that will result from the implementation <strong>of</strong><br />
nutrient discharge standards for the State <strong>of</strong> Utah. Financial impacts were summarized for each<br />
POTW on the basis <strong>of</strong> three primary economic parameters: 20-year life cycle costs, user charge<br />
impacts, and community financial impacts. The basis for the financial impact analysis is the<br />
estimated capital and incremental O&M costs established in the previous sections.<br />
Life Cycle Costs<br />
Life cycle cost analysis refers to an assessment <strong>of</strong> the costs over the life <strong>of</strong> a project or asset,<br />
emphasizing the identification <strong>of</strong> cost requirements beyond the initial investment or capital<br />
expenditure.<br />
UTAH POTW NUTRIENT REMOVAL COST IMPACT STUDY 10
SNYDERVILLE BASIN - SILVER CREEK WATER RECLAMATION FACILITY<br />
For each treatment upgrade established to meet the studied nutrient limits (Tier 2, Tier 2N, Tier<br />
1, and Tier 1N), a multi-year life cycle cost forecast was developed that is comprised <strong>of</strong> both<br />
capital and O&M costs. Cost forecasts are organized with initial capital expenditures in year 0<br />
(2009), and incremental O&M forecasts from year 1 (2010) through year 20 (2029). The cost<br />
forecast for each treatment alternative was developed in current (2009) dollars, and discounted<br />
to yield the net present value (NPV).<br />
The NPV was divided by the estimated 20-year nutrient discharge mass reduction for each tier,<br />
resulting in a cost per pound estimate for nutrient removal. This calculation represents an<br />
appropriate matching <strong>of</strong> costs with receiving stream load reduction over the same time period.<br />
Table 9 presents the results <strong>of</strong> the life cycle cost analysis for SCWRF.<br />
TABLE 9<br />
Nutrient Removal: 20-Year Life Cycle Cost per Pound 1<br />
Tier 2 Tier 2N Tier 1 Tier 1N<br />
Phosphorus Removal (pounds) 2 191,732 191,732 285,748 285,748<br />
Nitrogen Removal (pounds) 2 - meets limit - 1,044,627<br />
Net Present Value <strong>of</strong> Removal Costs 3 $ 773,518 $ 773,518 $ 10,115,005 $ 10,351,422<br />
NPV: Phosphorus Allocation 773,518 773,518 10,115,005 10,115,005<br />
NPV: Nitrogen Allocation 4 - 236,417<br />
TP Cost per Pound 5 $ 4.03 $ 4.03 $ 35.40 $ 35.40<br />
TN Cost per Pound 5 NA $<br />
0.23<br />
1 - For facilities that are already meeting one or more nutrient limits, "meets limit" is displayed for nutrient removal mass and "NA" is<br />
displayed for cost per pound metrics<br />
2 - Total nutrient removal over a 20-year period, from 2010 through 2029<br />
3 - Net present value <strong>of</strong> removal costs, including capital expenditures and incremental O&M over a 20-year period<br />
4 - For simplicity, it w as assumed that the nitrogen cost allocation w as the incremental difference betw een net present value costs<br />
across Tiers for the same phosphorus limit (i.e. Tier 2 to Tier 2N); differences in technology recommendations may result in different<br />
cost allocations for some facilities<br />
5 - Cost per pound metrics measured over a 20-year period are used to compare relative nutrient removal efficiencies among<br />
treatment alternatives and different facilities<br />
Customer Financial Impacts<br />
The second financial parameter measures the potential impact to user rates for those customers<br />
served by the POTW. The financial impact was measured both in terms <strong>of</strong> potential rate<br />
increases for the POTW’s associated service provider, and the resulting monthly bill impacts for<br />
the typical residential customer <strong>of</strong> the system.<br />
Customer impacts were estimated by calculating annual increased revenue requirements for the<br />
POTW. Implementation <strong>of</strong> each treatment upgrade will increase the annual revenue<br />
requirements for debt service payments (related to initial capital cost) and incremental O&M<br />
costs.<br />
The annual cost increase was then divided by the number <strong>of</strong> customers served by the POTW, as<br />
measured by equivalent residential units (ERUs), to establish a monthly rate increase per ERU.<br />
UTAH POTW NUTRIENT REMOVAL COST IMPACT STUDY 11
SNYDERVILLE BASIN - SILVER CREEK WATER RECLAMATION FACILITY<br />
The monthly rate increase associated with each treatment alternative was estimated by adding<br />
the projected monthly rate increase to the customer’s current average monthly bill. Estimated<br />
financial impacts for customers <strong>of</strong> the SCWRF are presented in Table 10.<br />
TABLE 10<br />
Projected Monthly Bill Impact per Equivalent Residential Unit (ERU) for Treatment Alternatives<br />
Tier 2 Tier 2N Tier 1 Tier 1N<br />
Initial Capital Expenditure $ 363,000 $ 363,000 $ 9,021,000 $ 10,762,000<br />
Estimated Annual Debt Service 1 $ 29,100 $ 29,100 $ 723,900 $ 863,600<br />
Incremental Operating Cost 2 24,300 24,300 65,000 81,700<br />
Total Annual Cost Increase $ 53,400 $ 53,400 $ 788,900 $ 945,300<br />
Number <strong>of</strong> ERUs 5,540 5,540 5,540 5,540<br />
Annual Cost Increase per ERU $9.64 $9.64 $142.40 $170.63<br />
Monthly Cost Increase per ERU 3 $0.80 $0.80 $11.87 $14.22<br />
Current Average Monthly Bill 4 $28.50 $28.50 $28.50 $28.50<br />
Projected Average Monthly Bill 5 $29.30 $29.30 $40.37 $42.72<br />
Percent Increase 2.8% 2.8% 41.6% 49.9%<br />
1 - Assumes a financing term <strong>of</strong> 20 years and an interest rate <strong>of</strong> 3.0 percent<br />
2 - Incremental annual increase in O&M based on chosen treatment technology, estimated for first operational year<br />
3 - Projected monthly bill impact per ERU for each alternative, based on estimated increase in facility's annual operating budget<br />
4 - Estimated 2009 average monthly bill for a typical residential customer (ERU) w ithin the service area <strong>of</strong> the facility<br />
5 - Projected average monthly bill for a typical residential customer (ERU) if treatment alternatives are implemented<br />
Community Financial Impacts<br />
The third and final parameter measures the financial impact <strong>of</strong> nutrient limits from a<br />
community perspective, and accounts for the varied purchasing power <strong>of</strong> customers<br />
throughout the state. The metric is the ratio <strong>of</strong> the projected monthly bill that would result from<br />
each treatment alternative to an affordable monthly bill, based on a parameter established by<br />
the State <strong>Water</strong> <strong>Quality</strong> Board to determine project affordability.<br />
The <strong>Division</strong> employs an affordability criterion that is widely used to assess the affordability <strong>of</strong><br />
projects. The affordability threshold is equal to 1.4 percent <strong>of</strong> the median annual gross<br />
household income (MAGI) for customers served by a POTW. The MAGI estimate for customers<br />
<strong>of</strong> each POTW is multiplied by the affordability threshold parameter, then divided by 12<br />
(months) to determine the monthly ‘affordable’ wastewater bill for the typical customer.<br />
The projected monthly bill for each nutrient limit was then expressed as a percentage <strong>of</strong> the<br />
monthly affordable bill. The resulting affordability ratio for each nutrient limit for the SCWRF is<br />
shown in Table 11.<br />
UTAH POTW NUTRIENT REMOVAL COST IMPACT STUDY 12
SNYDERVILLE BASIN - SILVER CREEK WATER RECLAMATION FACILITY<br />
TABLE 11<br />
Community Financial Impacts: Affordability <strong>of</strong> Treatment Alternatives<br />
Tier 2 Tier 2N Tier 1 Tier 1N<br />
Median Annual Gross Income (MAGI) 1,2 $ 41,700 $ 41,700 $ 41,700 $ 41,700<br />
Affordability Threshold (% <strong>of</strong> MAGI) 3 1.4% 1.4% 1.4% 1.4%<br />
Monthly Affordability Criterion $48.65 $48.65 $48.65 $48.65<br />
Projected Average Monthly Bill $29.30 $29.30 $40.37 $42.72<br />
Meets State's Affordability Criterion? Yes Yes Yes Yes<br />
Estimated Bill as % <strong>of</strong> State Criterion 60% 60% 83% 88%<br />
1 - Based on the average MAGI <strong>of</strong> customers w ithin the service area <strong>of</strong> the facility<br />
2 - MAGI statistics compiled from 2008 census data<br />
3 - Parameter established by the State <strong>Water</strong> <strong>Quality</strong> Board to determine project affordability for POTWs<br />
6. Environmental Impacts <strong>of</strong> Nutrient Control Analysis<br />
This section summarizes the potential environmental benefits and impacts that would result<br />
from implementing the process upgrades established for the various tiers <strong>of</strong> nutrient control<br />
detailed in Section 3. The following aspects were considered for this evaluation:<br />
• Reduction <strong>of</strong> nutrient loads from POTW to receiving water bodies<br />
• Changes in chemical consumption<br />
• Changes in biosolids production<br />
• Changes in energy consumption<br />
• Changes in emissions from biosolids hauling and disposal and energy consumption<br />
As per the data received from SCWRF and per process modeling <strong>of</strong> the base condition (Tier 3),<br />
SCWRF is able to meet an effluent total nitrogen concentration <strong>of</strong> 20 mg/L with its existing<br />
infrastructure. Table 12 summarizes the annual reduction in nutrient loads in SCWRF effluent<br />
discharge if the process upgrades were implemented. The values shown are for the current<br />
(2009) flow and load conditions. It should be noted that any increase in flow or load to the<br />
POTW will result in higher reductions.<br />
TABLE 12<br />
Estimated Environmental Benefits <strong>of</strong> Nutrient Control<br />
Tier 2 Tier 2N Tier 1 Tier 1N<br />
Total phosphorus removed, lb/year 7,600 7,600 11,500 11,500<br />
Total nitrogen removed, lb/year ---- 0 ---- 42,615<br />
Note: Nutrient loads shown are the annual differential loads relative to the baseline (Tier 3)<br />
condition <strong>of</strong> the POTW for the year 2009.<br />
UTAH POTW NUTRIENT REMOVAL COST IMPACT STUDY 13
SNYDERVILLE BASIN - SILVER CREEK WATER RECLAMATION FACILITY<br />
The nutrient content <strong>of</strong> POTWs’ discharges and their receiving waters were also summarized to<br />
examine the potential <strong>of</strong> various treatment alternatives for reducing nutrient loads to those<br />
water bodies. The POTW loads were paired with estimated loads in the upstream receiving<br />
waters to create estimated downstream combined loads. Those combined stream and POTW<br />
loads could then be examined for the potential effects <strong>of</strong> future POTW nutrient removal<br />
alternatives. The average total nitrogen and phosphorus concentrations discharged by each<br />
POTW were either provided by the POTW during the data collection process or obtained from<br />
process modeling efforts. Upstream receiving historical water quality data was obtained from<br />
STORET. Data from STORET was summarized in order to yield average total nitrogen and total<br />
phosphorus concentrations that could then be paired with the appropriate POTW records. It<br />
should be noted that the data obtained from STORET were not verified by sampling and<br />
possible anomalies and outliers could exist in historical data sets due to certain events or errors<br />
in measurement.<br />
Table 13 shows the total phosphorus and total nitrogen concentration discharged by SCWRF to<br />
its receiving waters for baseline condition (Tier 3) and for each Tier <strong>of</strong> nutrient standard. The<br />
STORET ID from where historical water quality data were obtained is also presented in the<br />
Table.<br />
TABLE 13<br />
Estimates <strong>of</strong> Average TN and TP Concentrations for Baseline and Cumulative Treatments to Receiving <strong>Water</strong>s<br />
(mg/L)<br />
Tier 3 Tier 2 Tier 2N Tier 1 Tier 1N<br />
STORET<br />
LOCATION<br />
STORET<br />
ID<br />
FLOW<br />
(cfs)<br />
TP TN TP TN TP TN TP TN TP TN<br />
SCWRF ---- 2.166 2.78 20.0 1.0 N/A 1.0 20 0.1 N/A 0.1 10<br />
<strong>Silver</strong> <strong>Creek</strong><br />
above<br />
POTW<br />
4926800 5.367 0.23 0.63 ---- ---- ---- ---- ---- ---- ---- ----<br />
Combined Concentrations 0.96 6.20 0.45 N/A 0.45 6.19 0.19 N/A 0.19 3.70<br />
The process upgrades established to meet the four tiers <strong>of</strong> nutrient standards require increased<br />
energy consumptions, chemical usage and biosolids production. Metal-salt addition would be<br />
required to meet the phosphorus limits. This would result in increased chemical sludge<br />
generation and consequently increased biosolids production. Table 14 summarizes these<br />
environmental impacts <strong>of</strong> implementing the process upgrades to achieve the various tiers <strong>of</strong><br />
nutrient control. The values shown are on an annual basis, for the current (2009) flow and load<br />
conditions, and indicate the differential relative to the base line condition.<br />
UTAH POTW NUTRIENT REMOVAL COST IMPACT STUDY 14
SNYDERVILLE BASIN - SILVER CREEK WATER RECLAMATION FACILITY<br />
TABLE 14<br />
Estimated Environmental Impacts <strong>of</strong> Nutrient Control<br />
Chemical Use:<br />
Metal-salt use, lb/year<br />
Polymers, lb/year<br />
Biosolids Management:<br />
Tier 2 Tier 2N Tier 1 Tier 1N<br />
73,000 73,000 146,000 131,500<br />
730 730 1,100 730<br />
Biosolids produced, ton/year 20 20 40 35<br />
Average yearly hauling distance (1) 60 60 120 90<br />
Particulate emissions from hauling trucks, lb/year (2) 3 3 7 5<br />
Tailpipe emissions from hauling trucks, lb/year (3) 8 8 15 11<br />
CO 2 emissions from hauling trucks lb/year (4) 760 760 1,525 1,145<br />
Energy Consumption:<br />
Annual energy consumption, kwh<br />
11,300 11,300 318,300 677,450<br />
Air pollutant emissions, lb/year (5) CO 2<br />
NOx<br />
SOx<br />
CO<br />
VOC<br />
PM 10<br />
PM 2.5<br />
10,206 10,206 287,089 611,051<br />
16 16 446 948<br />
14 14 382 813<br />
1 1 21 44<br />
0 0 3 5<br />
0 0 6 13<br />
0 0 3 7<br />
Note: Values shown are the annual differential values relative to the base line condition (Tier 3) <strong>of</strong> the POTW for the<br />
year 2009<br />
(1) Based on the assumptions that the round trip hauling distance to the landfill is 60 miles and, that the facility uses<br />
22 ton trucks for hauling biosolids.<br />
(2)<br />
Includes PM 10 and PM 2.5 emissions in pounds per year. The emission factors to estimate particulate emissions<br />
were derived using the equations from AP-42, Fifth Edition, Vol. I, Section 13.2.1.: Paved Roads (11/2006).<br />
(3) Tailpipe emissions in pounds per year resulting from diesel combustion <strong>of</strong> hauling trucks were based on Emission<br />
standards Reference guide for Heavy-Duty and Nonroad Engines, EPA420-F-97-014 September 1997. It was<br />
assumed that the trucks would meet the emission standards for 1998+.<br />
(4) CO 2 emission factor in pounds per year for hauling trucks were derived from Rosso and Chau, 2009, WEF<br />
Residuals and Biosolids Conference Proceedings.<br />
(5) Emission factors for electricity are based on EPA Clean Energy Power Pr<strong>of</strong>iler<br />
(http://www.epa.gov/cleanenergy/energy-and-you/how-clean.html) assuming PacifiCorp UT region commercial<br />
customer and AP-42, Fifth Edition, Vol. I, Chapter 1, Section 1.1.: Bituminous and Sub bituminous coal Combustion<br />
(09/1998).<br />
UTAH POTW NUTRIENT REMOVAL COST IMPACT STUDY 15