A case study on improving the productivity using IE tools
A case study on improving the productivity using IE tools
A case study on improving the productivity using IE tools

You also want an ePaper? Increase the reach of your titles
YUMPU automatically turns print PDFs into web optimized ePapers that Google loves.
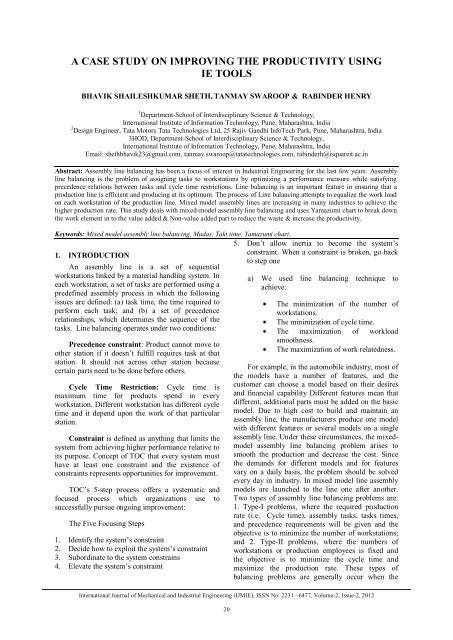
A CASE STUDY ON IMPROVING THE PRODUCTIVITY USING<br />
<strong>IE</strong> TOOLS<br />
BHAVIK SHAILESHKUMAR SHETH, TANMAY SWAROOP & RABINDER HENRY<br />
1 Department-School of Interdisciplinary Science & Technology,<br />
Internati<strong>on</strong>al Institute of Informati<strong>on</strong> Technology, Pune, Maharashtra, India<br />
2 Design Engineer, Tata Motors Tata Technologies Ltd, 25 Rajiv Gandhi InfoTech Park, Pune, Maharashtra, India<br />
3HOD, Department-School of Interdisciplinary Science & Technology,<br />
Internati<strong>on</strong>al Institute of Informati<strong>on</strong> Technology, Pune, Maharashtra, India<br />
Email: shethbhavik23@gmail.com, tanmay.swaroop@tatatechnologies.com, rabinderh@isquareit.ac.in<br />
Abstract: Assembly line balancing has been a focus of interest in Industrial Engineering for <strong>the</strong> last few years. Assembly<br />
line balancing is <strong>the</strong> problem of assigning tasks to workstati<strong>on</strong>s by optimizing a performance measure while satisfying<br />
precedence relati<strong>on</strong>s between tasks and cycle time restricti<strong>on</strong>s. Line balancing is an important feature in ensuring that a<br />
producti<strong>on</strong> line is efficient and producing at its optimum. The process of Line balancing attempts to equalize <strong>the</strong> work load<br />
<strong>on</strong> each workstati<strong>on</strong> of <strong>the</strong> producti<strong>on</strong> line. Mixed model assembly lines are increasing in many industries to achieve <strong>the</strong><br />
higher producti<strong>on</strong> rate. This <str<strong>on</strong>g>study</str<strong>on</strong>g> deals with mixed-model assembly line balancing and uses Yamazumi chart to break down<br />
<strong>the</strong> work element in to <strong>the</strong> value added & N<strong>on</strong>-value added part to reduce <strong>the</strong> waste & increase <strong>the</strong> <strong>productivity</strong>.<br />
Keywords: Mixed model assembly line balancing, Mudas, Takt time, Yamazumi chart.<br />
1. INTRODUCTION<br />
An assembly line is a set of sequential<br />
workstati<strong>on</strong>s linked by a material handling system. In<br />
each workstati<strong>on</strong>, a set of tasks are performed <strong>using</strong> a<br />
predefined assembly process in which <strong>the</strong> following<br />
issues are defined: (a) task time, <strong>the</strong> time required to<br />
perform each task; and (b) a set of precedence<br />
relati<strong>on</strong>ships, which determines <strong>the</strong> sequence of <strong>the</strong><br />
tasks. Line balancing operates under two c<strong>on</strong>diti<strong>on</strong>s:<br />
Precedence c<strong>on</strong>straint: Product cannot move to<br />
o<strong>the</strong>r stati<strong>on</strong> if it doesn‟t fulfill requires task at that<br />
stati<strong>on</strong>. It should not across o<strong>the</strong>r stati<strong>on</strong> because<br />
certain parts need to be d<strong>on</strong>e before o<strong>the</strong>rs.<br />
Cycle Time Restricti<strong>on</strong>: Cycle time is<br />
maximum time for products spend in every<br />
workstati<strong>on</strong>. Different workstati<strong>on</strong> has different cycle<br />
time and it depend up<strong>on</strong> <strong>the</strong> work of that particular<br />
stati<strong>on</strong>.<br />
C<strong>on</strong>straint is defined as anything that limits <strong>the</strong><br />
system from achieving higher performance relative to<br />
its purpose. C<strong>on</strong>cept of TOC that every system must<br />
have at least <strong>on</strong>e c<strong>on</strong>straint and <strong>the</strong> existence of<br />
c<strong>on</strong>straints represents opportunities for improvement.<br />
TOC‟s 5-step process offers a systematic and<br />
focused process which organizati<strong>on</strong>s use to<br />
successfully pursue <strong>on</strong>going improvement:<br />
The Five Foc<strong>using</strong> Steps<br />
1. Identify <strong>the</strong> system‟s c<strong>on</strong>straint<br />
2. Decide how to exploit <strong>the</strong> system‟s c<strong>on</strong>straint<br />
3. Subordinate to <strong>the</strong> system c<strong>on</strong>strains<br />
4. Elevate <strong>the</strong> system‟s c<strong>on</strong>straint<br />
5. D<strong>on</strong>‟t allow inertia to become <strong>the</strong> system‟s<br />
c<strong>on</strong>straint. When a c<strong>on</strong>straint is broken, go back<br />
to step <strong>on</strong>e<br />
a) We used line balancing technique to<br />
achieve:<br />
The minimizati<strong>on</strong> of <strong>the</strong> number of<br />
workstati<strong>on</strong>s.<br />
The minimizati<strong>on</strong> of cycle time.<br />
The maximizati<strong>on</strong> of workload<br />
smoothness.<br />
The maximizati<strong>on</strong> of work relatedness.<br />
For example, in <strong>the</strong> automobile industry, most of<br />
<strong>the</strong> models have a number of features, and <strong>the</strong><br />
customer can choose a model based <strong>on</strong> <strong>the</strong>ir desires<br />
and financial capability Different features mean that<br />
different, additi<strong>on</strong>al parts must be added <strong>on</strong> <strong>the</strong> basic<br />
model. Due to high cost to build and maintain an<br />
assembly line, <strong>the</strong> manufacturers produce <strong>on</strong>e model<br />
with different features or several models <strong>on</strong> a single<br />
assembly line. Under <strong>the</strong>se circumstances, <strong>the</strong> mixedmodel<br />
assembly line balancing problem arises to<br />
smooth <strong>the</strong> producti<strong>on</strong> and decrease <strong>the</strong> cost. Since<br />
<strong>the</strong> demands for different models and for features<br />
vary <strong>on</strong> a daily basis, <strong>the</strong> problem should be solved<br />
every day in industry. In mixed model line assembly<br />
models are launched to <strong>the</strong> line <strong>on</strong>e after ano<strong>the</strong>r.<br />
Two types of assembly line balancing problems are:<br />
1. Type-I problems, where <strong>the</strong> required producti<strong>on</strong><br />
rate (i.e. Cycle time), assembly tasks, tasks times,<br />
and precedence requirements will be given and <strong>the</strong><br />
objective is to minimize <strong>the</strong> number of workstati<strong>on</strong>s;<br />
and 2. Type-II problems, where <strong>the</strong> numbers of<br />
workstati<strong>on</strong>s or producti<strong>on</strong> employees is fixed and<br />
<strong>the</strong> objective is to minimize <strong>the</strong> cycle time and<br />
maximize <strong>the</strong> producti<strong>on</strong> rate. These types of<br />
balancing problems are generally occur when <strong>the</strong><br />
Internati<strong>on</strong>al Journal of Mechanical and Industrial Engineering (IJM<strong>IE</strong>), ISSN No. 2231 –6477, Volume-2, Issue-2, 2012<br />
20
organizati<strong>on</strong> wants to produce <strong>the</strong> optimum number<br />
of items <strong>using</strong> a fixed number of workstati<strong>on</strong>s<br />
without purchasing new machines or expanding its<br />
facilities.<br />
1.1 Lean Manufacturing<br />
The use of <strong>the</strong> term “Lean”, in a business or<br />
manufacturing envir<strong>on</strong>ment describes a philosophy<br />
that incorporates a collecti<strong>on</strong> of <strong>tools</strong> and techniques<br />
into <strong>the</strong> business process to optimize time, human<br />
resources, assets and <strong>productivity</strong>, while <strong>improving</strong><br />
<strong>the</strong> quality level of products and services to <strong>the</strong>ir<br />
customers.<br />
Lean defines seven different types of waste that<br />
are tackled to minimize or eliminate <strong>the</strong>m.<br />
They are as follows:<br />
Overproducti<strong>on</strong>,<br />
Extra-Processing,<br />
Over Stocking,<br />
Excessive Moti<strong>on</strong>,<br />
Defects and Rework<br />
2. THE NEED<br />
One of Automobile Company had plant capacity<br />
of producing 60,000 vehicles/ year. Company wants<br />
to launch <strong>the</strong> new model <strong>on</strong> same existing c<strong>on</strong>veyor<br />
line. Work c<strong>on</strong>tent of <strong>the</strong> new model is more compare<br />
to existing model. One obvious c<strong>on</strong>venti<strong>on</strong>al method<br />
was to increase <strong>the</strong> number of work stati<strong>on</strong>s which<br />
would have resulted in capital investment for<br />
providing additi<strong>on</strong>al equipment, <strong>tools</strong> & utilities <strong>on</strong><br />
<strong>on</strong>e hand and increase of manpower <strong>on</strong> <strong>the</strong> o<strong>the</strong>r<br />
hand. So it was decided to increase <strong>the</strong> capacity by<br />
<strong>improving</strong> <strong>the</strong> <strong>productivity</strong>. In simple terms <strong>the</strong><br />
producti<strong>on</strong> from 120 vehicle / day to 145 vehicle/day<br />
through reducing <strong>the</strong> Takt time from 10 minutes/<br />
vehicle to 6.8 minutes / vehicle.<br />
A <str<strong>on</strong>g>case</str<strong>on</strong>g> <str<strong>on</strong>g>study</str<strong>on</strong>g> <strong>on</strong> <strong>improving</strong> <strong>the</strong> <strong>productivity</strong> <strong>using</strong> <strong>IE</strong> <strong>tools</strong><br />
3. YAMAZUMI CHART -- THE TOOL<br />
Yamazumi is a Japanese word comprising Yama<br />
(Mountain) & Zumi (Building up) meaning „Building<br />
up of Mountain”. It is a measurement of total time<br />
taken in Minutes/ Sec<strong>on</strong>ds for completing all<br />
activities resulting in a finished product.<br />
The time spent for doing any process can be<br />
divided into two broad categories:<br />
a) Time spent in doing Standard Job Element<br />
b) Time spent in Muda (walking, picking,<br />
unpacking etc.)<br />
A standard job element is a value added activity<br />
e.g. tightening of bolt for fixing a part which may<br />
take 6 sec<strong>on</strong>ds. However <strong>the</strong> time spent in walking to<br />
a rack & picking <strong>the</strong> bolt and bringing to work stati<strong>on</strong><br />
which may be making 4 sec<strong>on</strong>ds is a n<strong>on</strong>-value added<br />
activity and hence a waste, Muda.<br />
4. MAKING OF YAMAZUMI CHART<br />
The first step is to carry out a time <str<strong>on</strong>g>study</str<strong>on</strong>g> of all<br />
process elements involved and record <strong>the</strong> time for<br />
standard job element and MUDA. For example a<br />
finished product may require processes, which may<br />
have time <str<strong>on</strong>g>study</str<strong>on</strong>g> as shown below:<br />
The next step is to put <strong>the</strong>se time elements <strong>on</strong>e<br />
<strong>on</strong> top of <strong>the</strong> o<strong>the</strong>r to get <strong>the</strong> total time for <strong>the</strong><br />
finished product. This is what is called a Yamazumi<br />
Chart.<br />
2.1 Understanding of 3Ms<br />
3Ms is an abbreviati<strong>on</strong> of 3 Japanese letters<br />
which start with English<br />
Alphabet „M‟ namely:<br />
MURI = Over Burden<br />
MUDA = Waste<br />
MURA = Unevenness<br />
Each department / Secti<strong>on</strong> of Automobile<br />
company was asked to examine critically each work<br />
activity at every stati<strong>on</strong> and eliminate / reduce 3Ms<br />
specially <strong>the</strong> MUDA. As MUDA will reduce, <strong>the</strong><br />
time spent for doing a process will reduce, which will<br />
in turn reduce Man-hour/ Vehicle.<br />
5. METHEDOLOGY<br />
Fig.1 Yamazumi Chart<br />
5.1 Typical <str<strong>on</strong>g>case</str<strong>on</strong>g> <str<strong>on</strong>g>study</str<strong>on</strong>g> of trim line in assembly shop<br />
The trim line assembly shop has 11 stati<strong>on</strong>s and <strong>the</strong><br />
worker work <strong>on</strong> <strong>the</strong> both left hand & right hand of <strong>the</strong><br />
vehicle <strong>on</strong> <strong>the</strong> c<strong>on</strong>veyer as shown in figure 2.<br />
Internati<strong>on</strong>al Journal of Mechanical and Industrial Engineering (IJM<strong>IE</strong>), ISSN No. 2231 –6477, Volume-2, Issue-2, 2012<br />
21
A <str<strong>on</strong>g>case</str<strong>on</strong>g> <str<strong>on</strong>g>study</str<strong>on</strong>g> <strong>on</strong> <strong>improving</strong> <strong>the</strong> <strong>productivity</strong> <strong>using</strong> <strong>IE</strong> <strong>tools</strong><br />
5.2 Steps taken to reduce muda<br />
Fig.2 Trim line of GA shop<br />
Take <strong>the</strong> example of <strong>the</strong> upcoming model is<br />
being manufactured <strong>on</strong> <strong>the</strong> existing assembly line.<br />
For that we have to balance <strong>the</strong> assembly line. In this<br />
<str<strong>on</strong>g>case</str<strong>on</strong>g> Master Trainers assemble and disassemble <strong>the</strong><br />
car, learn <strong>the</strong> new methods of efficiently performing<br />
<strong>the</strong> works of <strong>the</strong> General Assembly shop. Based <strong>on</strong><br />
several rounds of trials over a period of 6 m<strong>on</strong>ths an<br />
array of arrangements are made to ensure that <strong>the</strong>ir<br />
implementati<strong>on</strong> <strong>on</strong> <strong>the</strong> general line doesn‟t hamper<br />
<strong>the</strong> producti<strong>on</strong> of o<strong>the</strong>r models being built <strong>on</strong> <strong>the</strong><br />
same line. However, this isn‟t always <strong>the</strong> <str<strong>on</strong>g>case</str<strong>on</strong>g> and so<br />
some modificati<strong>on</strong>s are made in order to<br />
accommodate <strong>the</strong> new model as well. After this <strong>the</strong><br />
SOS (Standard operati<strong>on</strong> sheet) of all <strong>the</strong> stati<strong>on</strong>s<br />
team wise are taken. Then <strong>the</strong> Master Trainers<br />
perform <strong>the</strong> activities as per <strong>the</strong> SOS. These activities<br />
are video recorded. And <strong>the</strong> timings are note down. If<br />
<strong>the</strong> Master Trainers face any problem or an issue is<br />
raised <strong>the</strong>n it‟s also noted down for future<br />
corresp<strong>on</strong>dence. This cycle is repeated several times<br />
until <strong>the</strong> vehicle becomes “producti<strong>on</strong> ready”. Proper<br />
workload distributi<strong>on</strong> is essential to ensure lean<br />
manufacturing.<br />
Each work element is divided into <strong>the</strong> following<br />
parts.<br />
Basic element c<strong>on</strong>tent<br />
Work time<br />
Walk time<br />
Wait time<br />
Taking a typical example of stati<strong>on</strong> No. 2 Left<br />
Hand <strong>the</strong>re are 6 process elements d<strong>on</strong>e <strong>on</strong> <strong>the</strong><br />
stati<strong>on</strong>. A careful Time Study of each process <strong>on</strong> this<br />
stati<strong>on</strong> revealed <strong>the</strong> following graph showing time<br />
spent <strong>on</strong> Value added and n<strong>on</strong>-value added activities<br />
(fig.3):<br />
5.2.1 Reducti<strong>on</strong> in Walking Time<br />
51% of n<strong>on</strong>-value added activity c<strong>on</strong>sists of walking<br />
by Team member for going to part rack for picking<br />
<strong>the</strong> part, bringing it to <strong>the</strong> vehicle, installing it and<br />
<strong>the</strong>n going back to part rack for <strong>the</strong> next part. This<br />
movement was reduced by:<br />
Reducing Picking frequency of parts from racks<br />
Introducti<strong>on</strong> of Movable Rack<br />
5.2.2 Reducti<strong>on</strong> in Picking Time<br />
As 27% of <strong>the</strong> n<strong>on</strong>-value added time spent in<br />
picking of parts <strong>the</strong> following counter measure were<br />
taken to reduce <strong>the</strong><br />
Same:<br />
Introducti<strong>on</strong> of Flow Racks<br />
Introducti<strong>on</strong> of Hardware & small part<br />
(Grommets, clips etc.) Racks<br />
5.3 MOST (Maynard operati<strong>on</strong> Sequence<br />
Technique)<br />
MOST (Maynard Operati<strong>on</strong> Sequence<br />
Technique) is a work measurement technique<br />
developed by H. B. Maynard and Company. The<br />
c<strong>on</strong>cept of MOST is to analyze a job into its<br />
fundamental human activities, apply basic times for<br />
<strong>the</strong>se from tables and syn<strong>the</strong>size <strong>the</strong>m into a basic<br />
time for <strong>the</strong> complete job. The basic elements include<br />
<strong>the</strong> following:<br />
Reach for an object or a locati<strong>on</strong>.<br />
Get an object, touching it or closing <strong>the</strong> fingers<br />
around it.<br />
Move an object a specified distance to a<br />
specified place.<br />
Release an object to relinquish c<strong>on</strong>trol <strong>on</strong> it<br />
For each of <strong>the</strong>se acti<strong>on</strong>s basic times are tabled<br />
in MOST.<br />
MOST is a powerful analytical tool that helps<br />
increase <strong>productivity</strong>, improve methods, facilitate<br />
planning, establish workloads, estimate labor costs,<br />
improve safety, and maximize resources, MOST can<br />
be applied to any type of work for which a method<br />
can be defined and described.<br />
Fig. 3 Example of some activities of <strong>the</strong> LH side stati<strong>on</strong><br />
6. YAMAZUMI CHARTS FOR OTHER<br />
PROCESS.<br />
The same exercise was c<strong>on</strong>ducted for each and<br />
every stati<strong>on</strong> of weld shop, paint shop, general<br />
assembly shop and quality assurance and everywhere<br />
<strong>the</strong>re was identificati<strong>on</strong> and recogniti<strong>on</strong> of 3M‟s and<br />
everywhere when countermeasures were taken <strong>the</strong><br />
Internati<strong>on</strong>al Journal of Mechanical and Industrial Engineering (IJM<strong>IE</strong>), ISSN No. 2231 –6477, Volume-2, Issue-2, 2012<br />
22
esult was reducti<strong>on</strong> in man-hour, and c<strong>on</strong>sequent<br />
decrease of Takt Time.<br />
Takt time is <strong>the</strong> time in which a unit must be<br />
produced in order to match <strong>the</strong> rate of customer<br />
demand.<br />
Figure 4 shows <strong>the</strong> unbalanced situati<strong>on</strong> of some<br />
stati<strong>on</strong> before line balancing.<br />
100%<br />
80%<br />
60%<br />
40%<br />
20%<br />
0%<br />
GA<br />
G1<br />
ST 0<br />
GA<br />
G1<br />
ST<br />
1.1<br />
GA<br />
G1<br />
ST<br />
1.2<br />
GA<br />
G1<br />
ST<br />
2.1<br />
Fig. 4 YAMAZUMI chart before line balancing<br />
Identify <strong>the</strong> area <strong>on</strong> which <strong>the</strong> work load is more and<br />
<strong>the</strong>n transfer <strong>the</strong> activities to <strong>the</strong> o<strong>the</strong>r stati<strong>on</strong>.<br />
Figure 5 shows <strong>the</strong> c<strong>on</strong>diti<strong>on</strong> of <strong>the</strong> stati<strong>on</strong>s after<br />
<strong>the</strong> line balancing.<br />
100%<br />
A <str<strong>on</strong>g>case</str<strong>on</strong>g> <str<strong>on</strong>g>study</str<strong>on</strong>g> <strong>on</strong> <strong>improving</strong> <strong>the</strong> <strong>productivity</strong> <strong>using</strong> <strong>IE</strong> <strong>tools</strong><br />
GA<br />
G1<br />
ST<br />
2.2<br />
GA<br />
G1<br />
ST 3<br />
Wait<br />
Time<br />
Walk<br />
Time<br />
Key Area Before After<br />
Productivity Trim line 33 28<br />
( Man-power Chassis line 36 30<br />
Requirement ) Total 69 58<br />
Efficiency & Element Utilizati<strong>on</strong>. (Fig. 6)<br />
40<br />
35<br />
30<br />
25<br />
20<br />
15<br />
10<br />
5<br />
0<br />
BEFORE<br />
Fig. 6 Comparis<strong>on</strong> of man power requirement before and after<br />
line balancing<br />
7. CONCLUSION<br />
The strategy & techniques adapted at<br />
Automobile Company were based <strong>on</strong> Toyota<br />
Producti<strong>on</strong> System (TPS) and can be applied to o<strong>the</strong>r<br />
companies especially those involved in c<strong>on</strong>tinuous<br />
assembly line. After doing mixed model line<br />
balancing by mutati<strong>on</strong> & cross over operati<strong>on</strong><br />
between team & stati<strong>on</strong> with c<strong>on</strong>sidering all<br />
c<strong>on</strong>straint & precedence relati<strong>on</strong>ship. As Toyota<br />
Producti<strong>on</strong> System is based <strong>on</strong> „Pull‟ <strong>the</strong> Takt Time<br />
of <strong>the</strong> preceding stati<strong>on</strong> has to be <strong>the</strong> same as that of<br />
<strong>the</strong> following stati<strong>on</strong> The man-power requirement<br />
reduced from 69 to 58 <strong>on</strong>ly in <strong>the</strong> general assembly<br />
shop. Also increase <strong>the</strong> man-power utilizati<strong>on</strong> <strong>on</strong><br />
average from <strong>the</strong> 60% to 80 %.<br />
REFERENCES<br />
MAN-POWER<br />
REQUIRED<br />
AFTER<br />
TRIM LINE<br />
CHASSI INE<br />
[1]. Introducti<strong>on</strong> to work <str<strong>on</strong>g>study</str<strong>on</strong>g>, By M.N.Pal, third editi<strong>on</strong>,<br />
OXFORD & IBH Publicati<strong>on</strong> CO.PVT.LTD, New Delhi<br />
80%<br />
60%<br />
40%<br />
20%<br />
0%<br />
GA GA GA GA<br />
G1<br />
GA<br />
G1<br />
GA<br />
G1 G1<br />
ST<br />
G1<br />
ST<br />
G1<br />
ST ST<br />
0<br />
ST<br />
1.1<br />
ST<br />
1.22.1<br />
2.2 3<br />
Wait Time<br />
Walk Time<br />
Work Time<br />
BEC Time<br />
[2]. “U-shaped assembly line layouts and <strong>the</strong>ir impact <strong>on</strong> labor<br />
<strong>productivity</strong>: An experimental <str<strong>on</strong>g>study</str<strong>on</strong>g>”, Gerald R.Aase, John<br />
R.Ols<strong>on</strong>, Marc J.Schniederjans, European Journal of<br />
Operati<strong>on</strong>al Research 156 (2004) 698–711<br />
[3]. CASE STUDY : PRODUCTIVITY ENHANCEMENT AT<br />
INDUS MOTOR CO. LTD. THROUGH FOCUSING ON<br />
3M‟S Muri (Over Burden), Muda (N<strong>on</strong> Value Added), Mura<br />
(Unevenness) by M. Mohiyuddin General Manager,<br />
(Producti<strong>on</strong> & Prod. Engg.), Indus Motor Company Ltd.<br />
[4]. ”Re-balancing of Generalized Assembly Lines –<br />
Searching Optimal Soluti<strong>on</strong>s for SALBP”, Chowdury Md.<br />
Luthfur Rahman Internati<strong>on</strong>al C<strong>on</strong>ference <strong>on</strong> Industrial<br />
Engineering and Operati<strong>on</strong>s Management Dhaka,<br />
Bangladesh, January 9 – 10, 2010<br />
Fig. 5 YAMAZUMI chart after line balancing<br />
After Line balancing take c<strong>on</strong>siderati<strong>on</strong> of <strong>the</strong><br />
c<strong>on</strong>straint regarding material movement, line space<br />
c<strong>on</strong>strains, Stati<strong>on</strong> c<strong>on</strong>strains, man-power<br />
c<strong>on</strong>strain002E And try to improve <strong>the</strong> Line<br />
[5]. Emanuel Falkenauer “Line Balancing in <strong>the</strong> Real World”<br />
Internati<strong>on</strong>al C<strong>on</strong>ference <strong>on</strong> Product Lifecycle Management<br />
[6]. Erdal Erel & Subhash C. Sarin “A survey of <strong>the</strong> assembly<br />
line balancing procedures”,<br />
<br />
Internati<strong>on</strong>al Journal of Mechanical and Industrial Engineering (IJM<strong>IE</strong>), ISSN No. 2231 –6477, Volume-2, Issue-2, 2012<br />
23