Book Information / Sample Chapter(s) (PDF) - Textbook Media
Book Information / Sample Chapter(s) (PDF) - Textbook Media
Book Information / Sample Chapter(s) (PDF) - Textbook Media

Create successful ePaper yourself
Turn your PDF publications into a flip-book with our unique Google optimized e-Paper software.
70 <strong>Chapter</strong> 4 Demand and Supply<br />
Government policies can affect the cost of production and the supply curve through<br />
taxes, regulations, and subsidies. For example, the U.S. government imposes a tax on<br />
alcoholic beverages that collects about $8 billion per year from producers. There is a<br />
wide array of government regulations that require firms to spend money to provide a<br />
cleaner environment or a safer workplace. A government subsidy, on the other hand,<br />
occurs when the government sends money to a firm directly or when the government<br />
reduces the firm’s taxes if the firm carries out certain actions. For example, the U.S.<br />
government pays more than $20 billion per year directly to firms to support research and<br />
development. From the perspective of a firm, taxes or regulations are an additional cost<br />
of production that shifts supply to the left, leading the firm to produce a lower quantity<br />
at every given price. However, government subsidies reduce the cost of production and<br />
increase supply.<br />
Summing Up Factors That Change Supply<br />
Natural disasters, changes in the cost of inputs, new technologies, and the impact of<br />
government decisions all affect the cost of production for firms. In turn, these factors<br />
affect firms’ willingness to supply at a given price. Exhibit 4-7 summarizes factors that<br />
change the supply of goods and services. Notice that a change in the price of the product<br />
itself is not among the factors that shift the supply curve. Although a change in price<br />
of a good or service typically causes a change in quantity supplied along the supply<br />
curve for that specific good or service, it does not cause the supply curve itself to shift.<br />
Because demand and supply curves appear on a two-dimensional diagram with only<br />
price and quantity on the axes, an unwary visitor to the land of economics might be<br />
fooled into believing that economics is only about four topics: demand, supply, price,<br />
and quantity. However, demand and supply are really “umbrella” concepts: demand<br />
covers all of the factors that affect demand, and supply covers all of the factors that<br />
affect supply. The factors other than price that affect demand and supply are included<br />
by using shifts in the demand or the supply curve. In this way, the two-dimensional<br />
demand and supply model becomes a powerful tool for analyzing a wide range of<br />
economic circumstances.<br />
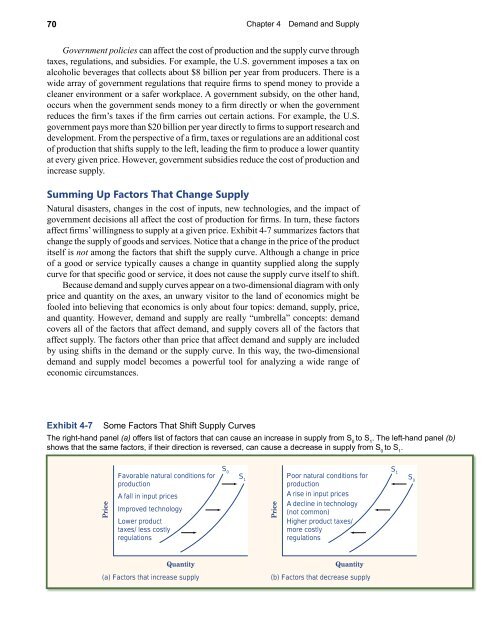
Exhibit 4-7 Some Factors That Shift Supply Curves<br />
The right-hand panel (a) offers list of factors that can cause an increase in supply from S 0<br />
to S 1<br />
. The left-hand panel (b)<br />
shows that the same factors, if their direction is reversed, can cause a decrease in supply from S 0<br />
to S 1<br />
.<br />
Price<br />
Favorable natural conditions for<br />
production<br />
A fall in input prices<br />
Improved technology<br />
Lower product<br />
taxes/ less costly<br />
regulations<br />
S 0<br />
S 1<br />
Price<br />
Poor natural conditions for<br />
production<br />
A rise in input prices<br />
A decline in technology<br />
(not common)<br />
Higher product taxes/<br />
more costly<br />
regulations<br />
S 1<br />
S 0<br />
Quantity<br />
(a) Factors that increase supply<br />
Quantity<br />
(b) Factors that decrease supply