Book Information / Sample Chapter(s) (PDF) - Textbook Media
Book Information / Sample Chapter(s) (PDF) - Textbook Media
Book Information / Sample Chapter(s) (PDF) - Textbook Media

Create successful ePaper yourself
Turn your PDF publications into a flip-book with our unique Google optimized e-Paper software.
<strong>Chapter</strong> 4 Demand and Supply<br />
63<br />
Equilibrium—Where Demand and Supply Cross<br />
Because the graphs for demand and supply curves both have price on the vertical axis<br />
and quantity on the horizontal axis, the demand curve and supply curve for a particular<br />
good or service can appear on the same graph. Together, demand and supply determine<br />
the price and the quantity that will be bought and sold in a market.<br />
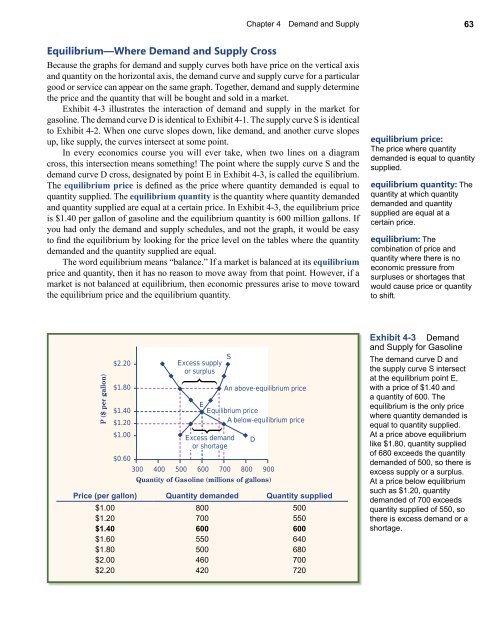
Exhibit 4-3 illustrates the interaction of demand and supply in the market for<br />
gasoline. The demand curve D is identical to Exhibit 4-1. The supply curve S is identical<br />
to Exhibit 4-2. When one curve slopes down, like demand, and another curve slopes<br />
up, like supply, the curves intersect at some point.<br />
In every economics course you will ever take, when two lines on a diagram<br />
cross, this intersection means something! The point where the supply curve S and the<br />
demand curve D cross, designated by point E in Exhibit 4-3, is called the equilibrium.<br />
The equilibrium price is defined as the price where quantity demanded is equal to<br />
quantity supplied. The equilibrium quantity is the quantity where quantity demanded<br />
and quantity supplied are equal at a certain price. In Exhibit 4-3, the equilibrium price<br />
is $1.40 per gallon of gasoline and the equilibrium quantity is 600 million gallons. If<br />
you had only the demand and supply schedules, and not the graph, it would be easy<br />
to find the equilibrium by looking for the price level on the tables where the quantity<br />
demanded and the quantity supplied are equal.<br />
The word equilibrium means “balance.” If a market is balanced at its equilibrium<br />
price and quantity, then it has no reason to move away from that point. However, if a<br />
market is not balanced at equilibrium, then economic pressures arise to move toward<br />
the equilibrium price and the equilibrium quantity.<br />
equilibrium price:<br />
The price where quantity<br />
demanded is equal to quantity<br />
supplied.<br />
equilibrium quantity: The<br />
quantity at which quantity<br />
demanded and quantity<br />
supplied are equal at a<br />
certain price.<br />
equilibrium: The<br />
combination of price and<br />
quantity where there is no<br />
economic pressure from<br />
surpluses or shortages that<br />
would cause price or quantity<br />
to shift.<br />
P ($ per gallon)<br />
$2.20<br />
$1.80<br />
$1.40<br />
$1.20<br />
$1.00<br />
Excess supply<br />
or surplus<br />
$0.60<br />
300 400 500 600 700 800 900<br />
Quantity of Gasoline (millions of gallons)<br />
E<br />
Price (per gallon) Quantity demanded Quantity supplied<br />
$1.00 800 500<br />
$1.20 700 550<br />
$1.40 600 600<br />
$1.60 550 640<br />
$1.80 500 680<br />
$2.00 460 700<br />
$2.20 420 720<br />
S<br />
An above-equilibrium price<br />
Equilibrium price<br />
A below-equilibrium price<br />
Excess demand<br />
or shortage<br />
D<br />
Exhibit 4-3 Demand<br />
and Supply for Gasoline<br />
The demand curve D and<br />
the supply curve S intersect<br />
at the equilibrium point E,<br />
with a price of $1.40 and<br />
a quantity of 600. The<br />
equilibrium is the only price<br />
where quantity demanded is<br />
equal to quantity supplied.<br />
At a price above equilibrium<br />
like $1.80, quantity supplied<br />
of 680 exceeds the quantity<br />
demanded of 500, so there is<br />
excess supply or a surplus.<br />
At a price below equilibrium<br />
such as $1.20, quantity<br />
demanded of 700 exceeds<br />
quantity supplied of 550, so<br />
there is excess demand or a<br />
shortage.