

fertility and family planning trends in urban nigeria: a research brief
fertility and family planning trends in urban nigeria: a research brief
fertility and family planning trends in urban nigeria: a research brief

You also want an ePaper? Increase the reach of your titles
YUMPU automatically turns print PDFs into web optimized ePapers that Google loves.
data from the 1990, 1999 3 , 2003 <strong>and</strong> 2008 rounds of<br />
the Nigeria Demographic <strong>and</strong> Health Survey (NDHS). 4<br />
Data from <strong>urban</strong> survey respondents were recoded<br />
<strong>and</strong> reanalyzed to describe levels <strong>and</strong> <strong>trends</strong> <strong>in</strong> key<br />
<strong>fertility</strong>, <strong>family</strong> <strong>plann<strong>in</strong>g</strong> <strong>and</strong> reproductive health<br />
<strong>in</strong>dicators. The analysis also exam<strong>in</strong>es differentials<br />
by region, household wealth <strong>and</strong> education, although<br />
these variables are <strong>in</strong>ter-related. There is considerable<br />
overlap between the wealthy <strong>and</strong> better educated<br />
groups.<br />
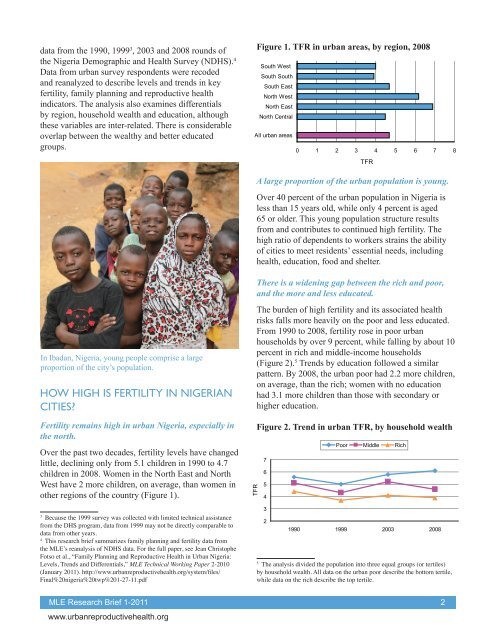
Figure 1. TFR <strong>in</strong> <strong>urban</strong> areas, by region, 2008<br />
TFR <strong>in</strong> <strong>urban</strong> areas, by region, 2008 NDHS<br />
South West<br />
South South<br />
South East<br />
North West<br />
North East<br />
North Central<br />
All <strong>urban</strong> areas<br />
0 1 2 3 4 5 6 7 8<br />
TFR<br />
A large proportion of the <strong>urban</strong> population is young.<br />
Over 40 percent of the <strong>urban</strong> population <strong>in</strong> Nigeria is<br />
less than 15 years old, while only 4 percent is aged<br />
65 or older. This young population structure results<br />
from <strong>and</strong> contributes to cont<strong>in</strong>ued high <strong>fertility</strong>. The<br />
high ratio of dependents to workers stra<strong>in</strong>s the ability<br />
of cities to meet residents’ essential needs, <strong>in</strong>clud<strong>in</strong>g<br />
health, education, food <strong>and</strong> shelter.<br />
There is a widen<strong>in</strong>g gap between the rich <strong>and</strong> poor,<br />
<strong>and</strong> the more <strong>and</strong> less educated.<br />
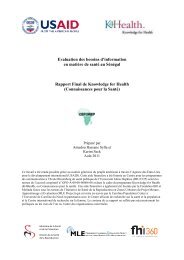
In Ibadan, Nigeria, young people comprise a large<br />
proportion of the city’s population.<br />
HOW HIGH IS FERTILITY IN NIGERIAN<br />
CITIES?<br />
Fertility rema<strong>in</strong>s high <strong>in</strong> <strong>urban</strong> Nigeria, especially <strong>in</strong><br />
the north.<br />
Over the past two decades, <strong>fertility</strong> levels have changed<br />
little, decl<strong>in</strong><strong>in</strong>g only from 5.1 children <strong>in</strong> 1990 to 4.7<br />
children <strong>in</strong> 2008. Women <strong>in</strong> the North East <strong>and</strong> North<br />
West have 2 more children, on average, than women <strong>in</strong><br />
other regions of the country (Figure 1).<br />
3<br />
Because the 1999 survey was collected with limited technical assistance<br />
from the DHS program, data from 1999 may not be directly comparable to<br />
data from other years.<br />
4<br />
This <strong>research</strong> <strong>brief</strong> summarizes <strong>family</strong> <strong>plann<strong>in</strong>g</strong> <strong>and</strong> <strong>fertility</strong> data from<br />
the MLE’s reanalysis of NDHS data. For the full paper, see Jean Christophe<br />
Fotso et al., “Family Plann<strong>in</strong>g <strong>and</strong> Reproductive Health <strong>in</strong> Urban Nigeria:<br />
Levels, Trends <strong>and</strong> Differentials,” MLE Technical Work<strong>in</strong>g Paper 2-2010<br />
(January 2011). http://www.<strong>urban</strong>reproductivehealth.org/system/files/<br />
F<strong>in</strong>al%20<strong>nigeria</strong>%20twp%201-27-11.pdf<br />
TFR<br />
The burden of high <strong>fertility</strong> <strong>and</strong> its associated health<br />
risks falls more heavily on the poor <strong>and</strong> less educated.<br />
From 1990 to 2008, <strong>fertility</strong> rose <strong>in</strong> poor <strong>urban</strong><br />
households by over 9 percent, while fall<strong>in</strong>g by about 10<br />
percent <strong>in</strong> rich <strong>and</strong> middle-<strong>in</strong>come households<br />
(Figure 2). 5 Trends by education followed a similar<br />
pattern. By 2008, the <strong>urban</strong> poor had 2.2 more children,<br />
on average, than the rich; women with no education<br />
had 3.1 more children than those with secondary or<br />
higher education.<br />
Figure 2. Trend <strong>in</strong> <strong>urban</strong> TFR, by household wealth<br />
Trend <strong>in</strong> <strong>urban</strong> TFR, by household wealth<br />
7<br />
6<br />
5<br />
4<br />
3<br />
2<br />
Poor Middle Rich<br />
1990 1999 2003 2008<br />
5<br />
The analysis divided the population <strong>in</strong>to three equal groups (or tertiles)<br />
by household wealth. All data on the <strong>urban</strong> poor describe the bottom tertile,<br />
while data on the rich describe the top tertile.<br />
MLE Research Brief 1-2011 2<br />
www.<strong>urban</strong>reproductivehealth.org


![questionnaire no: [__|__|__|__|__|__|__|__|__] - Measurement ...](https://img.yumpu.com/22729956/1/184x260/questionnaire-no-measurement-.jpg?quality=85)
![questionnaire serial no:[__|__|__|__] - Your Resource for Urban ...](https://img.yumpu.com/10870216/1/184x260/questionnaire-serial-no-your-resource-for-urban-.jpg?quality=85)