

fertility and family planning trends in urban nigeria: a research brief
fertility and family planning trends in urban nigeria: a research brief
fertility and family planning trends in urban nigeria: a research brief

You also want an ePaper? Increase the reach of your titles
YUMPU automatically turns print PDFs into web optimized ePapers that Google loves.
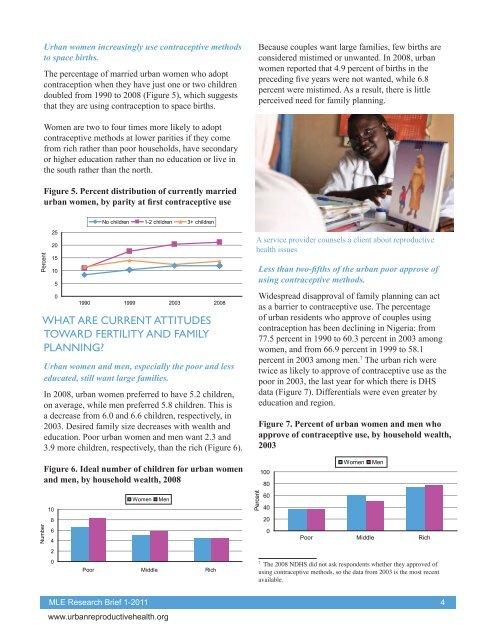
Urban women <strong>in</strong>creas<strong>in</strong>gly use contraceptive methods<br />
to space births.<br />
The percentage of married <strong>urban</strong> women who adopt<br />
contraception when they have just one or two children<br />
doubled from 1990 to 2008 (Figure 5), which suggests<br />
that they are us<strong>in</strong>g contraception to space births.<br />
Because couples want large families, few births are<br />
considered mistimed or unwanted. In 2008, <strong>urban</strong><br />
women reported that 4.9 percent of births <strong>in</strong> the<br />
preced<strong>in</strong>g five years were not wanted, while 6.8<br />
percent were mistimed. As a result, there is little<br />
perceived need for <strong>family</strong> <strong>plann<strong>in</strong>g</strong>.<br />
Women Percent are two distribution to four of times currently more married likely <strong>urban</strong> to adopt<br />
contraceptive<br />
women by<br />
methods<br />
parity at first<br />
at lower<br />
contraceptive<br />
parities<br />
use<br />
if they come<br />
from rich rather than poor households, have secondary<br />
or higher education rather than no education or live <strong>in</strong><br />
the south rather than the north.<br />
Figure 5. Percent distribution of currently married<br />
<strong>urban</strong> women, by parity at first contraceptive use<br />
No children 1-2 children 3+ children<br />
Percent<br />
25<br />
20<br />
15<br />
10<br />
5<br />
0<br />
1990 1999 2003 2008<br />
WHAT ARE CURRENT ATTITUDES<br />
TOWARD FERTILITY AND FAMILY<br />
PLANNING?<br />
Urban women <strong>and</strong> men, especially the poor <strong>and</strong> less<br />
educated, still want large families.<br />
In 2008, <strong>urban</strong> women preferred to have 5.2 children,<br />
on average, while men preferred 5.8 children. This is<br />
Ideal number of children for <strong>urban</strong> women <strong>and</strong><br />
a decrease men, from by household 6.0 <strong>and</strong> 6.6 wealth, children, 2008 NDHS respectively, <strong>in</strong><br />
2003. Desired <strong>family</strong> size decreases with wealth <strong>and</strong><br />
education. Poor <strong>urban</strong> women <strong>and</strong> men want 2.3 <strong>and</strong><br />
3.9 more children, respectively, than the rich (Figure 6).<br />
Number<br />
Figure 6. Ideal number of children for <strong>urban</strong> women<br />
<strong>and</strong> men, by household wealth, 2008<br />
10<br />
8<br />
6<br />
4<br />
2<br />
0<br />
Women<br />
Men<br />
Poor Middle Rich<br />
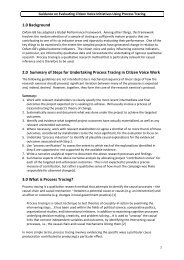
A service provider counsels a client about reproductive<br />
health issues<br />
Less than two-fifths of the <strong>urban</strong> poor approve of<br />
us<strong>in</strong>g contraceptive methods.<br />
Widespread disapproval of <strong>family</strong> <strong>plann<strong>in</strong>g</strong> can act<br />
as a barrier to contraceptive use. The percentage<br />
of <strong>urban</strong> residents who approve of couples us<strong>in</strong>g<br />
contraception has been decl<strong>in</strong><strong>in</strong>g <strong>in</strong> Nigeria: from<br />
77.5 percent <strong>in</strong> 1990 to 60.3 percent <strong>in</strong> 2003 among<br />
women, <strong>and</strong> from 66.9 percent <strong>in</strong> 1999 to 58.1<br />
percent <strong>in</strong> 2003 Percent among of <strong>urban</strong> men. women 7 The <strong>urban</strong> <strong>and</strong> men rich who were<br />
twice as likely to approve of contraceptive of use, use as the<br />
poor <strong>in</strong> 2003, by the household last year for wealth, which 2003 there NDHS is DHS<br />
data (Figure 7). Differentials were even greater by<br />
education <strong>and</strong> region.<br />
Percent<br />
Figure 7. Percent of <strong>urban</strong> women <strong>and</strong> men who<br />
approve of contraceptive use, by household wealth,<br />
2003<br />
100<br />
80<br />
60<br />
40<br />
20<br />
0<br />
Women<br />
Men<br />
Poor Middle Rich<br />
7<br />
The 2008 NDHS did not ask respondents whether they approved of<br />
us<strong>in</strong>g contraceptive methods, so the data from 2003 is the most recent<br />
available.<br />
MLE Research Brief 1-2011 4<br />
www.<strong>urban</strong>reproductivehealth.org


![questionnaire no: [__|__|__|__|__|__|__|__|__] - Measurement ...](https://img.yumpu.com/22729956/1/184x260/questionnaire-no-measurement-.jpg?quality=85)
![questionnaire serial no:[__|__|__|__] - Your Resource for Urban ...](https://img.yumpu.com/10870216/1/184x260/questionnaire-serial-no-your-resource-for-urban-.jpg?quality=85)