Pre-Calculus - Eduware
Pre-Calculus - Eduware
Pre-Calculus - Eduware

You also want an ePaper? Increase the reach of your titles
YUMPU automatically turns print PDFs into web optimized ePapers that Google loves.
VIII. PROBABILITY AND STATISTICS 5. Standard Deviation<br />
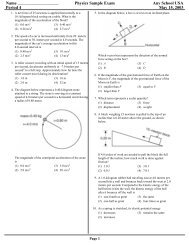
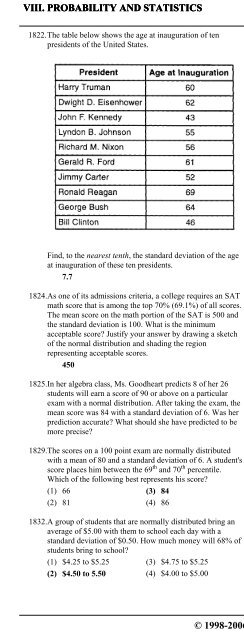
1822. The table below shows the age at inauguration of ten<br />
presidents of the United States.<br />
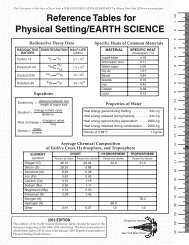
1826. The table below shows the scores on a writing test in an<br />
English class:<br />
Find, to the nearest tenth, the standard deviation of the age<br />
at inauguration of these ten presidents.<br />
7.7<br />
1824. As one of its admissions criteria, a college requires an SAT<br />
math score that is among the top 70% (69.1%) of all scores.<br />
The mean score on the math portion of the SAT is 500 and<br />
the standard deviation is 100. What is the minimum<br />
acceptable score? Justify your answer by drawing a sketch<br />
of the normal distribution and shading the region<br />
representing acceptable scores.<br />
450<br />
1825. In her algebra class, Ms. Goodheart predicts 8 of her 26<br />
students will earn a score of 90 or above on a particular<br />
exam with a normal distribution. After taking the exam, the<br />
mean score was 84 with a standard deviation of 6. Was her<br />
prediction accurate? What should she have predicted to be<br />
more precise?<br />
1829. The scores on a 100 point exam are normally distributed<br />
with a mean of 80 and a standard deviation of 6. A student's<br />
score places him between the 69 th and 70 th percentile.<br />
Which of the following best represents his score?<br />
(1) 66 (3) 84<br />
(2) 81 (4) 86<br />
1832. A group of students that are normally distributed bring an<br />
average of $5.00 with them to school each day with a<br />
standard deviation of $0.50. How much money will 68% of<br />
students bring to school?<br />
(1) $4.25 to $5.25 (3) $4.75 to $5.25<br />
(2) $4.50 to 5.50 (4) $4.00 to $5.00<br />
a Using the accompanying set of data, find both the mean<br />
and the standard deviation to the nearest tenth.<br />
b What is the number of scores that fall within one standard<br />
deviation of the mean?<br />
c Find, to the nearest tenth, the percentage of scores in this<br />
set of data that are within one standard deviation of the<br />
mean?<br />
d What is the number of scores that fall within two standard<br />
deviations of the mean?<br />
e Find the percentage of scores in this set of data that are<br />
within two standard deviations of the mean.<br />
a mean = 79.4 standard deviation = 8.4<br />
b 24 c 66.7% d 34 e 94.4%<br />
1833. On a school exam, Mr. Perez's class had a mean score of 87<br />
and a standard deviation of 11. Mrs. Steck's class had a<br />
mean score of 83 and a standard deviation of 8. In which<br />
class was there greater consistency in the scores? Explain<br />
how you arrived at your answer.<br />
Mrs. Steck's class<br />
Base your answers to questions 1834 and 1835 on the information<br />
below. During school physicals the height of each girl on the<br />
soccer team was taken, in inches, and had the following results:<br />
60, 63, 65, 75, 79, 58, 62, 2, 59, 61, 66<br />
1834. Find, to the nearest tenth, the standard deviation.<br />
6.6 inches<br />
1835. What percent of the girls are between one standard<br />
deviation away from the mean?<br />
72%<br />
1851. The class mean for a math test was 80. The standard<br />
deviation was 8. What percentage of the class scored<br />
between a 76 and 84?<br />
(1) 68.2% (3) 26.4%<br />
(2) 52.8% (4) 38.2%<br />
© 1998-2006 <strong>Eduware</strong>, Inc. 235