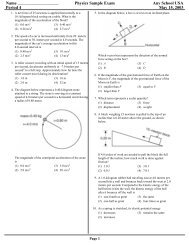
Earth Science Sample Exam Any School USA Period 4 ... - Eduware
Earth Science Sample Exam Any School USA Period 4 ... - Eduware
Earth Science Sample Exam Any School USA Period 4 ... - Eduware

Create successful ePaper yourself
Turn your PDF publications into a flip-book with our unique Google optimized e-Paper software.
Name ___________________ <strong>Earth</strong> <strong>Science</strong> <strong>Sample</strong> <strong>Exam</strong> <strong>Any</strong> <strong>School</strong> <strong>USA</strong><br />
<strong>Period</strong> 4 May 15, 2003<br />
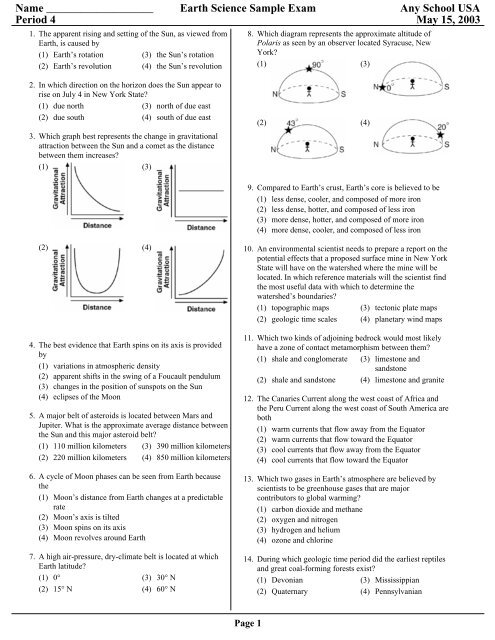
1. The apparent rising and setting of the Sun, as viewed from<br />
<strong>Earth</strong>, is caused by<br />
(1) <strong>Earth</strong>’s rotation (3) the Sun’s rotation<br />
(2) <strong>Earth</strong>’s revolution (4) the Sun’s revolution<br />
8. Which diagram represents the approximate altitude of<br />
Polaris as seen by an observer located Syracuse, New<br />
York<br />
(1) (3)<br />
2. In which direction on the horizon does the Sun appear to<br />
rise on July 4 in New York State<br />
(1) due north (3) north of due east<br />
(2) due south (4) south of due east<br />
3. Which graph best represents the change in gravitational<br />
attraction between the Sun and a comet as the distance<br />
between them increases<br />
(1) (3)<br />
(2) (4)<br />
9. Compared to <strong>Earth</strong>’s crust, <strong>Earth</strong>’s core is believed to be<br />
(1) less dense, cooler, and composed of more iron<br />
(2) less dense, hotter, and composed of less iron<br />
(3) more dense, hotter, and composed of more iron<br />
(4) more dense, cooler, and composed of less iron<br />
(2) (4)<br />
4. The best evidence that <strong>Earth</strong> spins on its axis is provided<br />
by<br />
(1) variations in atmospheric density<br />
(2) apparent shifts in the swing of a Foucault pendulum<br />
(3) changes in the position of sunspots on the Sun<br />
(4) eclipses of the Moon<br />
5. A major belt of asteroids is located between Mars and<br />
Jupiter. What is the approximate average distance between<br />
the Sun and this major asteroid belt<br />
(1) 110 million kilometers (3) 390 million kilometers<br />
(2) 220 million kilometers (4) 850 million kilometers<br />
6. A cycle of Moon phases can be seen from <strong>Earth</strong> because<br />
the<br />
(1) Moon’s distance from <strong>Earth</strong> changes at a predictable<br />
rate<br />
(2) Moon’s axis is tilted<br />
(3) Moon spins on its axis<br />
(4) Moon revolves around <strong>Earth</strong><br />
7. A high air-pressure, dry-climate belt is located at which<br />
<strong>Earth</strong> latitude<br />
(1) 0° (3) 30° N<br />
(2) 15° N (4) 60° N<br />
10. An environmental scientist needs to prepare a report on the<br />
potential effects that a proposed surface mine in New York<br />
State will have on the watershed where the mine will be<br />
located. In which reference materials will the scientist find<br />
the most useful data with which to determine the<br />
watershed’s boundaries<br />
(1) topographic maps (3) tectonic plate maps<br />
(2) geologic time scales (4) planetary wind maps<br />
11. Which two kinds of adjoining bedrock would most likely<br />
have a zone of contact metamorphism between them<br />
(1) shale and conglomerate (3) limestone and<br />
sandstone<br />
(2) shale and sandstone (4) limestone and granite<br />
12. The Canaries Current along the west coast of Africa and<br />
the Peru Current along the west coast of South America are<br />
both<br />
(1) warm currents that flow away from the Equator<br />
(2) warm currents that flow toward the Equator<br />
(3) cool currents that flow away from the Equator<br />
(4) cool currents that flow toward the Equator<br />
13. Which two gases in <strong>Earth</strong>’s atmosphere are believed by<br />
scientists to be greenhouse gases that are major<br />
contributors to global warming<br />
(1) carbon dioxide and methane<br />
(2) oxygen and nitrogen<br />
(3) hydrogen and helium<br />
(4) ozone and chlorine<br />
14. During which geologic time period did the earliest reptiles<br />
and great coal-forming forests exist<br />
(1) Devonian (3) Mississippian<br />
(2) Quaternary (4) Pennsylvanian<br />
Page 1
<strong>Earth</strong> <strong>Science</strong> <strong>Sample</strong> <strong>Exam</strong><br />
15. Which graph best represents the relative periods of rotation of Mercury, Venus, <strong>Earth</strong>, and Mars<br />
(1) (2) (3) (4)<br />
16. Which graph best shows the relationship between the probability of precipitation and the difference between air temperature and<br />
dewpoint<br />
(1) (2) (3) (4)<br />
17. The average temperature at <strong>Earth</strong>’s North Pole is colder<br />
than the average temperature at the Equator because the<br />
Equator<br />
(1) receives less ultraviolet radiation<br />
(2) receives more intense insolation<br />
(3) has more cloud cover<br />
(4) has a thicker atmosphere<br />
18. On a certain day, the isobars on a weather map are very<br />
close together over eastern New York State. To make the<br />
people of this area aware of possible risk to life and<br />
property in this situation, the National Weather Service<br />
should issue<br />
(1) a dense-fog warning (3) a heat-index warning<br />
(2) a high-wind advisory (4) an air-pollution<br />
advisory<br />
19. What is the dewpoint temperature when thedry-bulb<br />
temperature is 16°C and the wet-bulb temperature is 11°C<br />
(1) 5°C (3) 9°C<br />
(2) 7°C (4) –17°C<br />
20. During which phase change of water is the most energy<br />
released into the environment<br />
(1) water freezing (3) water evaporating<br />
(2) ice melting (4) water vapor<br />
condensing<br />
21. A strong west wind steadily blew over Lake Ontario<br />
picking up moisture. As this moist air flowed over the Tug<br />
Hill Plateau, the plateau received a 36-inch snowfall. This<br />
snow fell from clouds that formed when rising air was<br />
(1) cooled by expansion, causing water vapor to condense<br />
(2) cooled by compression, causing water vapor to<br />
condense<br />
(3) warmed by expansion, causing water vapor to<br />
evaporate<br />
(4) warmed by compression, causing water vapor to<br />
evaporate<br />
22. During a rainfall, surface runoff will probably be greatest<br />
in an area that has a<br />
(1) steep slope and a clay-covered surface<br />
(2) steep slope and a gravel-covered surface<br />
(3) gentle slope and a grass-covered surface<br />
(4) gentle slope and a tree-covered surface<br />
23. <strong>Earth</strong>’s troposphere, hydrosphere, and lithosphere contain<br />
relatively large amounts of which element<br />
(1) iron (3) hydrogen<br />
(2) oxygen (4) potassium<br />
24. Which river is a tributary branch of the Hudson River<br />
(1) Delaware River (3) Mohawk River<br />
(2) Susquehanna River (4) Genesee River<br />
Page 2
25. In the diagram below, the spectral lines of hydrogen gas<br />
from three galaxies, A, B, and C, are compared to the<br />
spectral lines of hydrogen gas observed in a laboratory.<br />
<strong>Earth</strong> <strong>Science</strong> <strong>Sample</strong> <strong>Exam</strong><br />
31. The map below shows a meandering river. A–A' is the<br />
location of a cross section. The arrows show the direction<br />
of the riverflow.<br />
What is the best inference that can be made concerning the<br />
movement of galaxies A, B, and C<br />
(1) Galaxy A is moving away from <strong>Earth</strong>, but galaxies B<br />
and C are moving toward <strong>Earth</strong>.<br />
(2) Galaxy B is moving away from <strong>Earth</strong>, but galaxies A<br />
and C are moving toward <strong>Earth</strong>.<br />
(3) Galaxies A, B, and C are all moving toward <strong>Earth</strong>.<br />
(4) Galaxies A, B, and C are all moving away from <strong>Earth</strong>.<br />
26. The long, sandy islands along the south shore of Long<br />
Island are composed mostly of sand and rounded pebbles<br />
arranged in sorted layers. The agent of erosion that most<br />
likely shaped and sorted the sand and pebbles while<br />
transporting them to their island location was<br />
(1) glaciers (3) wind<br />
(2) landslides (4) ocean waves<br />
27. What are the largest particles that a stream can transport<br />
when its velocity is 200 centimeters per second<br />
(1) silt (3) pebbles<br />
(2) sand (4) cobbles<br />
28. Which common rock is formed from the solidification of<br />
molten material<br />
(1) rock gypsum (3) rhyolite<br />
(2) slate (4) coal<br />
29. Rocks can be classified as sedimentary, igneous, or<br />
metamorphic based primarily upon differences in their<br />
(1) color (3) origin<br />
(2) density (4) age<br />
Which cross section best represents the shape of the river<br />
bottom at A–A'<br />
(1) (3)<br />
(2) (4)<br />
32. The diagram below shows how a sample of the mineral<br />
mica breaks when hit with a rock hammer.<br />
This mineral breaks in smooth, flat surfaces because it<br />
(1) is very hard<br />
(2) is very dense<br />
(3) contains large amounts of iron<br />
(4) has a regular arrangement of atoms<br />
30. Buffalo, New York, and Plattsburgh, New York, are both<br />
located in landscape regions called<br />
(1) mountains (3) plateaus<br />
(2) highlands (4) lowlands<br />
Page 3
<strong>Earth</strong> <strong>Science</strong> <strong>Sample</strong> <strong>Exam</strong><br />
33. The cross section below illustrates the general sorting of sediment by a river as it flows from a mountain to a plain.<br />
Which factor most likely caused the sediment to be sorted in the pattern shown<br />
(1) velocity of the river water (3) mineral composition of the sediment<br />
(2) hardness of the surface bedrock (4) temperature of the water<br />
34. The map below shows the location of four cities, A, B, C,<br />
and D, in the western United States where prevailing winds<br />
are from the southwest.<br />
Base your answers to questions 36 and 37 on the map below of<br />
Iceland, a country located on the Mid-Atlantic Ridge. Four<br />
locations are represented by the letters A through D.<br />
Which city most likely receives the least amount of<br />
average yearly precipitation<br />
(1) A (3) C<br />
(2) B (4) D<br />
35. A student incorrectly measured the volume of a mineral<br />
sample as 63 cubic centimeters. The actual volume was 72<br />
cubic centimeters. What was the student’s approximate<br />
percent deviation (percentage of error)<br />
(1) 9.0% (3) 14.2%<br />
(2) 12.5% (4) 15.3%<br />
36. The fine-grained texture of most of the igneous rock<br />
formed on the surface of Iceland is due to<br />
(1) rapid cooling of the molten rock<br />
(2) high density of the molten rock<br />
(3) numerous faults in the island’s bedrock<br />
(4) high pressure under the island<br />
37. The youngest bedrock is most likely found at which<br />
location<br />
(1) A (3) C<br />
(2) B (4) D<br />
Page 4
<strong>Earth</strong> <strong>Science</strong> <strong>Sample</strong> <strong>Exam</strong><br />
38. The diagrams below show the relative sizes of particles from soil samples A, B, and C. Equal volumes of each soil sample were placed in<br />
separate containers. Each container has a screen at the bottom. Water was poured through each sample to determine the infiltration rate.<br />
Which graph best shows how the infiltration rates of the three soil samples would compare<br />
(1) (2) (3) (4)<br />
Base your answers to questions 39 through 41 on the diagram below, which represents the position of the Sun with respect to <strong>Earth</strong>’s surface at<br />
solar noon on certain dates. The latitudes of six locations on the same line of longitude are shown. The observer is located at 42° N in New<br />
York State. The date for the Sun at position A has been deliberately left blank.<br />
39. At which New York State location could the observer be located<br />
(1) Plattsburgh (2) Mount Marcy (3) New York City (4) Slide Mountain<br />
40. When the Sun is at position A, which latitude receives the most direct rays of the Sun<br />
(1) Tropic of Cancer (23.5° N) (3) Equator (0°)<br />
(2) Tropic of Capricorn (23.5° S) (4) Antarctic Circle (66.5° S)<br />
Page 5
<strong>Earth</strong> <strong>Science</strong> <strong>Sample</strong> <strong>Exam</strong><br />
41. When the Sun is at the March 21 position, New York State will usually have<br />
(1) longer days than nights (3) the lowest annual altitude of the Sun at solar noon<br />
(2) 12 hours of daylight and 12 hours of darkness (4) the highest annual altitude of the Sun at solar noon<br />
Base your answers to questions 42 and 43 on the graph below. The graph shows air temperature and relative humidity at a single location<br />
during a 24-hour period.<br />
42. What was the approximate change in relative humidity from 12 noon to 4 p.m.<br />
(1) 10% (2) 15% (3) 20% (4) 30%<br />
43. At which time would the rate of evaporation most likely be greatest<br />
(1) 11 p.m. (2) 6 a.m. (3) 10 a.m. (4) 4 p.m.<br />
Page 6
<strong>Earth</strong> <strong>Science</strong> <strong>Sample</strong> <strong>Exam</strong><br />
Base your answers to questions 44 through 47 on the diagram and map below. The diagram shows three seismograms of the same earthquake<br />
recorded at three different seismic stations, X, Y, and Z. The distances from each seismic station to the earthquake epicenter have been drawn<br />
on the map. A coordinate system has been placed on the map to describe locations. The map scale has not been included.<br />
44. Approximately how far away from station Y is the epicenter<br />
(1) 1,300 km (2) 2,600 km (3) 3,900 km (4) 5,200 km<br />
45. The S-waves from this earthquake that travel toward <strong>Earth</strong>’s center will<br />
(1) be deflected by <strong>Earth</strong>’s magnetic field<br />
(2) be totally reflected off the crust-mantle interface<br />
(3) be absorbed by the liquid outer core<br />
(4) reach the other side of <strong>Earth</strong> faster than those that travel around <strong>Earth</strong> in the crust<br />
Page 7
<strong>Earth</strong> <strong>Science</strong> <strong>Sample</strong> <strong>Exam</strong><br />
46. Seismic station Z is 1,700 kilometers from the epicenter. Approximately how long did it take the P-wave to travel to station Z<br />
(1) 1 min 50 sec (2) 2 min 50 sec (3) 3 min 30 sec (4) 6 min 30 sec<br />
47. On the map, which location is closest to the epicenter of the earthquake<br />
(1) E–5 (2) G–1 (3) H–3 (4) H–8<br />
Base your answers to questions 48 through 50 on the diagram below. The diagram shows a model of the relationship between <strong>Earth</strong>’s surface<br />
and its interior.<br />
48. Mid-ocean ridges (rifts) normally form where tectonic plates are<br />
(1) converging (2) diverging (3) stationary (4) sliding past each other<br />
49. The motion of the convection currents in the mantle beneath the Atlantic Ocean appears to be mainly making this ocean basin<br />
(1) deeper (2) shallower (3) wider (4) narrower<br />
50. According to the diagram, the deep trench along the west coast of South America is caused by movement of the oceanic crust that is<br />
(1) sinking beneath the continental crust (3) sinking at the Mid-Atlantic ridge<br />
(2) uplifting over the continental crust (4) colliding with the Atlantic oceanic crust<br />
Page 8
<strong>Earth</strong> <strong>Science</strong> <strong>Sample</strong> <strong>Exam</strong><br />
Base your answers to questions 51 and 52 on the topographic map of an island shown below. Elevations are expressed in feet. Points A, B, C,<br />
and D are locations on the island. A triangulation point shows the highest elevation on the island.<br />
51. On the grid provided above, construct a topographic profile representing the cross-sectional view between point A and point B, following<br />
the directions below.<br />
a Plot the elevation of the land along line AB by marking, with a dot, the elevation of each point where a contour line is crossed by line<br />
AB.<br />
b Connect the dots with a smooth, curved line to complete the topographic profile.<br />
Page 9
<strong>Earth</strong> <strong>Science</strong> <strong>Sample</strong> <strong>Exam</strong><br />
52. What is the average gradient, in feet per mile, along the straight line from point C to point D ________ft/mi<br />
53. The photograph below shows an impact crater approximately 1 mile wide located in Diablo Canyon, Arizona. Describe the event that<br />
produced this crater.<br />
54. A weather station records the following data:<br />
Air pressure is 1,001.0 millibars.<br />
Wind is from the south.<br />
Wind speed is 25 knots.<br />
Using the proper weather map symbols, place this<br />
information in the correct locations on the weather station<br />
model provided above.<br />
Page 10
<strong>Earth</strong> <strong>Science</strong> <strong>Sample</strong> <strong>Exam</strong><br />
55. On the United States time zone map provided below, indicate the standard time in each time zone when it is 9 a.m. in the Central Time<br />
Zone. The dashed lines represent the standard-time meridians for each time zone. Be sure to indicate the time for all three zones.<br />
56. The weather map below shows a typical midlatitude low-pressure system centered in Illinois.<br />
a On the weather map provided above, indicate which boxed area has the highest surface air temperatures by marking an X in one of the four<br />
boxes on the map.<br />
b On the weather map provided above, draw an arrow to predict the normal storm track that this low-pressure center would be expected to<br />
follow.<br />
Page 11
<strong>Earth</strong> <strong>Science</strong> <strong>Sample</strong> <strong>Exam</strong><br />
Base your answers to questions 57 through 59 on the flowchart below, which shows a sequence of geologic processes at or near <strong>Earth</strong>’s<br />
surface. Box A has been deliberately left blank. The diagrams are not drawn to scale.<br />
57. Identify the three minerals that are normally found with quartz in samples of andesite rock.<br />
58. State one geologic process represented by box A.<br />
59. Identify by name one type of rock layer, other than sandstone, shown in the outcrop.<br />
Page 12
<strong>Earth</strong> <strong>Science</strong> <strong>Sample</strong> <strong>Exam</strong><br />
60. A family wants to use rock materials as flooring in the entrance of their new house. They have narrowed their choice to granite or<br />
marble. Which of these rocks is more resistant to the physical wear of foot traffic and explain why this rock is more resistant.<br />
Base your answers to questions 61 and 62 on the newspaper article below<br />
Ancient Human Footprints Found<br />
PARIS — In the darkness of an underground cave lined with prehistoric paintings, French scientists believe they have<br />
discovered the oldest footprints of humans in Europe.<br />
Embedded in damp clay, the imprints, slightly more than 8 inches long, appear to be those of a boy, 8 or 10 years old,<br />
who was walking barefoot between 25,000 and 30,000 years ago, prehistorians said Wednesday.<br />
They said the dates are only hypothetical because there is no precise way to determine when the markings were made.<br />
But Michel-Andre Garcia, one prehistorian who has studied the site, said that the carbon datings in the cave and the<br />
context make this “a very strong hypothesis.” The four footprints were found in the Ardeche region of southern France,<br />
deep inside the Chauvet cave.<br />
— Times Union, June 10, 1999<br />
61. Scientists have inferred that these “oldest” European human footprints were made during which geologic epoch<br />
62. Which characteristic of the radioactive isotope carbon-14 explains why carbon-14, rather than the radioactive isotope uranium-238, was<br />
used by archeologists in dating the age of their findings<br />
Base your answers to questions 63 through 66 on the diagram below, which represents an exaggerated model of <strong>Earth</strong>’s orbital shape. <strong>Earth</strong> is<br />
closest to the Sun at one time of year (perihelion) and farthest from the Sun at another time of year (aphelion).<br />
63. State the actual geometric shape of <strong>Earth</strong>’s orbit.<br />
64. Identify the season in the Northern Hemisphere when <strong>Earth</strong> is at perihelion.<br />
65. Describe the change that takes place in the apparent size of the Sun, as viewed from <strong>Earth</strong>, as <strong>Earth</strong> moves from perihelion to aphelion.<br />
66. State the relationship between <strong>Earth</strong>’s distance from the Sun and <strong>Earth</strong>’s orbital velocity.<br />
Page 13
<strong>Earth</strong> <strong>Science</strong> <strong>Sample</strong> <strong>Exam</strong><br />
67. Base your answer to the following question on the cross section provided below, which represents a house at an ocean shoreline at night.<br />
Smoke from the chimney is blowing out to sea.<br />
a Label the two lines provided on the cross section above to show where air pressure is relatively “high” and where it is relatively “low.”<br />
b Assume that the wind blowing out to sea on this night is caused by local air-temperature conditions. Label the two lines provided on the cross<br />
section above to show where <strong>Earth</strong>’s surface air temperature is relatively “warm” and where it is relatively “cool.”<br />
Page 14
<strong>Earth</strong> <strong>Science</strong> <strong>Sample</strong> <strong>Exam</strong><br />
Base your answers to questions 68 through 70 on data tables I and II and on the Hurricane Tracking Map below. Table I represents the storm<br />
track data for an Atlantic hurricane. Location, wind velocity, air pressure, and storm strength are shown for the storm’s center at 3 p.m.<br />
Greenwich time each day. Table II shows a scale of relative storm strength. The map shows the hurricane’s path.<br />
68. Describe two characteristics of the circulation pattern of the surface winds around the center (eye) of a Northern Hemisphere low-pressure<br />
hurricane.<br />
69. The hurricane did not continue moving toward the same compass direction during the entire period shown by the data table. Explain why<br />
the hurricane changed direction.<br />
Page 15
<strong>Earth</strong> <strong>Science</strong> <strong>Sample</strong> <strong>Exam</strong><br />
70. Calculate the average daily rate of movement of the hurricane during the period from 3 p.m. August 24 to 3 p.m. August 28. The hurricane<br />
traveled 2,600 kilometers during this 4-day period. Follow the directions given below.<br />
a Write the equation used to determine the rate of change.<br />
b Substitute data into the equation.<br />
c Calculate the rate and label it with the proper units.<br />
Base your answers to questions 71 through 73 on the cross section provided in your answer booklet. The cross section represents a portion of<br />
<strong>Earth</strong>’s crust. Letters A, B, C, and D are rock units.<br />
71. Igneous rock B was formed after rock layer D was deposited but before rock layer A was deposited. Using the contact metamorphism<br />
symbol shown in the key, draw that symbol in the proper locations on the cross section provided above to indicate those rocks that<br />
underwent contact metamorphism when igneous rock B was molten.<br />
72. In relation to rock units A and B in the cross section, when was igneous rock C formed<br />
73. Describe one observable characteristic of rock A that indicates that rock A is sedimentary.<br />
74. The diagram provided below represents the Sun and <strong>Earth</strong> as viewed from space on a certain date.<br />
a Using a symbol for the Moon of approximately the size of a dime, draw the position of the Moon on the diagram provided above at the<br />
time when the fullMoon phase is observed from <strong>Earth</strong>.<br />
b Draw an arrow on the diagram provided above that shows the <strong>Earth</strong> motion that causes surface ocean currents and surface winds to<br />
curve (Coriolis effect).<br />
Page 16
Name ___________________ <strong>Earth</strong> <strong>Science</strong> <strong>Sample</strong> <strong>Exam</strong> <strong>Any</strong> <strong>School</strong> <strong>USA</strong><br />
<strong>Period</strong> 4 May 15, 2003<br />
1. _________ 1<br />
2. _________ 3<br />
3. _________ 1<br />
4. _________ 2<br />
5. _________ 3<br />
6. _________ 4<br />
7. _________ 3<br />
8. _________ 2<br />
9. _________ 3<br />
10. _________ 1<br />
11. _________ 4<br />
12. _________ 4<br />
13. _________ 1<br />
14. _________ 4<br />
15. _________ 1<br />
16. _________ 3<br />
17. _________ 2<br />
18. _________ 2<br />
19. _________ 2<br />
20. _________ 4<br />
21. _________ 1<br />
22. _________ 1<br />
Answer Key<br />
31. _________ 3<br />
32. _________ 4<br />
33. _________ 1<br />
34. _________ 1<br />
35. _________ 2<br />
36. _________ 1<br />
37. _________ 3<br />
38. _________ 1<br />
39. _________ 4<br />
40. _________ 2<br />
41. _________ 2<br />
42. _________ 2<br />
43. _________ 4<br />
44. _________ 2<br />
45. _________ 3<br />
46. _________ 3<br />
47. _________ 3<br />
48. _________ 2<br />
49. _________ 3<br />
50. _________ 1<br />
51.<br />
23. _________ 2<br />
24. _________ 3<br />
25. _________ 4<br />
26. _________ 4<br />
27. _________ 4<br />
28. _________ 3<br />
29. _________ 3<br />
52. 25 ft/mi (±1).<br />
53. example: Barringer Crater was caused by the impact of a meteorite<br />
(or meteor or comet or asteroid).<br />
54.<br />
30. _________ 4
Name ___________________ <strong>Earth</strong> <strong>Science</strong> <strong>Sample</strong> <strong>Exam</strong> <strong>Any</strong> <strong>School</strong> <strong>USA</strong><br />
<strong>Period</strong> 4 May 15, 2003<br />
Answer Key<br />
55.<br />
68. counterclockwise and spirals toward the eye<br />
69. examples: – The storm entered the prevailing southwesterly wind<br />
belt north of 30° N, which pushed it to the northeast. – The<br />
hurricane moved into a different wind belt.<br />
70.<br />
56.<br />
71.<br />
57. plagioclase feldspar, biotite, and amphibole.<br />
58. examples: – weathering – erosion – deposition<br />
59. siltstone or conglomerate or limestone.<br />
60. Granite because granite is composed mainly of quartz and feldspar<br />
that are resistant to abrasion because of their hardness (7 and 6,<br />
respectively), while marble is made of calcite, which is softer<br />
(hardness of 3).<br />
61. Pleistocene epoch.<br />
72. examples: – C was formed before both B and A. – C is older than<br />
both B and A.<br />
73. examples: – Rock A is a mixture of rounded rock fragments of<br />
different sizes connected together. – Rock A is a horizontal layer.<br />
74.<br />
62. examples: – The half-life of radioactive carbon is shorter. –<br />
Radioactive carbon-14 is found in recent organic remains.<br />
63. examples: ellipse – oval – elliptical with the Sun at one focus<br />
64. examples: early winter – winter<br />
65. examples: – As <strong>Earth</strong> moves from perihelion to aphelion, the<br />
apparent size decreases. – The Sun appears smaller.<br />
66. examples: – As <strong>Earth</strong> moves from perihelion to aphelion, the orbital<br />
velocity decreases. – As distance of <strong>Earth</strong> from the Sun increases,<br />
orbital velocity decreases. – an inverse relationship<br />
67.
Category Print<br />
24: 1: I. PROLOGUE\2. Simple Measurements\A. Measurements\3. Error - (35)<br />
3: II. DESCRIBING THE EARTH\2. Positions on <strong>Earth</strong>\A. Position Determination\1. Coordinate systems - (8, 39, 40)<br />
1: II. DESCRIBING THE EARTH\1. <strong>Earth</strong> Dimensions\C. Atmosphere, Hydrosphere, Lithosphere\1. Atmosphere - (23)<br />
1: III. ASTRONOMY\1. Celestial Observations\A. Motion of Objects in Sky\3. <strong>Earth</strong>'s moon - (6)<br />
1: III. ASTRONOMY\4. Our Solar System\B. The Nature of Orbits\2. Gravity and energy transformations - (3)<br />
1: III. ASTRONOMY\4. Our Solar System\C. Solar System Astronomy\2. Comets, Meteors and Asteroids - (5)<br />
1: III. ASTRONOMY\4. Our Solar System\C. Solar System Astronomy\1. Planets - (15)<br />
1: III. ASTRONOMY\2. Terrestrial Observations\A. Motion at the <strong>Earth</strong>'s Surface\1. Foucault pendulum - (4)<br />
1: III. ASTRONOMY\5. Modern Astronomy\A. Deep Space Astronomy\2. Doppler Effect - (25)<br />
2: III. ASTRONOMY\1. Celestial Observations\A. Motion of Objects in Sky\4. Sun and the Seasons - (2, 41)<br />
1: III. ASTRONOMY\3. Time\A. Frames of Reference for Time\1. <strong>Earth</strong> motions - (1)<br />
1: IV. ENERGY IN EARTH PROCESSES\3. Insolation at the <strong>Earth</strong>'s Surface\A. Insolation Factors\1. Angle - (17)<br />
1: IV. ENERGY IN EARTH PROCESSES\4. Terrestrial Radiation\A. Radiation Factors\2. Greenhouse Effect - (13)<br />
1: IV. ENERGY IN EARTH PROCESSES\2. Energy Transformation\A. Transformation in <strong>Earth</strong>'s Processes\1. Latent/Specific Heat<br />
(qualitative) - (20)<br />
2: IX. THE FORMATION OF ROCKS\3. Rock Formation\B. Non-sedimentary Rocks\1. Solidification process - (28, 37)<br />
1: IX. THE FORMATION OF ROCKS\3. Rock Formation\C. Environment of Formation\1. Inferred characteristics - (29)<br />
1: IX. THE FORMATION OF ROCKS\2. Minerals\B. Characteristics\3. Structure - (32)<br />
1: IX. THE FORMATION OF ROCKS\4. Rock Cycle\A. Evidence\1. Transition zones - (11)<br />
1: IX. THE FORMATION OF ROCKS\3. Rock Formation\B. Non-sedimentary Rocks\2. Recrystallization process - (36)<br />
2: V. WEATHER AND THE ATMOSPHERE\3. Atmospheric Energy Exchanges\A. Input of Moisture & Energy\3. Relative humidity/Dew<br />
point - (16, 19)<br />
1: V. WEATHER AND THE ATMOSPHERE\1. Atmospheric Variables\A. Local Atmospheric Variables\5. Air movement - (18)<br />
1: V. WEATHER AND THE ATMOSPHERE\4. Climate Pattern Factors\A. Factors\5. Wind belts - (7)<br />
2: V. WEATHER AND THE ATMOSPHERE\4. Climate Pattern Factors\A. Factors\4. Mountain barriers - (21, 34)<br />
1: V. WEATHER AND THE ATMOSPHERE\1. Atmospheric Variables\A. Local Atmospheric Variables\4. Moisture variations - (42)<br />
1: V. WEATHER AND THE ATMOSPHERE\3. Atmospheric Energy Exchanges\A. Input of Moisture & Energy\1. Evaporation and<br />
transpiration - (43)<br />
1: V. WEATHER AND THE ATMOSPHERE\4. Climate Pattern Factors\A. Factors\3. Large Bodies Water / Ocean Current - (12)<br />
1: VI. GROUND WATER\1. <strong>Earth</strong>'s Water\A. Ground Water\1. Infiltration - (38)<br />
1: VI. GROUND WATER\1. <strong>Earth</strong>'s Water\B. Surface Water\1. Runoff - (22)<br />
1: VII. THE EROSIONAL PROCESS\2. Erosion\B. Factors affecting Transportation\1. Gravity - (31)<br />
1: VII. THE EROSIONAL PROCESS\2. Erosion\C. Coastal Processes\1. Coastal Processes - (26)<br />
1: VII. THE EROSIONAL PROCESS\2. Erosion\B. Factors affecting Transportation\2. Water Erosion - (27)<br />
1: VIII. THE DEPOSITIONAL PROCESS\1. Deposition\A. Factors\4. Velocity - (33)<br />
1: VIII. THE DEPOSITIONAL PROCESS\3. Landscape Characteristics\A. Quantitative Observations\2. Stream patterns - (24)<br />
1: VIII. THE DEPOSITIONAL PROCESS\4. Landscape Development\A. Environmental Factors\6. Man - (10)<br />
1: VIII. THE DEPOSITIONAL PROCESS\3. Landscape Characteristics\B. Relationship of Characteristics\1. Landscape regions - (30)<br />
2: X. THE DYNAMIC CRUST\2. <strong>Earth</strong>quakes\B. Location of Epicenter\1. Epicenter - (44, 47)<br />
1: X. THE DYNAMIC CRUST\2. <strong>Earth</strong>quakes\A. Wave Properties\3. Transmission - (45)<br />
1: X. THE DYNAMIC CRUST\2. <strong>Earth</strong>quakes\A. Wave Properties\2. Velocities - (46)<br />
1: X. THE DYNAMIC CRUST\1. Evidence of Crustal Movement\B. Major Crustal Changes\4. Ocean floor spreading - (48)<br />
2: X. THE DYNAMIC CRUST\4. Theories of Crustal Change\A. Inferred Processes\1. Mantle convection cells - (49, 50)<br />
1: X. THE DYNAMIC CRUST\3. <strong>Earth</strong>'s Crust and Interior\A. Properties\4. Density, Temperature, & Pressure - (9)<br />
1: XI. INTERPRETING GEOLOGICAL HISTORY\3. Determining Geologic Ages\A. Rock Record\2. Scale of geologic time - (14)
<strong>Earth</strong> <strong>Science</strong> <strong>Sample</strong> <strong>Exam</strong><br />
Name ________________________________ Class __________________________ Date ___________<br />
1. ___________<br />
2. ___________<br />
3. ___________<br />
4. ___________<br />
5. ___________<br />
6. ___________<br />
7. ___________<br />
8. ___________<br />
9. ___________<br />
10. ___________<br />
11. ___________<br />
12. ___________<br />
13. ___________<br />
14. ___________<br />
15. ___________<br />
16. ___________<br />
17. ___________<br />
18. ___________<br />
19. ___________<br />
20. ___________<br />
21. ___________<br />
22. ___________<br />
23. ___________<br />
24. ___________<br />
25. ___________<br />
26. ___________<br />
27. ___________<br />
28. ___________<br />
29. ___________<br />
30. ___________<br />
31. ___________<br />
32. ___________<br />
33. ___________<br />
34. ___________<br />
35. ___________<br />
36. ___________<br />
37. ___________<br />
38. ___________<br />
39. ___________<br />
40. ___________<br />
41. ___________<br />
42. ___________<br />
43. ___________<br />
44. ___________<br />
45. ___________<br />
46. ___________<br />
47. ___________<br />
48. ___________<br />
49. ___________<br />
50. ___________<br />
51.<br />
52.<br />
53.<br />
54.<br />
55.<br />
56.<br />
57.<br />
58.
<strong>Earth</strong> <strong>Science</strong> <strong>Sample</strong> <strong>Exam</strong><br />
Name ________________________________ Class __________________________ Date ___________<br />
59.<br />
60.<br />
61.<br />
62.<br />
63.<br />
64.<br />
65.<br />
66.<br />
67.<br />
68.<br />
69.<br />
70.<br />
71.<br />
72.<br />
73.<br />
74.