Earth Science Sample Exam Any School USA Period 4 ... - Eduware
Earth Science Sample Exam Any School USA Period 4 ... - Eduware
Earth Science Sample Exam Any School USA Period 4 ... - Eduware

You also want an ePaper? Increase the reach of your titles
YUMPU automatically turns print PDFs into web optimized ePapers that Google loves.
<strong>Earth</strong> <strong>Science</strong> <strong>Sample</strong> <strong>Exam</strong><br />
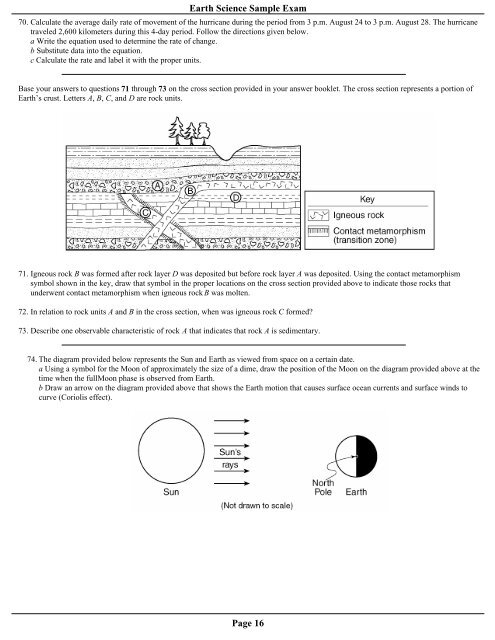
70. Calculate the average daily rate of movement of the hurricane during the period from 3 p.m. August 24 to 3 p.m. August 28. The hurricane<br />
traveled 2,600 kilometers during this 4-day period. Follow the directions given below.<br />
a Write the equation used to determine the rate of change.<br />
b Substitute data into the equation.<br />
c Calculate the rate and label it with the proper units.<br />
Base your answers to questions 71 through 73 on the cross section provided in your answer booklet. The cross section represents a portion of<br />
<strong>Earth</strong>’s crust. Letters A, B, C, and D are rock units.<br />
71. Igneous rock B was formed after rock layer D was deposited but before rock layer A was deposited. Using the contact metamorphism<br />
symbol shown in the key, draw that symbol in the proper locations on the cross section provided above to indicate those rocks that<br />
underwent contact metamorphism when igneous rock B was molten.<br />
72. In relation to rock units A and B in the cross section, when was igneous rock C formed<br />
73. Describe one observable characteristic of rock A that indicates that rock A is sedimentary.<br />
74. The diagram provided below represents the Sun and <strong>Earth</strong> as viewed from space on a certain date.<br />
a Using a symbol for the Moon of approximately the size of a dime, draw the position of the Moon on the diagram provided above at the<br />
time when the fullMoon phase is observed from <strong>Earth</strong>.<br />
b Draw an arrow on the diagram provided above that shows the <strong>Earth</strong> motion that causes surface ocean currents and surface winds to<br />
curve (Coriolis effect).<br />
Page 16