Earth Science Sample Exam Any School USA Period 4 ... - Eduware
Earth Science Sample Exam Any School USA Period 4 ... - Eduware
Earth Science Sample Exam Any School USA Period 4 ... - Eduware

You also want an ePaper? Increase the reach of your titles
YUMPU automatically turns print PDFs into web optimized ePapers that Google loves.
<strong>Earth</strong> <strong>Science</strong> <strong>Sample</strong> <strong>Exam</strong><br />
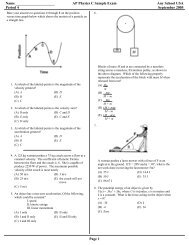
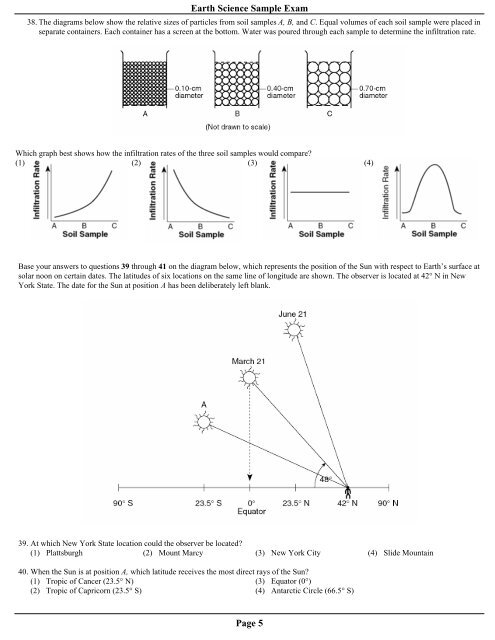
38. The diagrams below show the relative sizes of particles from soil samples A, B, and C. Equal volumes of each soil sample were placed in<br />
separate containers. Each container has a screen at the bottom. Water was poured through each sample to determine the infiltration rate.<br />
Which graph best shows how the infiltration rates of the three soil samples would compare<br />
(1) (2) (3) (4)<br />
Base your answers to questions 39 through 41 on the diagram below, which represents the position of the Sun with respect to <strong>Earth</strong>’s surface at<br />
solar noon on certain dates. The latitudes of six locations on the same line of longitude are shown. The observer is located at 42° N in New<br />
York State. The date for the Sun at position A has been deliberately left blank.<br />
39. At which New York State location could the observer be located<br />
(1) Plattsburgh (2) Mount Marcy (3) New York City (4) Slide Mountain<br />
40. When the Sun is at position A, which latitude receives the most direct rays of the Sun<br />
(1) Tropic of Cancer (23.5° N) (3) Equator (0°)<br />
(2) Tropic of Capricorn (23.5° S) (4) Antarctic Circle (66.5° S)<br />
Page 5