The relationship between employees' perceptions of safety and ...
The relationship between employees' perceptions of safety and ...
The relationship between employees' perceptions of safety and ...

You also want an ePaper? Increase the reach of your titles
YUMPU automatically turns print PDFs into web optimized ePapers that Google loves.
240<br />
M. O’Toole / Journal <strong>of</strong> Safety Research 33 (2002) 231–243<br />
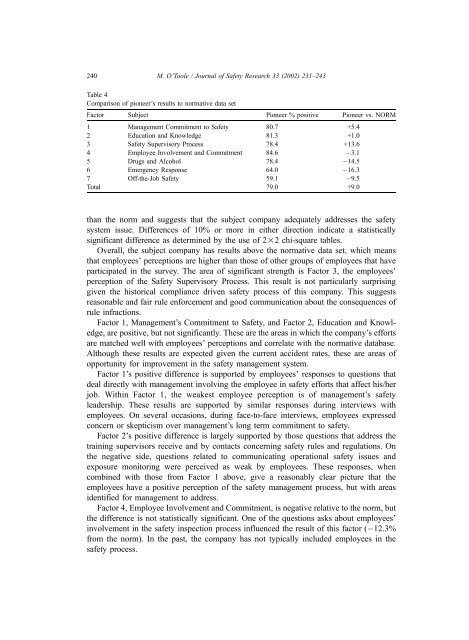
Table 4<br />
Comparison <strong>of</strong> pioneer’s results to normative data set<br />
Factor Subject Pioneer % positive Pioneer vs. NORM<br />
1 Management Commitment to Safety 80.7 +5.4<br />
2 Education <strong>and</strong> Knowledge 81.3 +1.0<br />
3 Safety Supervisory Process 78.4 +13.6<br />
4 Employee Involvement <strong>and</strong> Commitment 84.6 3.1<br />
5 Drugs <strong>and</strong> Alcohol 78.4 14.5<br />
6 Emergency Response 64.0 16.3<br />
7 Off-the-Job Safety 59.1 9.5<br />
Total 79.0 +9.0<br />
than the norm <strong>and</strong> suggests that the subject company adequately addresses the <strong>safety</strong><br />
system issue. Differences <strong>of</strong> 10% or more in either direction indicate a statistically<br />
significant difference as determined by the use <strong>of</strong> 22 chi-square tables.<br />
Overall, the subject company has results above the normative data set, which means<br />
that employees’ <strong>perceptions</strong> are higher than those <strong>of</strong> other groups <strong>of</strong> employees that have<br />
participated in the survey. <strong>The</strong> area <strong>of</strong> significant strength is Factor 3, the employees’<br />
perception <strong>of</strong> the Safety Supervisory Process. This result is not particularly surprising<br />
given the historical compliance driven <strong>safety</strong> process <strong>of</strong> this company. This suggests<br />
reasonable <strong>and</strong> fair rule enforcement <strong>and</strong> good communication about the consequences <strong>of</strong><br />
rule infractions.<br />
Factor 1, Management’s Commitment to Safety, <strong>and</strong> Factor 2, Education <strong>and</strong> Knowledge,<br />
are positive, but not significantly. <strong>The</strong>se are the areas in which the company’s efforts<br />
are matched well with employees’ <strong>perceptions</strong> <strong>and</strong> correlate with the normative database.<br />
Although these results are expected given the current accident rates, these are areas <strong>of</strong><br />
opportunity for improvement in the <strong>safety</strong> management system.<br />
Factor 1’s positive difference is supported by employees’ responses to questions that<br />
deal directly with management involving the employee in <strong>safety</strong> efforts that affect his/her<br />
job. Within Factor 1, the weakest employee perception is <strong>of</strong> management’s <strong>safety</strong><br />
leadership. <strong>The</strong>se results are supported by similar responses during interviews with<br />
employees. On several occasions, during face-to-face interviews, employees expressed<br />
concern or skepticism over management’s long term commitment to <strong>safety</strong>.<br />
Factor 2’s positive difference is largely supported by those questions that address the<br />
training supervisors receive <strong>and</strong> by contacts concerning <strong>safety</strong> rules <strong>and</strong> regulations. On<br />
the negative side, questions related to communicating operational <strong>safety</strong> issues <strong>and</strong><br />
exposure monitoring were perceived as weak by employees. <strong>The</strong>se responses, when<br />
combined with those from Factor 1 above, give a reasonably clear picture that the<br />
employees have a positive perception <strong>of</strong> the <strong>safety</strong> management process, but with areas<br />
identified for management to address.<br />
Factor 4, Employee Involvement <strong>and</strong> Commitment, is negative relative to the norm, but<br />
the difference is not statistically significant. One <strong>of</strong> the questions asks about employees’<br />
involvement in the <strong>safety</strong> inspection process influenced the result <strong>of</strong> this factor ( 12.3%<br />
from the norm). In the past, the company has not typically included employees in the<br />
<strong>safety</strong> process.