The relationship between employees' perceptions of safety and ...
The relationship between employees' perceptions of safety and ...
The relationship between employees' perceptions of safety and ...

Create successful ePaper yourself
Turn your PDF publications into a flip-book with our unique Google optimized e-Paper software.
236<br />
M. O’Toole / Journal <strong>of</strong> Safety Research 33 (2002) 231–243<br />
(5) It is understood that all parts <strong>of</strong> a system are interrelated; however, findings from<br />
this assessment are limited to the <strong>safety</strong> system.<br />
5. Methods<br />
A 41-item <strong>safety</strong> perception survey was distributed to all employees, including plant<br />
<strong>of</strong>fice employees. Each item presented the employee with a choice <strong>of</strong> responding either<br />
‘‘yes’’ or ‘‘no.’’ From the combined responses, a percent positive response rate was<br />
computed for each question by dividing the total number <strong>of</strong> positive responses by the total<br />
responses. It consists <strong>of</strong> those questions <strong>and</strong> factors that prior research has shown to be<br />
valid indicators <strong>of</strong> the state <strong>of</strong> the management system. <strong>The</strong> results are compared to<br />
normative data from previously administered surveys from other industrial companies,<br />
which are contained in a database <strong>of</strong> more than 50,000 surveys.<br />
Once aggregated, the data can be examined at a number <strong>of</strong> different levels in an attempt<br />
to identify external factors that might influence the company’s <strong>safety</strong> results. From the<br />
demographic data, the following independent variables were examined for their potential<br />
influence on the <strong>safety</strong> results: (a) Location, (b) Business Group, (c) Job Categories, (d)<br />
Company Length <strong>of</strong> Service, <strong>and</strong> (e) Age.<br />
A total <strong>of</strong> 3116 surveys were distributed during <strong>safety</strong> meetings, where employees had<br />
an opportunity to complete the survey on a voluntary basis during work time. A total <strong>of</strong><br />
1414 surveys were returned, for a response rate <strong>of</strong> 45.3%. According to an expert at NSC,<br />
had the approach been followed as prescribed, a response rate <strong>of</strong> 80%–90% would have<br />
been expected (K. Kolosh, personal communication, February 6, 2001).<br />
After the survey was completed, the author had the opportunity to investigate the lowerthan-expected<br />
response rates at a number <strong>of</strong> the company’s locations. Information gathered<br />
as part <strong>of</strong> informal conversations with managers throughout the company suggest that<br />
some locations did not follow the instructions for distributing the survey as part <strong>of</strong> monthly<br />
<strong>safety</strong> meetings in January 1999. Apparently, at these locations, managers or supervisors<br />
h<strong>and</strong>ed the surveys out to employees at the beginning or end <strong>of</strong> a shift <strong>and</strong> requested that<br />
the employees fill them out <strong>and</strong> return them to the <strong>of</strong>fice. <strong>The</strong>re was little or no follow-up<br />
with employees who failed to return a completed survey. According to Kolosh, given those<br />
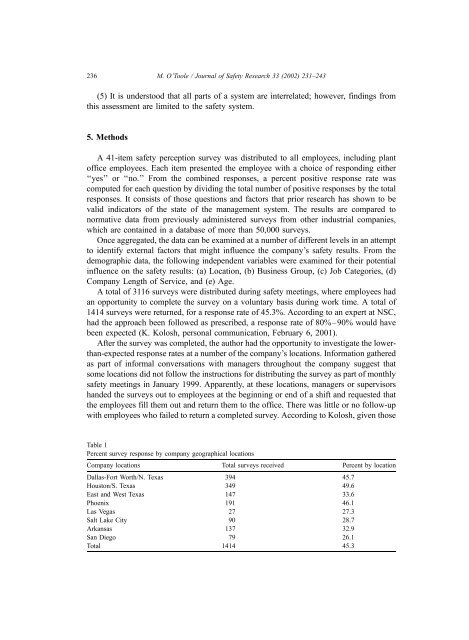
Table 1<br />
Percent survey response by company geographical locations<br />
Company locations Total surveys received Percent by location<br />
Dallas-Fort Worth/N. Texas 394 45.7<br />
Houston/S. Texas 349 49.6<br />
East <strong>and</strong> West Texas 147 33.6<br />
Phoenix 191 46.1<br />
Las Vegas 27 27.3<br />
Salt Lake City 90 28.7<br />
Arkansas 137 32.9<br />
San Diego 79 26.1<br />
Total 1414 45.3