The Phenology Handbook - USA National Phenology Network
The Phenology Handbook - USA National Phenology Network
The Phenology Handbook - USA National Phenology Network

You also want an ePaper? Increase the reach of your titles
YUMPU automatically turns print PDFs into web optimized ePapers that Google loves.
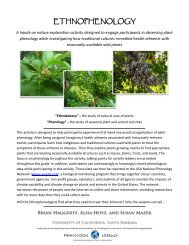
visit a natural landscape can track green-up on a daily or weekly basis.<br />
By identifying which habitats and plant species are leafing out, we can<br />
identify the phenological events and species that contribute most to the<br />
infrared reflectance values observed from space (this process is called<br />
“ground-truthing”).<br />
At an even finer spatial scale (e.g., from square miles to square meters),<br />
biogeochemical sensors can measure daily and seasonal fluctuations in<br />
temperature, precipitation, atmospheric gasses, sunlight, soil nutrients,<br />
stream flow, and other components of the abiotic environment that<br />
plants and animals require for growth. With these data on hand, scientists<br />
can determine the influence of environmental factors on phenological<br />
patterns.<br />
<strong>The</strong> longest known phenological<br />
monitoring record comes from<br />
the Royal Court of Kyoto in Japan,<br />
where the onset of flowering for<br />
cherry trees has been recorded<br />
since 705 AD. Some wine-producing<br />
regions in Europe also boast<br />
records of blooming and harvest<br />
dates that extend back hundreds<br />
of years.<br />
SUMMARY<br />
Over the long-term, the timing and duration of green-up can be compared from year to year and from decade to<br />
decade to detect whether climatic variation affects the productivity or geographic distribution of natural plant<br />
communities. Scientific disciplines can be combined to investigate phenological patterns across both biological<br />
and geographical levels of organization. This integrated phenological research can provide layers of information<br />
across space and time that reveal when and how different communities and biomes change as a function of climate<br />
change and other environmental conditions. Although remotely-sensed data can provide broad measures<br />
of global phenological patterns, ground truthing and biogeochemical monitoring are essential for identifying the<br />
factors that drive phenological patterns within and among communities and biomes. Synthesizing information<br />
from multiple levels of biological and geographical scales is the best way to discover broad ecological patterns<br />
and the processes that drive them.<br />
In the following sections of this handbook, we will help you to develop the botanical tools and record-keeping<br />
methods needed to become an independent <strong>Phenology</strong> Steward who can contribute to the <strong>National</strong> <strong>Phenology</strong><br />
<strong>Network</strong>’s growing community of ground-truthers.<br />
Green-up refers to the progressive increase in plant growth at the beginning of spring. Springtime increases<br />
in plant growth can be tracked with great sensitivity by satellites, detecting and measuring the rate at which<br />
the earth’s vegetation produces its annual flush of leaves. From a weekly series of satellite images covering<br />
the Northern Hemisphere during the spring months, scientists can see that spring starts earlier at southerly<br />
latitudes and progresses northwards, and spring starts earlier at lower elevations and progresses upward in<br />
elevation. Intuitively this should make sense to many people – spring comes earlier in Southern California<br />
than it does in Northern California, and spring comes earlier in the valleys than it does in the mountains. Of<br />
course the intricate details of this pattern depend on the topography of the land as well as many physical,<br />
chemical, and biological factors, but the broad geographic patterns are simply remarkable: when reviewing<br />
the series of satellite images, it appears to scientists as though a green wave is progressing northward in<br />
latitude and upward in elevation! (In the Southern Hemisphere, the green wave progresses southward in<br />
latitude and upward in elevation).<br />
14