The Phenology Handbook - USA National Phenology Network
The Phenology Handbook - USA National Phenology Network
The Phenology Handbook - USA National Phenology Network

Create successful ePaper yourself
Turn your PDF publications into a flip-book with our unique Google optimized e-Paper software.
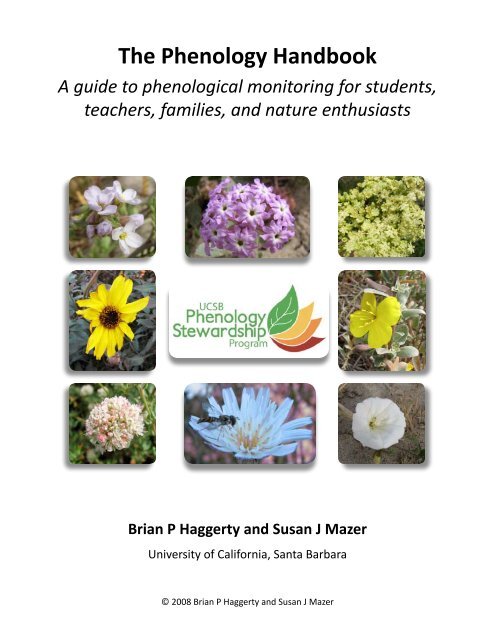
<strong>The</strong> <strong>Phenology</strong> <strong>Handbook</strong><br />
A guide to phenological monitoring for students,<br />
teachers, families, and nature enthusiasts<br />
Brian P Haggerty and Susan J Mazer<br />
University of California, Santa Barbara<br />
© 2008 Brian P Haggerty and Susan J Mazer
Acknowledgments<br />
Since the Spring of 2007 it has been our great pleasure to work with a wide variety of students, educators, scientists,<br />
and nature enthusiasts while developing the <strong>Phenology</strong> Stewardship Program at the University of California,<br />
Santa Barbara. We would like to express our gratitude to those who have contributed (and who are currently contributing)<br />
time and energy for field observations, classroom implementation, and community outreach. We thank<br />
the <strong>Phenology</strong> Stewards (UCSB undergraduates) who have helped to collect plant and avian phenological data at<br />
UCSB’s Coal Oil Point Natural Reserve and to develop the methodologies and protocols that are presented in this<br />
handbook. Special thanks to the <strong>Phenology</strong> Stewardship graphic design team who helped develop this handbook.<br />
We also thank Scott Bull, the UCSB Coastal Fund, and the students of UCSB for providing funding for the development<br />
of the <strong>Phenology</strong> Stewardship Program at UCSB.<br />
We would like to thank those in the Santa Barbara region who are implementing phenology education and engaging<br />
students to participate in Project Budburst and the <strong>USA</strong> <strong>National</strong> <strong>Phenology</strong> <strong>Network</strong>, including:<br />
• Dr. Jennifer Thorsch and UCSB’s Cheadle Center for Biodiversity and Ecological Restoration (CCBER), as<br />
well as the teachers associated with CCBER’s “Kids In Nature” environmental education program;<br />
• the “teachers in training” in the Teacher Education Program at UCSB’s Gevirtz School of Graduate Education<br />
who work in K-12 schools throughout Santa Barbara;<br />
• docents at natural reserves and botanic gardens, including Coal Oil Point, Sedgwick, Arroyo Hondo, Rancho<br />
Santa Ana, Carpenteria Salt Marsh, Santa Barbara Botanic Garden, Lotusland Botanic Garden; and<br />
• Kate Eschelbach, education & outreach specialist with the Ventura office of the US Fish & Wildlife Service,<br />
who has been instrumental in expanding our phenology science & education efforts in Southern California.<br />
We would also like to express our gratitude to the consortium of scientists and educators associated with the <strong>USA</strong><br />
<strong>National</strong> <strong>Phenology</strong> <strong>Network</strong>, and especially to our colleagues in the NPN’s Education, Citizen Science, and Outreach<br />
working group. With operational support from the University Corporation for Atmospheric Reserach and<br />
with funding from the U.S. Bureau of Land Management, the <strong>National</strong> Science Foundation, ESRI, and the <strong>National</strong><br />
Fish and Wildlife Foundation, the ECSO working group launched Project Budburst in the Spring of 2007.<br />
This <strong>Phenology</strong> <strong>Handbook</strong> is a work in progress, and will be updated continually through the summer and fall of<br />
2009. We plan to increase the scope of the handbook by including a chapter that describes methods for using the<br />
herbarium to study historical phenology, as well as more species descriptions in the <strong>Phenology</strong> Field Guide.<br />
•<br />
Brian P Haggerty, M.S.<br />
Susan J Mazer, PhD<br />
Santa Barbara, California<br />
Summer, 2009
<strong>The</strong> <strong>Phenology</strong> <strong>Handbook</strong><br />
A guide to phenological monitoring for students,<br />
teachers, families, and nature enthusiasts<br />
INTRODUCTION<br />
2 What is phenology?<br />
3 Phenological variation across biological and geographical scales<br />
12 <strong>The</strong> modern science of phenology<br />
21 <strong>Phenology</strong> networks - A gateway to detecting environmental change<br />
PROTOCOLS FOR PHENOLOGICAL MONITORING<br />
28 Introduction<br />
28 Plant phenophases<br />
29 General considerations for starting observations<br />
38 <strong>USA</strong> <strong>National</strong> <strong>Phenology</strong> <strong>Network</strong> phenophase definitions<br />
PHENOLOGY ACTIVITY GUIDE<br />
46 Introduction & table of contents<br />
47 Students Observing Seasons (S.O.S.): Native Plant <strong>Phenology</strong> Observation Garden<br />
(POG) activities for 5th grade classrooms.<br />
57 Phenological activities for middle, high school, and introductory college-level<br />
students<br />
71 Teacher’s Guide to phenology<br />
PHENOLOGY FIELD GUIDE<br />
77 A species-specific guide for phenological monitoring at Coal Oil Point Natural<br />
Reserve and the central California coast.<br />
All content, images, and designs © Brian P Haggerty and Susan J Mazer, unless otherwise noted<br />
1
WHAT IS PHENOLOGY?<br />
PHENOLOGY IS THE OBSERVATION AND MEASUREMENT OF EVENTS IN TIME<br />
<strong>The</strong> passing of the seasons is one of the most familiar phenomena on Earth. Consider, for example, the onset<br />
of spring in temperate climates. As winter ends, our surroundings burst with new life — forest canopies fill with<br />
vibrant greens, flocks of birds migrate in formation to northern breeding grounds, and brilliant wildflowers and<br />
their insect pollinators appear in rapid succession across hillsides, roadsides, lake margins, and fields. Similarly,<br />
as autumn approaches, the deciduous forest canopy progresses towards a colorful demise, birds navigate their<br />
return to southern wintering grounds, mammals gorge on the summer’s bounty to prepare for their winter hibernation,<br />
and many plants ripen their last fruits before the onset of winter.<br />
Whether we live in urban or rural environments, there are constant reminders of the changing of the seasons.<br />
Many of us notice when the first wildflowers appear in the spring, when our favorite fruits are available in the<br />
local farmers’ markets or supermarket, when trees change color or lose their leaves in the fall, when wildfire risk<br />
is highest due to the drying of our forests’ fuels, or when frost first appears in the fall or winter. By studying the<br />
seasons in greater detail over the course of our lives, we can deepen our connection with, and understanding of,<br />
the landscapes we inhabit. We also develop our ability to observe and to measure the pace and the timing of the<br />
seasons, the onset and duration of which are shifting with the changing climate.<br />
Scientists refer to the study of the timing of seasonal biological activities<br />
as phenology. This term was first introduced in 1853 by the Belgian<br />
botanist Charles Morren and is derived from the Greek words phainos,<br />
meaning “to appear, to come into view” and logos, meaning “to study.”<br />
<strong>Phenology</strong> is the science that measures the timing of life cycle events in<br />
plants, animals, and microbes, and detects how the environment influences<br />
the timing of those events. In the case of flowering plants, these<br />
life cycle events, or phenophases, include leaf budburst, first flower, last<br />
flower, first ripe fruit, and leaf shedding, among others. Phenophases<br />
commonly observed in animals include molting, mating, egg-laying or<br />
birthing, fledging, emergence from hibernation, and migration.<br />
While the term seasonality is<br />
used to describe changes in the<br />
abiotic environment, such as the<br />
dates of the first and last frosts<br />
of the winter, or the date that<br />
ice melts in lakes or streams, the<br />
term phenology is reserved for<br />
describing the timing of biological<br />
activities.<br />
To characterize and to describe phenophases, phenologists record the dates that these events occur, and they<br />
study how environmental conditions such as temperature and precipitation affect their timing. In addition, phenology<br />
may incude the study of how the timing of phenophases evolves by natural selection in response to<br />
periodic environmental conditions such as winter cold, summer drought, and the emergence of pests and predators.<br />
<strong>The</strong> timing of phenological events can be quite sensitive to environmental conditions. For example, in a<br />
particularly warm and dry spring, leaf budburst and first flower might occur weeks earlier than usual, whereas in<br />
an exceptionally cool and wet spring they could be equally delayed. As a result, the timing of phenophases tends<br />
to vary among years based on patterns of weather, climate and resource availability. Phenological observations<br />
are therefore integrative measures of the condition of the physical, chemical, and biological environment. This<br />
environmental sensitivity means that phenological studies are simple and cost-effective ways to measure environmental<br />
changes, including climate change, over the long-term.<br />
2<br />
Weather is defined as the near-term atmospheric conditions of a region, such as temperature, precipitation,<br />
humidity, wind, and sunshine. <strong>The</strong> climate of a region, on the other hand, is characterized by the<br />
generally-prevailing weather conditions. For example, Santa Barbara, California is characterized by a Mediterranean<br />
climate – warm, dry summers and cool, moist winters. <strong>The</strong>re are, however, daily and weekly<br />
changes in the weather that can rapidly change the temperature, sunshine, and wind conditions.
PHENOLOGICAL VARIATION<br />
<strong>The</strong> timing and duration of phenophases within and among individuals, populations, and communities<br />
<strong>Phenology</strong> is a science for all seasons, locations, and species. From the leafing, flowering, and fruiting times of<br />
plants to the molting, mating, and migration times of the animals they support, the phenological progression<br />
of an individual, a population, or an entire species may occur rapidly or slowly, and synchronously or asynchronously<br />
with other organisms. How, then, can we measure and compare phenological patterns for a wide variety<br />
of organisms that exhibit different phenophases and at different time scales? <strong>The</strong> answers rest in the scale of our<br />
observations and in the ways that we record and describe them.<br />
<strong>Phenology</strong>, as all environmental sciences, uses quantitative methods to measure and to describe the occurrence<br />
of events and patterns in the natural world. Phenologists are interested in the dates when phenophases occur,<br />
their duration, and the pace of transitions between phenophases, and these observations can take place at multiple<br />
biological and geographical scales. For example, a phenologist may record the dates that a plant opens its<br />
first and last flowers (from which the duration of flowering can be calculated), as well as the number of flowers<br />
that are open each day or week during the flowering period. This can be done for one or many individuals of the<br />
same species in one population, for multiple populations of a species that occupies different habitats or locations,<br />
and for multiple populations of different species that coexist in one habitat.<br />
Levels Of Biological Organization<br />
<strong>The</strong> biological world can be observed at a variety of “scales” — ranging from long-distance observations<br />
to close-up and detailed views. Each scale generally requires a different set of tools, from satellites<br />
to magnifying glasses to microscopes. <strong>Phenology</strong> is one of the few sciences that routinely measure<br />
patterns at many of these scales. <strong>The</strong> levels of biological observation that are most important to the<br />
global and local study of phenology are shown below.<br />
INTRODUCTION<br />
Biome<br />
A group of co-occurring plant, animal, and microbial<br />
communities that live in the same type of climate, share<br />
a well-defined geographic area, are adapted to a particular<br />
substrate and level of nutrient cycling, and exhibit a<br />
recognizeable set of dominant life forms and habitats.<br />
Remote sensing technologies allow<br />
for the detection of geographically<br />
extensive phenological patterns<br />
Community<br />
A group of co-occurring populations of different species,<br />
each of which interacts with some proportion of the other<br />
species.<br />
Population<br />
A collection of individuals of one species inhabiting the<br />
same general area or sharing a common environment.<br />
Organism (Individual)<br />
One member of a population or species that may or may<br />
not depend on other members of its population in order<br />
to survive.<br />
Observational studies performed<br />
by on-the-ground phenologists provide<br />
site intensive documentation<br />
of phenological patterns<br />
3
<strong>Phenology</strong> Across Levels Of Biological Organization<br />
Individual: One member of a population or species that may or may not depend on other members of its<br />
population to survive. Individuals of the same species that live in the same location and that have the potential<br />
to mate with each other belong to the same “population”. Nevertheless, they may exhibit great variation in the<br />
timing of their phenophases. <strong>The</strong> particular phenological pattern that an individual exhibits (e.g., the date of germination;<br />
the onset and duration of flowering; the average number of flowers open per day during the flowering<br />
season; and the time of seed dispersal) is usually due to both genetic and environmental influences.<br />
<strong>The</strong> timing of an individual plant’s phenophases can have a profound effect on its reproductive success, as it<br />
is likely to determine whether: it survives to flower; its flowers are pollinated; its flowers develop successfully<br />
into seed-bearing fruits; its fruits ripen fully and are successfully dispersed; and whether most of its seeds will<br />
germinate and produce seedlings that survive to adulthood. As for all traits that are determined by an individuals<br />
genes and that affect success in reproducing, the timing of phenophases in plants and animals is subject to<br />
evolution by natural selection.<br />
If the climate changes gradually, and if populations contain enough genetic variation in phenological traits such<br />
as the date of first flower, they will be able to adapt as natural selection favors individuals (and their genes) with<br />
phenological schedules that perform well under the new environmental conditions. Evolutionary biologists are<br />
concerned, however, that if climate change progresses too rapidly, many populations will not be able to adapt<br />
because they will not contain any genetic variants that perform well under the new conditions. Climate change<br />
has been associated with species’ extinctions in the past.<br />
Population: A group of individuals of one species inhabiting the same general area or sharing a common environment,<br />
and with the biological ability to mate with each other. <strong>The</strong> phenological patterns exhibited by the<br />
members of a population are important because they determine: whether individuals are available for mating<br />
with each other; whether individuals compete for resources such as moisture in the soil or food; which individuals<br />
are exposed to (or escape from) flower- and seed-eating predators; and whether individuals can cooperate<br />
to deter herbivores or predators.<br />
Species: Species is a collective term that usually refers either to one or to all of the populations of a given<br />
species. Populations of a given species may be large or small, closely spaced or highly isolated, and composed<br />
of individuals that occur in clumped, uniform, or random distributions. Where multiple populations of a given<br />
species are phenologically synchronized and not too far away from each other, the potential for migration and<br />
mating between populations is much higher than when they are phenologically mismatched. <strong>The</strong> exchange of<br />
individuals among populations can be very important, as it is one the most common mechanisms that maintains<br />
genetic diversity within them.<br />
Community: A community is a group of co-occuring populations of different species, each of which interacts<br />
with some proportion of the other species in the community. Some of the interactions are positive, in which<br />
both species benefit (examples include pollination and seed dispersal). Other interactions benefit one species<br />
but harm the other(s), including predator-prey interactions, host-parasite relationships, and harmful microbial<br />
infections of plants and animals. <strong>The</strong> phenology of interacting species can be crucial to their survival, as the<br />
survival of mutually dependent members will be strongly influenced by whether and how their phenophases<br />
overlap. For example, if a pollinator emerges from winter dormancy and its nectar sources aren’t flowering yet,<br />
both the pollinator and the plant on which it depends will suffer. <strong>The</strong> pollinator will have no food source, and<br />
the plant will not produce seeds.<br />
Biome: A biome is a group of co-occurring plant, animal, and microbial communities that live in the same type<br />
of climate, share a well-defined geographic area, are adapted to a particular substrate and level of nutrient<br />
cycling, and exhibit a recognizeable set of dominant life forms and habits. Examples include: deciduous forests,<br />
woodlands, coastal dunes, shrublands, tropical forests, boreal (subarctic) forests, mangroves, grasslands, and<br />
deserts.<br />
4
As you can see, phenology can be observed and measured at multiple levels of biological and geographical<br />
organization. Information from each of these levels provides fundamental knowledge about patterns and processes<br />
in nature. Phenological studies can inform us about the timing and duration of resource availability in<br />
ecological communities, including: when pollen and nectar are available to pollinators; when fruits are available<br />
to fruit-eating animals (including humans!); when leaves are available for herbivorous insects and mammals;<br />
and whether plants must compete with each other for the services of pollinators and seed dispersers.<br />
Phenological studies can also help to inform agricultural planning, the implementation and timing of disease<br />
and pest control methods, and eco-tourism industries, as well as the anticipation of allergy seasons.<br />
<strong>The</strong> first goal of this section is to demonstrate how variation in phenological patterns can be described and<br />
measured at multiple levels, including:<br />
• within and among individuals;<br />
• within and among populations;<br />
• within a community of coexisting species; and<br />
• across large geographic regions such as states, continents, hemispheres, and even the entire planet<br />
<strong>The</strong> second goal is to help you understand how the phenological progression of an individual, population, or<br />
community can influence its ability to survive and to reproduce.<br />
This background in phenological variation will help you to develop a framework for understanding the variation<br />
that you observe in your backyard, school yard, or natural area. It will also provide you with some terminology<br />
that will allow you more easily to communicate your observations with other phenologists. Although<br />
we use flowering phenology as our primary example, keep in mind that the principles presented in this section<br />
can easily be applied to other organisms that may or may not exhibit similar phenophases (e.g., birthing<br />
times of mammals, migration and egg-laying times of birds, spawning times of fish, hibernation schedules of<br />
mammals, and pollen-producing times of non-flowering plants like Pine trees).<br />
INTRODUCTION<br />
Phenological variation within and among individuals - flowering curves<br />
Scientists have described over 250,000 species of flowering plants in the world. Although some species flower<br />
irregularly or continuously (e.g., in tropical biomes where environmental conditions are more or less constant),<br />
most flowering plants in the temperate zone exhibit conspicuous flowering phenophases that start<br />
and stop at predictable times of the year and in response to local climatic cues. <strong>The</strong> timing of these phenophases,<br />
and especially the pace of flowering, is highly variable among individuals, populations, and species.<br />
While some species (or individuals or populations) produce only a few flowers over a short period of time,<br />
others produce many flowers over the course of months. <strong>The</strong>se patterns can be captured by graphs of flowering<br />
curves, from which it is easy to visualize the dates of key phenophases and to make comparisons among<br />
individuals (Figure 1).<br />
Figure 1 shows the flowering curve for an individual plant that opens its first flower on April 15. For this<br />
individual poppy, the date of peak flowering is May 6, and the date of last flower (defined as the date when<br />
the last flower opens) is June 10. This means that the duration of flowering was 8 weeks (or 56 days). If floral<br />
display surveys were conducted for more California Poppy individuals in the same population, the resulting<br />
flowering curves would reveal variation in flowering phenology (Figure 2).<br />
Figure 2 shows three hypothetical flowering curves, each curve representing a different individual of California<br />
Poppy. First, notice the variation among the three individuals for the dates of first flower, peak flowering,<br />
and last flower. <strong>The</strong> shapes of the three flowering curves also differ– the blue curve is the same shape as the<br />
black curve but shifted two weeks later, whereas the red curve exhibits a different shape altogether. Also<br />
5
notice that even though the red curve differs in shape<br />
from the black curve, the date of peak flowering is the<br />
same. Lastly, notice that the duration of flowering is<br />
shortest for the individual plant represented by the<br />
black curve and longest for the individual represented<br />
by the red curve. Overall, the flowering curves of these<br />
three individuals overlap, which means that these individuals<br />
might compete for pollination service. Alternatively,<br />
the simultaneous flowering of these plants<br />
might help to attract pollinators, as they will present a<br />
more conspicuous display of flowers and provide more<br />
nectar than an individual plant. <strong>The</strong> overlap in flowering<br />
times also means that pollinators could be transferring<br />
pollen among these plants.<br />
If a phenologist’s goal is to quantify and to summarize<br />
the phenological behavior of a population (such<br />
is often the case), a single graph that contains thirty<br />
or more flowering curves would be a bit overwhelming.<br />
Instead, the mean and variance of a phenophase<br />
of a population can be expressed in a different type<br />
of graph. In Figure 3, the mean date of first flower is<br />
April 8 for 30 individuals of the same California Poppy<br />
population in Santa Barbara. <strong>The</strong> error bars represent<br />
the variation among individuals within the population<br />
for date of first flower; there is a moderate amount of<br />
variation in this population (more about this shortly).<br />
If the pace and duration of flowering are tracked for<br />
each of these 30 individuals, the same graph could<br />
easily be constructed for other phenophases such as<br />
peak flowering and last flower.<br />
Figure 1. Hypothetical flowering curve for one California Poppy<br />
individual that is located at Coal Oil Point Natural Reserve in<br />
Santa Barbara, CA. <strong>The</strong> dates of first flower, peak flowering, and<br />
last flower are marked by closed symbols. <strong>The</strong> y-axis should be<br />
labeled as “number of open flowers”.<br />
Figure 2. Hypothetical flowering curves of three California Poppy<br />
individuals that are located at Coal Oil Point Natural Reserve in<br />
Santa Barbara, CA. Dates of first flower, peak flowering, and last<br />
flower are marked by closed symbols for each individual (the<br />
black curve is the same as in Figure 1). <strong>The</strong> y-axis should be labeled<br />
as “number of open flowers”.<br />
6<br />
Phenological variation within a population – what does it mean?<br />
<strong>The</strong> variation in flowering phenology among individuals in this population of California Poppy could be due to<br />
different sources, including:<br />
• environmental factors – the timing of an organism’s phenophases can change dramatically as a<br />
direct response to environmental conditions such as temperature or the microhabitat in which<br />
each individual plant lives (e.g., in the shade of another plant vs. direct sunlight, in a sandy soil vs.<br />
a clay soil, highly exposed to cold winds vs. protected from them);<br />
• genetic factors – the genes inherited by, and expressed by, each individual (the flowering curves<br />
of siblings or other closely related individuals will tend to be more similar than the flowering<br />
curves of more distantly related individuals); or<br />
• a combination of environmental and genetic factors - for many traits, the phenotype of an individual<br />
(e.g., its flowering time or duration) is determined by interactions between the genes that<br />
affect the trait and the environment in which they are expressed.
While more detailed observations and experiments<br />
could reveal the relative importance of each of these<br />
sources of variation in shaping flowering patterns,<br />
we can also think of the consequences of variation in<br />
flowering patterns.<br />
Patterns of mating and reproductive success in flowering<br />
plants – and therefore the long-term sustainability<br />
of a population – are largely dependent on the timing<br />
of flowering. For example, individuals that initiate<br />
flowering before pollinators are active in the spring are<br />
likely to suffer low reproductive success due to a lack<br />
of pollen transfer. Similarly, if the beginning and the<br />
end of the flowering season are characterized by only<br />
a few individuals that are flowering, the availability<br />
of pollen during these periods may be relatively low,<br />
even if pollinators are abundant. If individual plants<br />
cannot attract pollinators when population sizes are<br />
low (e.g., at the beginning and end of the flowering<br />
Figure 3. Hypothetical mean date of first flower for 30 California<br />
Poppy individuals in the Santa Barbara population is<br />
April 8. Variation among individuals in the population is represented<br />
by the height of the error bars above and below the<br />
mean value.<br />
season), natural selection will favor individuals that flower synchronously (e.g., at the time of a population’s<br />
peak flowering). In addition, during times of the season when only a few individuals are flowering, the probability<br />
of mating between close relatives increases, and this can reduce the genetic quality of the seeds produced.<br />
INTRODUCTION<br />
On the other hand, if so many individuals of the same species flower at the same time that they compete for pollinators,<br />
then many of their flowers are likely to remain unpollinated. In this case, individuals that flower slightly<br />
“out of synch” (earlier or later) with the majority of their local population may benefit (have higher pollination<br />
success) because there is less competition for pollinators. In sum, variation in flowering patterns among individuals<br />
within populations will affect their visitation by both pollinators and seed dispersers, and this will affect the<br />
way that natural selection acts to favor particular phenophases.<br />
Many plant biologists refer to plants as “phytometers” because their development and<br />
reproduction can provide excellent integrative information about ambient conditions.<br />
Phenological variation among populations<br />
Building upon this understanding of phenological variation within populations, we can continue to scale up our<br />
observations to compare phenological variation among populations. Let’s suppose that students from San Diego,<br />
San Francisco, and Arcata each conduct a within-population study. <strong>The</strong> onset of spring typically arrives earliest<br />
at southern latitudes (San Diego) and progresses northward (Santa Barbara, then San Francisco, then Arcata), so<br />
the students hypothesize that California Poppies will start flowering earliest in San Diego, followed by the next<br />
northern location (Santa Barbara), and so on. <strong>The</strong> results of this hypothetical study are graphed in Figure 4.<br />
<strong>The</strong>re are two major aspects of phenological variation that are illustrated in Figure 4. First, notice that the students<br />
discovered a latitudinal trend in flowering times, just as they expected. As mentioned above, this trend is<br />
also commonly observed along elevation gradients, where populations at higher elevations tend to flower later<br />
than populations at lower elevations. <strong>The</strong>se phenological changes with latitude and elevation are commonly<br />
observed in a variety of plants and animals, and represent strong direct environmental regulation of biological<br />
activities, typically by temperature. This general principle is described by Hopkin’s Law: the date of first flowering<br />
7
(and other phenophases) is delayed by approximately 4 days per degree latitude or 120 meters elevation (equivalent<br />
to 1 day per 100 feet elevation). While these trends reflect the sensitivity of phenophases to environmental<br />
factors, keep in mind that genetic factors also regulate the timing of phenophases and that the patterns we see<br />
in nature are largely the result of interactions between environmental and genetic factors.<br />
Figure 4 also illustrates different levels of within-population<br />
variation – the San Francisco population exhibits<br />
the greatest amount of variation among individuals<br />
in first flowering date, whereas the Arcata population<br />
exhibits the least amount of variation. Another way<br />
to describe this pattern is that the Arcata population<br />
exhibits the greatest amount of synchrony for first<br />
flowering date. As we discussed earlier, the amount<br />
of synchrony within populations can have important<br />
short- and long-term consequences for pollination<br />
success, seed production, and seed quality. As you will<br />
see in the next section, phenological variation among<br />
coexisting species can have important consequences<br />
for community dynamics.<br />
Phenological variation among coexisting species:<br />
community-level phenology<br />
Figure 4. Hypothetical mean date of first flower of California<br />
Poppy (for 30 individuals from each of four populations) increases<br />
with increasing latitude, from San Diego in the south<br />
to Arcata in the north. <strong>The</strong> Santa Barbara result is the same<br />
as in Figure 3. <strong>The</strong> y-axis should be labeled as “date of first<br />
flower”.<br />
8<br />
A brief visit to any habitat, whether it’s a backyard, school yard, or park, can reveal community-level phenology.<br />
<strong>The</strong> casual observer is likely to find some plant species that are flowering and other species that are not. Of the<br />
species that are flowering, some are likely to be just starting to flower (these plants will bear a large proportion<br />
of closed flower buds relative to the proportions of open flowers and developing fruits) and others are likely to<br />
be finishing up (these plants will exhibit a very low proportions of closed flower buds and open flowers and a<br />
very high proportion of developing fruits). <strong>The</strong> more attentive observer will notice the distribution of pollinating<br />
insect species among the flowering plants, noting whether particular insects prefer the flowers of certain plant<br />
species. Similarly, some species of birds might tend to spend more time visiting certain plant species, foraging<br />
for nectar (hummingbirds) or dispersing fruits and seeds (many songbirds).<br />
A repeated visit a week or two later will reveal changes that have occurred in the phenology of the plant community,<br />
and probably in the abundance or assemblage of insect and bird species as well. Community-level<br />
phenology is quantified as the change over time in the appearance, activities, interactions, or diversity of the<br />
assemblage of coexisting species in one habitat (Figure 5).<br />
Figure 5 depicts the phenology of a portion of a hypothetical ecological community. For each of the five species<br />
of flowering plants, the length of the red line represents the duration of each species’ flowering period. For<br />
example, the starting point of each line represents the date when the first individual plant in that population<br />
started to flower, and the endpoint represents the date when the last plant produced its last flower. For insect<br />
pollinators (green lines), insectivorous birds (insect-eating; orange lines), and frugivorous birds (fruit-eating; blue<br />
<strong>The</strong>re are several ways to calculate variation among individuals that can be represented by the range<br />
bars shown in Figures 3 and 4. <strong>The</strong> most common estimate of variation is called the standard deviation.<br />
See the Activity Guide Chapter in this <strong>Handbook</strong> for instructions on how to calculate this and other<br />
measures of phenological variation.
INTRODUCTION<br />
lines), each line represents the start and end of foraging activity (pollinating, insect-eating, fruit-eating). In other<br />
words, the lines show the start date and the end date of all monitored individuals in the population.<br />
Figure 5. Graphical representation of the phenological progression of a biologically diverse community.<br />
Each horizontal line represents the timing and duration of a particular kind of phenological<br />
activity observed in a single species. For example, for flowering plants, each line may represent the<br />
duration of the flowering period of a given species. In this case, each line starts at the date of first<br />
flower among all monitored plants in the population, and the line ends at the date of the last flower<br />
produced by any of these plants. Similarly, for the species of insect pollinators, insectivorous birds,<br />
and frugivorous birds, the lines represent the first and last dates that any individual of these species<br />
is observed to be actively foraging. Drawing a vertical line across the graph at any date reveals the<br />
diversity and identity of coexisting (and potentially interacting) species; note that diversity and the<br />
composition of the community changes over the course of time.<br />
Note that plants differ from animals in that, generally speaking, it is much more likely that individual plants can<br />
be monitored repeatedly within a growing season, recording the first and last flowering date of each individual<br />
plant. With this information, the start and end dates for the plant species in Figure 5 could, alternatively, represent<br />
the average dates of first and last flower, respectively. For example, we could calculate the average (mean)<br />
date of first flower if we recorded this date from multiple individuals. It’s much more challenging to do this for<br />
animals simply because they’re highly mobile and it’s difficult to identify different individuals.<br />
Starting at the earliest date in February (you can impose a vertical line across the entire graph to help visualize<br />
this), only one of the four monitored species of insect pollinator was active when the first plant species began<br />
to flower and when the first insectivorous bird species was observed to forage. Moving the date to mid-March,<br />
four of the five species of plants were flowering, three species of insect pollinators were active, four species of<br />
insectivorous birds were observed, and one species of frugivorous bird was actively foraging. Finally in late-July<br />
there were only two species of plants that were in flower, one species of insect pollinator, one species of insectivorous<br />
bird, and three species of frugivorous birds. Of these three time periods, biodiversity of the “active”<br />
community was highest in mid-March.<br />
9
Community-level phenology - what does it tell us?<br />
What does the phenology of ecological communities tell us beyond its approximate time schedule? To start, it<br />
describes the availability of resources in the community and sheds light on which species might be interacting<br />
most strongly with other species. For example, in the community represented by Figure 5, the two species of<br />
plants that were still flowering in July could be visited by only one species of insect pollinator (at least, among<br />
those pollinators observed); if this pollinator prefers to forage for pollen and nectar in one species over the<br />
other, then fruit and seed production of the neglected species is likely to suffer.<br />
As a more complex example, the abundance of insectivorous bird species is highest in March and the foraging activities<br />
of these birds is likely to reduce the abundance of insect pollinators. This may, in turn, reduce pollination<br />
services for the plants that are in flower at that time, which could result in many flowers being left unpollinated.<br />
This reduction in pollination could then lead to a decrease in the availability of ripe fruits for the three species<br />
of frugivorous birds that appear later in the spring. If three species of frugivorous birds are actively foraging for<br />
a limited supply of fruits, then competitive interactions among them are likely to be intense, and this could potentially<br />
affect the reproductive success of either individual birds or an entire population.<br />
Overall, ecological communities are dynamic assemblages of coexisting species that interact both directly and<br />
indirectly over time. Thus, the phenology of communities provides a measure of their diversity and productivity,<br />
the combination of which can contribute to the long-term stability of the community.<br />
Phenological variation among communities (across landscapes, continents, hemispheres, and the globe)<br />
<strong>The</strong> detection of phenological patterns across ecological communities and across broad geographic scales plays<br />
an important role in our understanding of global environmental changes. <strong>The</strong> recent development of new remote<br />
sensing technologies (e.g., satellite-based observations) as well as new information-sharing and analytical<br />
tools has enabled the integration of historically disparate environmental sciences (more about this later). <strong>The</strong><br />
resulting multidisciplinary approach has led to the development of large databases that provide layers of information<br />
on physical, chemical, and biological processes across a variety of geographic scales. <strong>The</strong>se efforts have<br />
helped to develop a stronger understanding of how environmental conditions, especially the climate system,<br />
10<br />
<strong>Phenology</strong> can also be examined at the level of the flower within an individual. This series of images of California<br />
Brittlebrush (Encelia californica) shows the phenological progression of one sunflower, from a young bud on the left<br />
to a withered flower on the right (a withered flower, also called a “spent” flower, usually indicates that the flower was<br />
pollinated and is maturing its seeds). Similar to the previous examples that quantify and describe the amount of variation<br />
of first flowering date, there can be variation among individuals, populations, and species for the rate at which<br />
individual flowers open, wilt, and mature seeds. Can you remember the three sources of variation that are likely to<br />
influence phenological traits?<br />
You might be surprised to know that a sunflower is actually a collection of many small flowers (called an “inflorescence”)!<br />
Each of the large yellow “petals” is part of an individual “ray flower”, and each yellow strand in the middle is<br />
part of an individual “disk flower”. Notice in this phenological progression that ray flowers mature first, followed by the<br />
outermost disc flowers, and finally the innermost disc flowers. Can you detect the difference between fresh and wilted<br />
flowers on this sunflower inflorescence? This same inward progression is common to many species of sunflowers - take<br />
a close look the next time you see some in your yard, at the market, and at the florist’s shop!
affect phenological patterns among ecological communities and biomes. Some questions that have emerged<br />
focus on determining which community types are most sensitive to environmental change, which communities<br />
are the most imperiled, and how changes in one community can affect the productivity and diversity of another<br />
community.<br />
SUMMARY - WHAT IS PHENOLOGY?<br />
From individuals and populations to communities and biomes, the phenological attributes of living systems influence<br />
their ecological interactions and therefore the probability of their long-term persistence. For example,<br />
if species that depend on each other (mutualists, such as a plant species and its pollinator) do not thrive at the<br />
same time (synchronously), then both species may suffer. <strong>The</strong> timing of an organism’s phenophases can change<br />
dramatically as a direct response to environmental conditions, and this can have larger effects in the community.<br />
For example, warmer weather at the onset of spring can cause the seeds of many species to germinate earlier<br />
than they ordinarily would. Some individuals and species are more malleable (or “plastic”) in this regard than<br />
others, and the asynchrony that may arise as a result of species-specific responses to environmental change can<br />
have cascading effects through the community.<br />
<strong>The</strong> productivity and sustainability of ecological communities, whether wild or farmed, can be greatly diminished<br />
when the phenophases of interdependent populations or species become asynchronous. With these concepts in<br />
mind, we can now provide a more precise definition of phenology: <strong>Phenology</strong> is the study of the timing of recurring<br />
biological events, the interaction of biotic and abiotic forces that affect these events, and the interrelation<br />
among phases of the same or different species.<br />
INTRODUCTION<br />
SYNTHESIS - PHENOLOGICAL VARIATION<br />
With the introduction above, you’re now well aware of the ways in which the phenological schedule of an individual,<br />
population or species can affect its ability to persist in natural communities such as forests, fields, and<br />
streams, or in managed communities such as farms, local parks, or recreational areas.<br />
For example, what are some ways in which an individual plant’s flowering schedule may result in lower fruit production<br />
or seed quality compared to that of other members of the same population? Flowering when pollinators<br />
or potential mates are scarce — or when flower-eating insects are particularly abundant — will reduce pollination<br />
and fruit production. Alternatively, when closely related individuals flower at the same time, the inbreeding<br />
that may result can lead to reduced genetic quality of the seeds produced in the same way that mating between<br />
close relatives in humans and other animals can increase the risk of genetic diseases. Delaying flowering until<br />
late in the season, when the risk of drought (in deserts and in Mediterranean climates) or frost (in seasonal temperate<br />
climates) increases, may prevent any successful seed production at all. <strong>The</strong> risks associated with flowering<br />
at the “wrong” time are many and sometimes fatal.<br />
With these ideas in mind, you should have no trouble providing answers to the following questions:<br />
For a given plant species, how may populations that are spatially separated from each other benefit from being<br />
in phenological synchrony with each other?<br />
• Unless populations are so isolated from each other that they never come in contact through seed<br />
dispersal or through the movement of pollen by wind or by animal-transfer, populations often<br />
benefit from receiving genetically distinct seeds or pollen from other populations. This increases<br />
a population’s genetic diversity and may increase the probability that it can adapt to environmental<br />
change.<br />
11
Within a given community, what are some additional ways in which one or more species are affected by the<br />
timing of the phenophases of other species?<br />
• Pollinators that eat pollen (e.g., female bees and their offspring) will only have a food source if<br />
they are active during the flowering period of their favored plant species. Reciprocally, flowering<br />
plants that rely on animal pollinators will only produce fruits (and seeds) if they flower when their<br />
pollinators are abundant and searching for them.<br />
• Nectar-eating birds, bees, and ants depend on the flowering time of their “prey”; plants that are<br />
attacked by these “nectar-robbers” will suffer reduced fruit and seed production, while plants<br />
that flower when such “thieves” are rare will enjoy higher reproduction (assuming that their pollinators<br />
are available!).<br />
• Flower- and bud-eating beetles, bugs, moth and butterfly larvae, and other insects depend on the<br />
flowering schedules of their prey. So, not only does the phenology of plants affect their exposure<br />
to nectar-thieves, but it also affects their exposure to flower- and bud-eating species.<br />
• <strong>The</strong> phenology of moth and butterfly larvae not only affect the plants that they eat, but it has<br />
strong effects on the survivorship and reproductive success of the birds that eat them.<br />
• Pest-controlling insects and birds eat agricultural pests that, in turn, can destroy crops. A wellknown<br />
example is the lady bug, a type of beetle that eats aphids, which — if not controlled — will<br />
attack young flowers, stems, and leaves. If pest-controlling animals (lady bugs, in this case) are<br />
not active in synchrony with their prey, an entire season of a crop’s production may fail.<br />
In sum, the phenology of plants influences the abundances of the insects that eat or pollinate them as well as of<br />
the birds and small mammals that depend on them for fruits and seeds. <strong>The</strong> phenology of plant-eating insects<br />
and small mammals, in turn, affects the reproduction of their plant prey. <strong>The</strong> phenology of pollinating insects<br />
affects the reproductive success of the plants that they visit. And, the phenology of insectivorous birds affects<br />
the larvae on which they depend and the plants on which those larvae are found!<br />
<strong>The</strong> answers to the above questions can have important implications both for wild species and for managed<br />
crops. <strong>The</strong> long-term viability of many wild plant populations depends on successful pollination, which can be<br />
limited if plants flower when pollinators are scarce or unavailable. If fruit and seed production are diminished<br />
because of plant-pollinator asynchrony, food availability to frugivorous (fruit-eating) birds and mammals could<br />
be severely reduced. It is easy to imagine how food web dynamics in nature could be altered by asynchrony in<br />
the biological community. This is also true in the case of managed crops, where almost all of the farmed fruits<br />
that humans eat come from pollination services that are provided by insects. <strong>The</strong> synchrony of pollinator availability<br />
and flowering in farmed plants is therefore critical to our ability to produce food.<br />
THE MODERN SCIENCE OF PHENOLOGY<br />
A new era in seasonal studies<br />
Modern phenological studies are thought to have been initiated in Europe in the mid-18th century. Beginning<br />
in 1736, Robert Marsham kept detailed records of “Indications of Spring” on his family estate in Norfolk, Britain<br />
with the goal of improving timber production by learning more about the timing of plant and animal life cycles.<br />
His annual observations included the first occurrences of leafing, flowering and insect emergence. His descendents<br />
maintained these records until 1947, making it one of Europe’s longest phenological monitoring records.<br />
Although he was equipped with only a notebook and a writing instrument, the “modern” aspect of Marsham’s<br />
approach was the systematic nature in which he recorded phenological events for many wild species living in a<br />
single ecosystem (27 phenophases for 20 plants and animals).<br />
12
<strong>Phenology</strong> is an ancient science<br />
<strong>Phenology</strong> is one of the earliest fields of science, studied by humans for millennia to predict the availability<br />
of food through the comings and goings of seasons. Early humans depended largely on their ability to locate,<br />
identify, and protect edible plants during all times of the growing season. This means that they had to<br />
be familiar with both the vegetative (stems, leaves, and roots) and the reproductive (flowers, fruits, seeds)<br />
units of the plants in their ecosystem so that they could identify them during all seasons. <strong>The</strong> same was<br />
true for agrarian societies, whose members also collected seeds and learned to maximize crop production<br />
by optimizing the timing of planting and harvesting. An adage common to some Native American tribes<br />
of eastern North America states that corn seeds should be planted in the spring soon after the leaves of<br />
nearby oak trees have reached a particular size (i.e., the size of a mouse’s ear or a red squirrel’s foot! *).<br />
This practice, based on generations of trial and error, predicts the earliest planting time so that the corn<br />
plants have enough time to fully mature before the end of the growing season; if corn seeds are planted<br />
before this time they run the risk of rotting in the ground. Although farming methodologies vary greatly<br />
today, the craft of maximizing crop production is no less important. With widespread loss of agricultural<br />
lands to urban development and a global human population size exceeding 6.6 billion, the timing of planting,<br />
harvesting, and crop rotations is critical to our ability to supply food for local and global demands.<br />
* Russell, Howard S. 1980. Indian New England Before the Mayflower. University Press of New England. 284 pp. ISBN<br />
0874511623<br />
Similar approaches have been employed by people worldwide since Marsham’s time — not necessarily to follow<br />
his lead or because their livelihood depends on it, but because they enjoy observing nature and predicting the<br />
dates on which season events would occur each year. Phenological studies today can be just as simple, taking<br />
place in backyards, school grounds, urban parks, or wilderness areas, or they can be very complex and employ<br />
advanced technologies and tools such as automated weather stations, inconspicuous video cameras, automated<br />
environmental sensors, and satellites, together revealing global and local seasonal patterns and the mechanisms<br />
that drive them.<br />
Today’s phenological studies: integrating scientific disciplines<br />
INTRODUCTION<br />
Some of the most rigorous phenological studies performed today are carried out by environmental scientists<br />
representing a wide range of approaches, including population biologists, community ecologists, climatologists,<br />
hydrologists, and specialists in satellite-driven remote-sensing. <strong>The</strong> integration of scientific disciplines makes<br />
for particularly powerful studies because the site intensive nature of one tool (e.g., botanical inventories and<br />
detailed phenological studies) can complement the geographically extensive information provided by another<br />
(e.g., satellites). Let’s consider this in more detail in the following example.<br />
At the continental scale, sensors in NASA’s MODIS (Moderate Resolution Imaging Spectroradiometer) satellites<br />
in two earth-orbitting NASA satellites measure the amount of sunlight reflected from the earth’s surface on a<br />
daily basis. Leaves reflect light that is particularly rich in wavelengths in the near-infrared portion of the light<br />
spectrum, which the human eye cannot see but that satellite sensors can measure. <strong>The</strong> reflectance of light from<br />
leaves is greatest in mid-summer when leaves are most abundant, and lowest in winter when grasslands, shrublands,<br />
and forest trees are mostly bare. Thus, these satellites detect and record the onset of spring by detecting<br />
a rapid increase in the reflectance of infrared wavelengths – this phenomenon is called green-up. Alternatively,<br />
the senescence of leaves in the autumn leads to a decrease in reflectance, and this is called brown-down. By<br />
collecting these remotely-sensed data on a regular basis and on a large geographic scale, scientists can accurately<br />
measure the onset of spring growth across the entire Northern or Southern Hemisphere.<br />
At the same time as green-up is detected around the world by satellites, plant-watchers on Earth can observe<br />
the fine details of this process. Families, students, nature enthusiasts, and professional botanists who regularly<br />
13
visit a natural landscape can track green-up on a daily or weekly basis.<br />
By identifying which habitats and plant species are leafing out, we can<br />
identify the phenological events and species that contribute most to the<br />
infrared reflectance values observed from space (this process is called<br />
“ground-truthing”).<br />
At an even finer spatial scale (e.g., from square miles to square meters),<br />
biogeochemical sensors can measure daily and seasonal fluctuations in<br />
temperature, precipitation, atmospheric gasses, sunlight, soil nutrients,<br />
stream flow, and other components of the abiotic environment that<br />
plants and animals require for growth. With these data on hand, scientists<br />
can determine the influence of environmental factors on phenological<br />
patterns.<br />
<strong>The</strong> longest known phenological<br />
monitoring record comes from<br />
the Royal Court of Kyoto in Japan,<br />
where the onset of flowering for<br />
cherry trees has been recorded<br />
since 705 AD. Some wine-producing<br />
regions in Europe also boast<br />
records of blooming and harvest<br />
dates that extend back hundreds<br />
of years.<br />
SUMMARY<br />
Over the long-term, the timing and duration of green-up can be compared from year to year and from decade to<br />
decade to detect whether climatic variation affects the productivity or geographic distribution of natural plant<br />
communities. Scientific disciplines can be combined to investigate phenological patterns across both biological<br />
and geographical levels of organization. This integrated phenological research can provide layers of information<br />
across space and time that reveal when and how different communities and biomes change as a function of climate<br />
change and other environmental conditions. Although remotely-sensed data can provide broad measures<br />
of global phenological patterns, ground truthing and biogeochemical monitoring are essential for identifying the<br />
factors that drive phenological patterns within and among communities and biomes. Synthesizing information<br />
from multiple levels of biological and geographical scales is the best way to discover broad ecological patterns<br />
and the processes that drive them.<br />
In the following sections of this handbook, we will help you to develop the botanical tools and record-keeping<br />
methods needed to become an independent <strong>Phenology</strong> Steward who can contribute to the <strong>National</strong> <strong>Phenology</strong><br />
<strong>Network</strong>’s growing community of ground-truthers.<br />
Green-up refers to the progressive increase in plant growth at the beginning of spring. Springtime increases<br />
in plant growth can be tracked with great sensitivity by satellites, detecting and measuring the rate at which<br />
the earth’s vegetation produces its annual flush of leaves. From a weekly series of satellite images covering<br />
the Northern Hemisphere during the spring months, scientists can see that spring starts earlier at southerly<br />
latitudes and progresses northwards, and spring starts earlier at lower elevations and progresses upward in<br />
elevation. Intuitively this should make sense to many people – spring comes earlier in Southern California<br />
than it does in Northern California, and spring comes earlier in the valleys than it does in the mountains. Of<br />
course the intricate details of this pattern depend on the topography of the land as well as many physical,<br />
chemical, and biological factors, but the broad geographic patterns are simply remarkable: when reviewing<br />
the series of satellite images, it appears to scientists as though a green wave is progressing northward in<br />
latitude and upward in elevation! (In the Southern Hemisphere, the green wave progresses southward in<br />
latitude and upward in elevation).<br />
14
Who participates in ground-truthing phenology?<br />
• botanists exploring forests, fields, streamsides, and coastlines to monitor our natural biodiversity;<br />
• farmers recording the growth of their crops (or the appearance of weeds!);<br />
• park rangers and land managers who monitor the health of our forests;<br />
• livestock managers who move cows and sheep among pastures so that the animals graze on<br />
plants of a particular seasonal age;<br />
• park visitors, hikers, and backpackers interested in spying the springtime activities of plants and<br />
the animals that depend on them;<br />
• birdwatchers observing the migrations of their favorite birds and keeping watch on the foods<br />
that they eat;<br />
• agriculturalists concerned about the appearance of insect pests that eat our crops;<br />
• maple sugar harvesters planning when to tap maple trees for their sap in the fall;<br />
• promoters of ecotourism who need to predict the timing of optimum annual wildflower and<br />
autumn leaf-turning displays;<br />
• ecologists who monitor rodents and other mammals that carry diseases such as Lyme Disease<br />
and Hanta virus, and whose populations grow and shrink with the availability of fresh, edible<br />
plant material;<br />
• fire fighters concerned about the build-up of fuel (all growing plant material) that affects summertime<br />
wildfire risk;<br />
• physicians interested in predicting the intensity of allergy seasons;<br />
• plant naturalists interested in collecting wild species for herbs, spices, dyes, and medicinal<br />
uses;<br />
• home gardeners aiming to predict the best time to sow vegetable seeds or to transplant seedlings;<br />
and<br />
• students tracking the phenology of schoolyard gardens to start their own <strong>Phenology</strong> Diaries.<br />
INTRODUCTION<br />
In short, with a little bit of botanical know-how, families, students, scientists, and any individual with<br />
an affection for plants can participate in phenological monitoring in their neighborhoods, backyards,<br />
and natural areas.<br />
Although many people are familiar with four seasons (spring, summer, autumn, winter), some regions<br />
of the world experience a different number of seasons. In Australia, for example, aboriginals<br />
who have inhabited the continent for over 50,000 years have developed calendars based on the<br />
seasonal activities of plants and animals in relation to changes in temperature, wind, and rain patterns.<br />
<strong>The</strong>se calendars actually note between 5 and 10 distinct seasons depending on which region<br />
of Australia is being described.<br />
Keatley, M. and Fletcher T. 2003. Phenological data, networks and research: Australia. Pp. 22-44, In <strong>Phenology</strong>: An Integrative<br />
Environmental Science. Ed. M. Schwartz. Kluwer Academic Publishers. 563 pp. ISBN 1402015801<br />
15
PHENOLOGY AND CLIMATE CHANGE<br />
A (VERY) BRIEF OVERVIEW OF CLIMATE CHANGE<br />
It is widely known that the Earth’s climate system is changing rapidly. Although there is a range of opinions on<br />
how best to mitigate the consequences of climate change, there is strong agreement on how and why it is occurring.<br />
Here are just a few facts about changes in temperature, documented in the 2007 Assessment Report of<br />
the Intergovernmental Panel on Climate Change (IPCC - http://www.ipcc.ch/):<br />
• Global average surface temperatures have increased by 0.74˚C (1.33˚F) during the last 100 years;<br />
this is the largest and fastest warming trend in the last millennium.<br />
• <strong>The</strong> rate of warming has increased in recent decades. <strong>The</strong> most recent 50 years have warmed at<br />
nearly twice the rate seen in the previous 50 years, and 11 of the last 12 years have been the hottest<br />
in recorded history (since 1850).<br />
• Land surfaces have warmed slightly faster than ocean surfaces, and the greatest rates of surface<br />
warming are continually found in mid- to high-latitude continental regions of the Northern Hemisphere.<br />
<strong>The</strong>se changes, and many others that are not described here, are largely attributable to the emission of greenhouse<br />
gasses into the atmosphere and their continued accumulation, including carbon dioxide (CO 2 ), methane<br />
(CH 4 ), nitrous oxide (N 2 O), and fluorinated gasses (e.g., hydrofluorocarbons, perfluorocarbons, and sulfur<br />
hexafluoride). <strong>The</strong>re is no doubt in the scientific community that human activities such as industrialization,<br />
burning of fossil fuels, and deforestation have contributed to increased concentrations of greenhouse gasses and<br />
therefore to global climate change.<br />
<strong>The</strong>re are multiple ways to define the growing season of a region, but most definitions point to the time<br />
of year that is favorable to plant growth. This metric can change depending on how cold-hardy the plants<br />
in a given habitat are, but a common definition is the time period between the beginning of spring and the<br />
occurrence of the first killing frosts of autumn, otherwise known as the frost-free season. <strong>The</strong> examples<br />
above show the effects of climate change on the physical world (e.g., snowpack, duration of lack and river<br />
ice, and the area of the arctic ice sheet), but climate change has similarly strong influences on the biological<br />
world. One major difference is that, while highly complex mathematical models have been quite successful<br />
in predicting the effects of climate change on physical global activities (such as ice melt), the effects on the<br />
biological world are immeasurably difficult to model and, as a result, are highly unpredictable.<br />
16<br />
CLIMATE CHANGE ON A SEASONAL TIME SCALE – THE CHANGING GROWING SEASON<br />
In order to discuss the connections between climate change and phenology, we first need to understand how<br />
climate change is affecting the timing and intensity of the seasons. <strong>The</strong> term “global warming” often evokes images<br />
of unbearably hot summers. While it is true that summertime high temperatures are rising worldwide, it<br />
often surprises people to learn that in seasonal environments around the world – those characterized by cool or<br />
cold winters and warm or hot summers – winter is the most rapidly warming season. In fact, by many measures<br />
winters are warming at nearly twice the rate of summers. Where this occurs, winters are not only warmer, they<br />
are also shorter, and this change can be seen in several ways:<br />
• <strong>The</strong> amount of time that lakes, rivers, and polar oceans are covered with ice during the winter<br />
is decreasing. In the Northern Hemisphere, observations of early-winter freezing dates for rivers<br />
and lakes over the last 150 years have revealed that freezing is becoming delayed at a rate of<br />
nearly 6 days per century. Ice “breakup” at the end of winter, in turn, is taking place earlier, at a<br />
rate of ~6.5 days per 100 years.
• Snow cover and snowpack have decreased in most regions of the world where they have been<br />
tracked by satellite, particularly in the Northern Hemisphere. Declines of snow cover in the mountains<br />
is particularly strong at lower elevations (this has been seen in both western North America<br />
and the Swiss Alps), where increases in April temperatures seem to be the most direct cause.<br />
• Even the icepack of the arctic seas is melting rapidly; satellite imagery has detected that, over the<br />
last 30 years, the area covered by sea ice is declining at an annual rate of almost 3%. This decline<br />
is seen in both the winter and summer ice caps, with the rate of disappearance of the summer ice<br />
reaching nearly 7.5% per decade.<br />
• <strong>The</strong> permafrost layer of the Arctic — the layer of soil that remains frozen year-round, regulating<br />
the drainage patterns and stability of the terrestrial biome — has been increasing in temperature<br />
since the 1980s. Its surface has increased by up to 3 oF (that’s 5.4 oC), causing its lower levels to<br />
be disappearing (thawing and melting) at a rate of 2 – 4 centimeters per year!<br />
One direct consequence of a warmer and shorter winter is the earlier onset of spring temperatures. Across the<br />
entire Northern Hemisphere, spring is arriving earlier at a pace of approximately 1.2 days per decade. Land surfaces<br />
are also retaining more heat during the summer, leading to persistent summer temperatures that linger<br />
into the fall. Thus, with regard to the temperatures that permit plants to grow, an earlier spring and a persisting<br />
summer means that the growing season is expanding (whether plants will receive enough rainfall to take advantage<br />
of these warmer temperatures is an unresolved question of great concern). Across Europe, for example,<br />
the growing season expanded 10.8 days during the period 1960-1999 (6 days toward an earlier spring, 4.8 days<br />
toward a longer-lasting summer).<br />
INTRODUCTION<br />
While these might seem like small changes, the natural world is actually responding in observable, dramatic, predictable<br />
(and in some cases, unpredictable), and potentially problematic ways. Summarizing more than 29,000<br />
observational data series that demonstrate significant changes in physical and biological systems, the IPCC reported<br />
in 2007 that more than 89% (25,810) of those changes are in the direction expected as a response to climate<br />
change. In the biosphere, these changes tend to fall into two categories: responses in space and in time.<br />
BIOLOGICAL RESPONSES TO CLIMATE CHANGE IN SPACE AND TIME – THE FINGERPRINT OF CLIMATE CHANGE<br />
Geographic responses to climate change: range expansion and migration<br />
On a spatial scale, many species of animals and plants have expanded their geographic ranges poleward in latitude<br />
(northward in the northern hemisphere; southward in the southern hemisphere) and upward in elevation<br />
over the last century, following shifting temperatures. As higher elevations experience more mild winters, for<br />
example, species from lower elevations may expand their range towards higher elevations because they can now<br />
tolerate the winters there. <strong>The</strong> same may be true across latitudes; species from lower latitudes (i.e., closer to the<br />
equator) may expand their range toward higher, or poleward, latitudes.<br />
Range expansions can be advantageous for species that can disperse easily, but they can threaten the existence<br />
of less mobile or more sensitive species. For instance, when one species expands its range into new territory, it<br />
may displace one or more species that have inhabited this territory for thousands or millions of years. If, in turn,<br />
the displaced species cannot migrate to new and suitable areas, they may become locally or globally extinct.<br />
Also, while some species may expand their ranges into higher elevations or latitudes in response to climate<br />
change, others will be forced to reduce their ranges as their habitats become too warm, too dry, or too extreme<br />
in their annual temperatures.<br />
Furthermore, migration into new territory is often impossible, as habitat fragmentation due to human activities<br />
(such as the building of housing developments, golf courses, highways, or shopping malls) or the existence of<br />
natural barriers such as rivers or mountain ranges can prevent the movement (or dispersal) of seeds and fruits,<br />
and of young, pregnant or nursing animals.<br />
17
Additionally, current and predicted rates of warming might outpace the dispersal rates of many organisms, especially<br />
for the thousands of plant species for which seed dispersal requires particular species of animals to eat<br />
their fruits. If their seed dispersers do not carry the seeds to other habitats, then plants will not be able to colonize<br />
new and potentially suitable habitats.<br />
Lastly, food webs within ecological communities are likely to change when novel species colonize a habitat, potentially<br />
disrupting resource availability for many members of the community. For example, as the number and<br />
abundances of different species in an area change as species move in and out in response to climate change,<br />
the number and types of species competing for the same foods can increase. When this happens, competition<br />
for a rare food resource (such as ripe fruits or newly emerged insect larvae) can become particularly intense.<br />
Under these conditions, the risk of extinction is likely to increase for many species (recall our earlier example of<br />
frugivorous birds competing for ripening fruits in Figure 5).<br />
Temporal responses to climate change: earlier and/or extended phenology<br />
On a temporal scale, at any given location, living organisms respond to the expanding or shifting growing season<br />
by changing their phenological schedules. Thousands of biological records spanning both the globe and the<br />
20th century indicate a nearly ubiquitous shift in spring phenology toward earlier calendar dates. To summarize,<br />
organisms are tracking an earlier start to the growing season by emerging from dormancy earlier (mammals, insects),<br />
migrating earlier (birds, insects, mammals), developing new leaves and stems earlier (plants), and breeding<br />
earlier (mammals, insects, birds, plants). Not surprisingly, similar delays in autumn phenology are occurring<br />
due to a persistent summer—deciduous trees are shedding their leaves later than expected, and birds and mammals<br />
are migrating later in the autumn than normal.<br />
As you can imagine, the consequences of phenological shifts will depend on the level of biological organization<br />
that we investigate, and these consequences may be either positive or negative. For a long-lived individual<br />
tree, for example, leafing out several days earlier each spring may allow it to get a rapid head start in its annual<br />
growth, especially if neighboring trees remain leafless, which would allow its leaves to receive a great deal of<br />
sunlight. On the other hand, if it produces its leaves earlier than any of the other members of its population, it<br />
may be particularly vulnerable to leaf-eating insects (e.g., moth and butterfly larvae, leaf miners, and leaf-cutting<br />
ants) simply because it will be a rare and limited resource for them.<br />
18<br />
<strong>The</strong> Intergovernmental Panel on Climate Change (IPCC)<br />
After decades of scientific discussion about the possibility of global warming, in 1988 the World Meteorological<br />
Organization and the United Nations Environmental Programme created the Intergovernmental<br />
Panel on Climate Change (IPCC). <strong>The</strong> IPCC is a multidisciplinary scientific body that regularly brings together<br />
hundreds of experts from all regions of the world to assess the global climate system. <strong>The</strong>ir efforts are<br />
broadly focused on two topics: the assessment and interpretation of scientific information, and the formulation<br />
of realistic response strategies at national and global levels. <strong>The</strong>ir findings have been published in a<br />
series of ground-breaking Assessment Reports (1990, 1995, 2001, 2007) as well as in a handful of Special<br />
Reports examining topics in greater detail.<br />
<strong>The</strong> IPCC’s First Assessment Report in 1990 played a decisive role in the establishment of an international<br />
treaty for climate change mitigation in 1992, the United Nations Framework Convention on Climate Change<br />
(UNFCCC). <strong>The</strong>ir Second Report provided key input for the negotiations of the Kyoto Protocol in 1997. <strong>The</strong><br />
IPCC received the 2007 Nobel Peace Prize after the publication of its Fourth Assessment Report, which contained<br />
the strongest language to date concluding that “warming of the climate system is unequivocal” and<br />
that “there is very high confidence that the net effect of human activities since 1750 has been one of warming.”<br />
You can learn more about the IPCC online at www.ipcc.ch
<strong>The</strong> effects of a phenological shift on a given population of a species will also depend on whether the other species<br />
on which it relies — for food, pollination, or seed dispersal — change with it. For example, if populations<br />
that benefit from each other respond differently to climate change (e.g., if a plant population flowers on average<br />
five days earlier but its pollinators haven’t arrived), then one or both of them may exhibit population declines.<br />
On the other hand, if a population flowers early enough to “escape” one or more of its “natural enemies” (e.g.,<br />
flower bud-eating beetle larvae), it may reap the benefits of high flower and fruit production. Phenological<br />
changes that increase the growth, the probability of survivorship, or the reproductive performance of an individual<br />
or population are said to be adaptive, while phenological responses that increase the risk of mortality or<br />
of reproductive failure are maladaptive. Whether a given phenological response (e.g., earlier leaf-out, earlier<br />
flowering, or extended flowering) is adaptive or maladaptive is very likely to differ among species, even in the<br />
same community. In short, the consequences of any population’s or species’ response will depend on the abundances,<br />
behaviors, and phenological responses of their coexisting beneficial species (e.g., pollinators) and natural<br />
enemies (e.g., predators and parasites).<br />
At the community level, predictions are also highly<br />
elusive. We’ve learned from radio-tracking and<br />
bird-banding efforts that birds are returning to<br />
spring and summer breeding grounds earlier and<br />
earlier, but the effects of these altered migration<br />
patterns on both the birds and the species with<br />
which they interact (as predators or as seed dispersers)<br />
are likely to be highly species- and community-specific.<br />
Nevertheless, there are several<br />
rules of thumb that probably apply.<br />
First, the more specialized the relationship between<br />
species, the more vulnerable each of them<br />
is likely to be to the phenological effects of climate<br />
change. For example, plant species that are pollinated<br />
by only one species of pollinator are more<br />
vulnerable to losing these pollinator services than<br />
are species that are visited by a diverse community<br />
of pollinator species. Similarly, insects that<br />
rely on a single plant species as their food source<br />
may experience severe population declines if their<br />
emergence times are mismatched with the growing<br />
or flowering season of their host plant.<br />
A note about the worlds’ oceans<br />
data from IPCC’s 2007 reports<br />
Sea levels are on the rise worldwide, but not just because<br />
glaciers and sea ice are melting. In fact, melting<br />
glaciers and ocean ice account for only 28% and 15%<br />
of the rise in sea level, respectively. <strong>The</strong> most critical<br />
factor in rising sea levels is actually the warming of the<br />
ocean from solar radiation and the greenhouse effect.<br />
<strong>The</strong> oceans are absorbing over 80% of the heat added<br />
to the climate system, which leads to heat being dispersed<br />
vertically through the depths of the oceans. As<br />
a result, the average temperature of the “global ocean”<br />
has warmed to over 3000m deep, raising scientists’<br />
concerns over how oceanic processes such as circulation<br />
patterns (e.g., the North Atlantic Oscillation) will<br />
operate in the future. In addition, when water heats up,<br />
it expands — this “thermal expansion of the oceans”<br />
accounts for 57% of the total rise in sea level.<br />
INTRODUCTION<br />
Second, animals that habitually migrate between geographically distant biomes to complete distinct portions of<br />
their life cycles (e.g., growth and sexual maturation vs. breeding) are particularly vulnerable to the phenological<br />
effects of climate change simply because there are more inter-specific interactions that may be disrupted. Such<br />
species must continue to exhibit a phenological schedule that is viable given the co-occuring species and the<br />
climate in each of their “home” habitats. For example, species of birds that migrate over long distances must cooccur<br />
with their food sources (while avoiding their enemies) in the biome in which they grow and reach sexual<br />
maturity, and then, following migration to their breeding grounds, they must be in synchrony with the sources<br />
of food that they feed to their newborns. Migratory animals must meet these demands while also avoiding the<br />
natural enemies that destroy them.<br />
19
<strong>The</strong> fingerprint of climate change<br />
<strong>The</strong>se shifts in geographic range and phenology are what scientists call the “fingerprint of climate change.” What<br />
at first appears to be a situation where a species is accommodating or “adapting” to climate change by altering<br />
the pace and duration of its annual cycle may actually be a risk-filled response — phenological schedules are<br />
changing rapidly and at different rates for co-dependent species such as plants and pollinators. <strong>The</strong>re is an increasing<br />
number of reports in recent years of population crashes in the wild due to asynchronous responses to<br />
climate change among co-dependent species, but we are only beginning to learn how widespread they are and<br />
in how many different kinds of organisms they occur.<br />
One consequence of asynchronous phenological responses to climate change among interacting species<br />
<strong>The</strong> Dutch Pied Flycatcher (Ficedula hypoleuca) is a small passerine bird that migrates from Western Africa<br />
to Europe each spring. Upon its arrival at its northern breeding grounds it consumes caterpillars. <strong>The</strong> caterpillars<br />
have been responding to warmer spring temperatures by emerging as adults earlier in the spring,<br />
but some Flycatcher populations have not migrated earlier to keep pace. <strong>The</strong>se mistimed Flycatcher populations<br />
have been in steep decline in recent years because of the asynchrony of their migration phenology<br />
with the phenology of their food source at its breeding grounds.<br />
Photo freely available from Aelwyn and the Wikimedia Project.<br />
CC-BY-SA terms of usage available at www.wikimedia.org<br />
Visser, ME, C. Both, and MM Lambrechts. 2004. Global climate change leads to mistimed avian reproduction. Advances in Ecological<br />
Research 35: 89-110.<br />
Durant, J. M., D. O Hjermann, G. Ottersen, and NC Stenseth. 2007. Climate and the match or mismatch between predator requirements<br />
and resource availability. Climate Research 33: 271-283.<br />
20
PHENOLOGY NETWORKS<br />
A GATEWAY TO DETECTING ENVIRONMENTAL CHANGE<br />
Shortly after Robert Marsham initiated modern phenological surveys on his land in Britain, the Swedish botanist<br />
Carolus Linnaeus (1707-1778) revolutionized the field of phenology by conducting a study simultaneously in<br />
many locations. In 1750, Linnaeus, the scientist who invented the classification system still used today to name<br />
and to describe all plants and animals, selected multiple sites in Sweden where he recorded annually the dates<br />
of leafing, flowering, fruiting, and leaf fall for many species, along with the weather conditions at flowering. He<br />
described his methods in his work Philosophia Botanica so that others could replicate the study. This was the<br />
first blueprint for the creation of a phenology network, which many scientists and citizens around the world then<br />
implemented at different geographic scales over the following decades and centuries.<br />
<strong>The</strong> goal of a phenology network is to train and to coordinate a group of people to monitor simultaneously<br />
phenological events across a wide geographic area and to share their information. Observers across a country<br />
or continent rely on a common set of definitions and protocols in order to standardize their observations across<br />
regions and for many different species. <strong>The</strong>se standardized studies can have many uses—historically the most<br />
common goal has been to understand and to predict variation in the life cycles of plants and animals for agricultural<br />
applications. A practical knowledge of phenological patterns has also allowed hunters to predict game<br />
availability, enabled city and land managers to plan for resource use, and permitted societies to plan cultural<br />
events around natural phenomena.<br />
INTRODUCTION<br />
<strong>Phenology</strong> networks blinked on and off throughout Europe and the world during the late-19th and 20th centuries.<br />
Many of them were phased out due to wars, a general decrease in their applicability, a lack of government<br />
support, or a combination of these factors. Some successful networks, such as the Canadian effort that was initiated<br />
as early as 1890, proved their worth in the botanical or climatological sciences and then were expanded by<br />
either individual scientists or national meteorological agencies. Thus, the dominant trend was toward nationally<br />
coordinated phenological observations, but there was an unfortunate lack of coordination among networks at<br />
the international level, especially across Europe. As a result, monitoring protocols have differed among networks<br />
and countries, and datasets have been difficult to merge, thereby limiting their integration and scope.<br />
<strong>The</strong> first notable exceptions to this lack of integration were the International Phenological Gardens (IPGs). <strong>The</strong><br />
IPGs were established in several European countries in the late 1950’s based on the growing need to predict<br />
the timing of agricultural seasons. Recognizing that genetically based differences in phenological events among<br />
plant populations collected from the wild can overwhelm the environmental signal obtained from phenological<br />
observations of local populations, scientists propagated clones of 14 species of trees and shrubs and sent them<br />
to gardens located from Italy to the Netherlands. More gardens were established in subsequent years, and over<br />
50 of them are still being monitored today.<br />
Given that the gardens contain genetic replicates of each species, the phenological differences between sites<br />
indicate the direct effects of geographic variation in climate on phenological patterns. For example, when a<br />
given species exhibits progressively earlier springtime flowering from the northern to the southern gardens, this<br />
can be interpreted as a phonological response to the latitudinal change in climate. In this way, the International<br />
Phenological Gardens have played a critical role in detecting the effects of climate change on the phenology of<br />
plants, and in revealing intrinsic differences between species in their sensitivity to the same climatic factors. Collectively,<br />
the phenological information provided by these gardens has led to the creation of climate maps as well<br />
as to predictive computer models for the improvement of agricultural practices. In fact, the study mentioned<br />
previously revealing a 10.8 day expansion of the European growing season was published by IPG scientists describing<br />
the phenology of their cloned trees and shrubs.<br />
21
Recognizing the contemporary value of these data and of the remaining infrastructure of independently functioning<br />
phenology networks throughout Europe, the European <strong>Phenology</strong> <strong>Network</strong> (EPN) was established in<br />
2000 by the <strong>Phenology</strong> Study Group of the International Society of Biometeorology. <strong>The</strong> EPN’s goals were to create<br />
a platform from which to coordinate phenological monitoring efforts and to standardize observations across<br />
Europe to monitor more efficiently the changing climate. Other networks around the world have also developed<br />
or resurfaced over the past decade under the same context. Today, phenology networks exist in North and South<br />
America, Europe, East Asia and Australia.<br />
PHENOLOGY NETWORKS AND THE CITIZEN SCIENTIST MOVEMENT<br />
While the databases created by contemporary phenology networks are filled by professional scientists who<br />
observe and report the timing of seasonal events, some networks have invited citizen scientists to participate.<br />
<strong>The</strong>se include nature enthusiasts, home gardeners, park docents, botanical garden staff, farmers, <strong>National</strong> Park<br />
rangers, families, teachers, and students. When people across a wide geographic area are trained to observe and<br />
record phenophases in their backyards, local parks, field stations, and nearby wild areas, the number of observations<br />
submitted to a database can accumulate rapidly. This process also engages the public so that they become<br />
How does a clonal phenological garden work?<br />
Earlier in this chapter you learned how scientists quantify phenological variation at a variety of biological<br />
and geographical scales. You also learned that the observed variation in phenology among individuals,<br />
population, and communities can be due to three sources of variation: environmental factors, genetic factors,<br />
or a combination of environmental and genetic factors. We can express this concept in the following<br />
mathematical equation:<br />
V = G + E + GxE<br />
Where:<br />
V is the observed variation in a trait among individuals within a population (such as with date of<br />
first flower in our earlier examples);<br />
G is the amount of variation in the trait due to genetic differences among individuals (e.g., siblings<br />
tend to flower at a similar time, thereby reducing the amount of genetic variation within the population);<br />
E is the amount of variation in the trait due to the influence of the environment (e.g., warmer conditions<br />
typically induce earlier flowering), and;<br />
GxE is the variation introduced by interactions between genetic and environmental factors (e.g.,<br />
some genotypes [individuals] in the population are more sensitive to warm temperatures than<br />
other genotypes).<br />
22<br />
<strong>The</strong> scientists who established the International Phenological Gardens (IPGs) used this knowledge to their<br />
advantage. By planting genetically identical clones of several tree and shrub species in different regions<br />
across Europe, they eliminated all genetic variation among gardens. Based on the above equation, then, all<br />
observed variation between gardens in their phenological patterns must be due to environmental factors<br />
(E). This experimental approach is used often today by evolutionary ecologists and ecological geneticists<br />
who are interested in understanding the relative influences of genetic vs. environmental factors on ecological<br />
interactions (such as plant-pollinator and predator-prey interactions).
more aware of nature and of the manifestations of climate change. <strong>The</strong> European <strong>Phenology</strong> <strong>Network</strong>, Nature’s<br />
Calendar in Britain, Natuurkalender in Holland, and NatureWatch in Canada have each had great success in recruiting<br />
the public to report the timing of phenophases. <strong>The</strong> data are synthesized by scientists and results are<br />
reported in a variety of ways on the networks’ websites. Recent efforts in the United States have led to the development<br />
of a nationwide phenology network that invites participation from professional and citizen scientists.<br />
A BRIEF HISTORY OF PHENOLOGY IN THE UNITED STATES<br />
A few attempts were made in the early 20th century to initiate coordinated<br />
phenological measurements in parts of the United States,<br />
but it wasn’t until the mid-20th century that the concept took root.<br />
In the 1950’s, motivated by the notion that the simultaneous monitoring<br />
of a widespread species could be used as an indicator for<br />
the progression of the agricultural growing season, Montana State<br />
University agricultural climatologist Dr. Joe M. Caprio started what<br />
would eventually become the nation’s phenological legacy. Caprio<br />
sought observers across the Western US who would report to him<br />
the local timing of leafing and flowering of the Common Lilac, Syringa<br />
vulgaris. By 1957 he had recruited over 2500 volunteers in<br />
12 western states, and within a decade he added two honeysuckle<br />
cultivars (Lonicera tatarica ‘Arnold Red’ and L. korolkowii ‘Zabeli’) to<br />
the observation program. Observations in this western US network<br />
continued through 1994 at which time Caprio retired and many of<br />
the observers dropped out as they aged and died, underscoring the<br />
fact that a phenological network is a living system that must be repopulated<br />
each generation to ensure its longevity.<br />
Figure 6. Locations in North America<br />
with five years or more of lilac phenology<br />
data, 1956-2001 (Québec stations not included).<br />
From Schwartz 2003.<br />
INTRODUCTION<br />
Caprio’s early success motivated two other researchers to initiate regional phenology networks in Nebraska (W.L.<br />
Colville, University of Nebraska) and in the Northeast (R. Hopp, University of Vermont) in the 1960’s. Using the<br />
same approach as the International Phenological Gardens in Europe, these two networks recorded observations<br />
for a cloned cultivar of lilac, Syringa chinensis (‘Red Rothomagensis’) at about 300 sites. <strong>The</strong>y also collected data<br />
on the aforementioned honeysuckle cultivars. Administration of these two networks was juggled for a couple of<br />
decades until funding was ultimately lost in 1986, after which University of Wisconsin-Milwaukee climatologist<br />
and geography professor Dr. Mark D. Schwartz contacted their volunteer networks to manage the remaining<br />
monitoring activities.<br />
<strong>The</strong> data from the lilac and honeysuckle phenology networks have proven useful on many counts. Schwartz has<br />
developed sophisticated computer models capable of predicting the onset of spring across the United States<br />
from a combination of phenological and climatological data. <strong>The</strong> phenological data have also helped to dem-<br />
Figure 7. Phenological progression for the common Lilac, Syringa vulgaris. Leaf budburst (left) occurs<br />
early in the spring, the first flowers open about one month later (middle), and full flowering<br />
occurs a few weeks later (right). Photos courtesy Mark Schwartz and the <strong>USA</strong> NPN.<br />
23
onstrate that spring in North America is arriving earlier than in the past, and Schwartz has estimated that the<br />
onset of spring is advancing by 1.2 days per decade across the Northern Hemisphere. <strong>The</strong>re is even preliminary<br />
evidence that phenological schedules are, in some regions in the western U.S., strongly correlated with the size<br />
and frequency of wildfires during the subsequent “fire season.”<br />
Schwartz and others have recently leveraged this phenological legacy in the U.S. to rally scientific and<br />
public interest around a national-level phenology network. <strong>The</strong> <strong>USA</strong> <strong>National</strong> <strong>Phenology</strong> <strong>Network</strong><br />
(<strong>USA</strong>-NPN: http://www.usanpn.org) is currently being designed and organized to engage federal agencies, environmental<br />
networks and field stations, educational institutions, and mass participation by citizen scientists. It<br />
is a nationwide collaboration among professional and citizen scientists designed to track the progression of the<br />
seasons, and to relate the timing and duration of phenological events to climate change, the onset and intensity<br />
of allergies, the appearance of agricultural and residential pests, the availability of natural resources such as pollinators<br />
and seed-dispersing animals, and the spread of vector-borne diseases.<br />
Many cultures throughout history have used flowering times as cues for hunting and cultural activities. In<br />
the Pacific Northwest, the many nations comprising the Nuu-Chah-Nulth of western Vancouver Island have<br />
looked to the ripening of salmonberries (Rubus spectabilis) to alert them that anadromous sockeye salmon<br />
(those that migrate from saltwater to freshwater) are abundant in nearby streams. <strong>The</strong> Blackfoot of Alberta<br />
would time their annual mid-summer tribal ceremony to the ripening of Saskatoon berries (Amelanchier<br />
alnifolia), and reportedly would time their spring hunt for bison bulls to the flowering time of the Buffalo<br />
Bean plant (<strong>The</strong>rmopsis rhombifolia).<br />
THE <strong>USA</strong> NATIONAL PHENOLOGY NETWORK (NPN)<br />
<strong>The</strong> vision of the <strong>USA</strong> NPN is to integrate available data from existing infrastructures (e.g., NASA’s satellite imagery,<br />
<strong>National</strong> Weather Service Co-Op stations, <strong>National</strong> Park Service’s annual inventories, and AmeriFlux’s<br />
biogeochemical monitoring stations), while engaging citizen scientists across the country to monitor local organisms.<br />
<strong>The</strong> component of the NPN that is actively working to inform the American public and solicit their help is<br />
the Education, Citizen Science, & Outreach working group (ECSO).<br />
<strong>The</strong> Education, Citizen Science & Outreach (ECSO) working group of the NPN<br />
In the global campaign to reduce the factors that promote global warming, there are many organizations that<br />
provide citizens with opportunities to donate money or time with the goal of reducing energy use and greenhouse<br />
gas emissions through education and outreach. <strong>The</strong>re are only a few organizations, however, that invite<br />
citizens to contribute their time and energy toward scientific monitoring and the detection of local climaterelated<br />
patterns. <strong>The</strong> ECSO working group of the NPN operates with the understanding that phenology, and the<br />
ability to measure and to record its progress over the seasons, is accessible to everyone in the country. <strong>The</strong> primary<br />
goal of ECSO programs is to bring together professional and citizen scientists, students, stewards of public<br />
and private lands, and outdoor enthusiasts to compile basic information on phenological responses to climate<br />
change; to study its nature, pace and its effects on ecosystem function; and to understand synchrony and ecological<br />
interactions among species.<br />
24
<strong>The</strong> NPN’s ECSO working group has designed a range of programs and products through which the public and<br />
scientific professionals can observe and interpret the phenological world on an unprecedented scale. Each program<br />
is designed to achieve one or more of the following objectives:<br />
• To engage the public in long-term phenological data collection and analysis through both formal<br />
and informal science education programs;<br />
• To engender self-directed, voluntary learning using inquiry-based approaches;<br />
• To engage currently active land stewards, networks, and master naturalist programs in the collection<br />
and contribution of phenological data to the NPN;<br />
• To provide training in the tools and applications of phenological studies to citizens and to scientists<br />
at all stages in their careers;<br />
• To enhance opportunities for the public to interact with professional scientists;<br />
• To promote novel tool development and collaboration among scientists representing historically<br />
distinct disciplines (e.g., climatology, hydrology, remote-sensing, engineering, ecology, population<br />
biology, and evolutionary ecology).<br />
INTRODUCTION<br />
PROJECT BUDBURST – THE NPN’S FIELD CAMPAIGN FOR CITIZEN SCIENTISTS<br />
This on-line educational and data-entry program is ECSO’s flagship nationwide program for the public<br />
(http://www.budburst.org). <strong>The</strong> site went live on April 1, 2007, targeting students, nature enthusiasts,<br />
and their families. <strong>The</strong> site provides: information on the history and ecological significance of phenology;<br />
its link to climate change; materials for teachers and students; and an easy-to-use online utility for<br />
uploading botanical phenological data obtained in backyards, botanic gardens, nature preserves, and the<br />
wild. For the 2007 implementation of Project Budburst, 60 widespread and easily identifiable wild and<br />
cultivated species were targeted for observations throughout the U.S. Conveniently, the data management<br />
system allows users to enter phenological observations (including the dates of budburst, full leafout,<br />
first flower, peak flowering, and completion of flowering) for any species. By the end of the first field<br />
season for Project Budburst (June 2007) almost 1000 phenological observations were submitted from all<br />
over the country. 2008 yielded nearly 5000 observations, and the 2009 season of Project Budburst has<br />
attracted the widest audience of citizen scientist participants yet, including over 8500 observations as of<br />
August 1. Project Budburst participants are now able to establish a user account at www.budburst.org,<br />
where they can upload as well as manage their data throughout the season.<br />
Visit www.budburst.org today!<br />
25
<strong>The</strong> <strong>USA</strong>-<strong>National</strong> <strong>Phenology</strong> <strong>Network</strong><br />
<strong>The</strong> <strong>USA</strong>-NPN is being designed as a nationwide network that oversees regularly repeated phenological<br />
observations that are linked to local and national climatological and hydrological data, as well as to imagery<br />
or data obtained through remote sensing. <strong>The</strong>se data, in turn, will be available for analysis using a<br />
variety of quantitative and geographic tools. <strong>The</strong> first objective of the <strong>USA</strong>- NPN is to establish a functional<br />
phenological monitoring network of stations distributed throughout the United States. Organizations<br />
such as biological field stations, agricultural extension stations, and <strong>National</strong> Parks, which already include<br />
biological monitoring as part of their current mission or ongoing activities, are particularly valuable institutional<br />
partners, as are schools and universities engaged in planting and monitoring local phenological<br />
gardens. Only with widespread engagement of the public, however, will the NPN be able to realize the<br />
kind of data-collecting power that will enable it to detect the species, communities, and biomes that are<br />
most sensitive to environmental change.<br />
<strong>The</strong> <strong>USA</strong>-<strong>National</strong> <strong>Phenology</strong> <strong>Network</strong> will consist of four tiers representing varying levels of sampling intensity.<br />
<strong>The</strong> first tier (top of the pyramid) comprises the most intensively monitored sites, where multiple<br />
environmental parameters are already being recorded. <strong>The</strong> second tier represents existing networks of<br />
people and/or instruments, such as weather stations, national parks, national forests, and wildlife refuges.<br />
<strong>The</strong> third, even broader, tier includes members of the public and formal and informal educational groups.<br />
For example, Project Budburst, a national campaign to engage the public in phenological monitoring, was<br />
successfully launched in 2007 and expanded in 2008. At the base of the observation pyramid are remotely<br />
sensed data, which can provide wall-to-wall coverage of observations across the landscape. Finally, focused<br />
phenology networks with local to regional objectives are also being developed with the support and<br />
guidance of the <strong>National</strong> Coordinating Office of the <strong>USA</strong>-NPN, which was established in Tucson, Arizona in<br />
summer 2007 with long-term support from the U.S. Geological Survey and the University of Arizona.<br />
26
THE UCSB PHENOLOGY STEWARDSHIP PROGRAM<br />
At the University of California, Santa Barbara (UCSB), we have designed a program to recruit and to engage<br />
professional and citizen scientists, local families, teachers, nature enthusiasts, and students at all levels in phenological<br />
monitoring and climate change education. <strong>The</strong> UCSB <strong>Phenology</strong> Stewardship Program is a growing<br />
network of observers dedicated to tracking and recording seasonal biological events in the Santa Barbara region.<br />
With funding from UCSB’s Coastal Fund, the <strong>Phenology</strong> Stewardship Program was initiated in the Spring of 2007<br />
by PhD student Brian Haggerty and Professor of Ecology & Evolution Dr. Susan Mazer. Through a combination<br />
of scientific research, environmental education, and dynamic outreach presentations, their mission is to engage<br />
California residents in the collection of phenological data and the reporting of those observations to the <strong>National</strong><br />
<strong>Phenology</strong> <strong>Network</strong> and Project Budburst online databases.<br />
<strong>The</strong> UCSB <strong>Phenology</strong> Stewardship Program provides internships for undergraduates in scientific research, environmental<br />
education, graphic design, and ecological mapping. <strong>The</strong> Program also provides training and teaching<br />
materials for K-12 teachers and informal science educators (e.g., botanic garden docents, interpretation coordinators,<br />
education specialists) to bring phenological observation and its interpretation into the classroom and<br />
outdoor schoolyard or phenology garden. Activities also include the use of the herbarium at UCSB’s Cheadle<br />
Center for Biodiversity and Ecological Restoration to demonstrate the usefulness of herbarium records for reconstructing<br />
historical flowering times and its relationship to climate, elevation, latitude, and habitat.<br />
UCSB’s Coal Oil Point Natural Reserve (COPNR) is the local site for phenological research, training, and outreach.<br />
Here, a series of <strong>Phenology</strong> Trails have been established that are tracked by undergraduate “<strong>Phenology</strong><br />
Stewards” (research interns) who collect flowering data from 21 plant species along with the migration and residence<br />
times of shorebirds and passerines.<br />
INTRODUCTION<br />
Figure 8. Images of UC Santa Barbara’s Coal Oil Point Natural Reserve. On the left is a satellite image (from Google Earth)<br />
of a portion of the reserve; red lines mark the <strong>Phenology</strong> Trails that have been established in three habitats including<br />
foredune, backdune, and coastal bluff/scrub. <strong>The</strong> body of water in the upper-left corner is a portion of Devereaux Lagoon,<br />
where avian phenological surveys are conducted. On the right is a photograph (May 2007; courtesy Matt Wilson) of the<br />
backdune at Coal Oil Point. With the Pacific Ocean as a backdrop, flowering phenology of 21 plant species is monitored<br />
by <strong>Phenology</strong> Stewards (including the purple-flowered Beach Sand Verbena, Abronia umbellata, and the yellow-flowered<br />
California Poppy, Eschscholzia californica. Note the location of Santa Barbara (red dot) on the inset map of California.<br />
27
PROTOCOLS FOR PHENOLOGICAL MONITORING<br />
INTRODUCTION<br />
All phenological studies share one simple goal: to obtain precise dates of key life cycle events. <strong>The</strong>re is, however,<br />
substantial variation among species in how they complete a given phenophase and this can complicate the process<br />
of identifying and assigning a date for a given phenophase. Consider the date of first flower — does a plant<br />
reach the phase of “first flower” when the petals of its first flower begin to become visible as the bud opens, or is<br />
it when the flower is open enough to see the anthers or stigma inside (the correct answer is the latter)? How do<br />
we determine this phenophase for different species whose flowers open in different ways or at different rates?<br />
Furthermore, not all flowers have the same reproductive structures inside, so our definition of first flower must<br />
also accommodate structural differences among species.<br />
As another example, consider the spatial arrangement — or architecture — of the flowers produced by a plant.<br />
Some plants produce a single flower on each flowering stem whereas others produce loose or dense clusters<br />
(called inflorescences) of a few, of dozens, or of hundreds of flowers per stem. Within inflorescences of some<br />
species, the individual flowers may be so small that even a magnifying glass cannot make them clearly visible.<br />
How, then, should we quantify the date of first flower for a plant whose individual flowers we cannot even see!?<br />
<strong>The</strong> answers to these questions, and many more, are provided in this chapter.<br />
<strong>The</strong> goal of this chapter is to provide definitions of phenophases for flowering plants so that observations can be<br />
standardized among observers. Given the tremendous variation in plant architecture among species, we have<br />
made an effort to facilitate the identification and recording of phenological information. First, we have aimed to<br />
minimize the number of definitions and to present them in a manner that is intuitive to all readers, regardless of<br />
their botanical experience. Second, we have identified several classes of plant architecture, each of which has its<br />
own set of protocols for the rapid identification and measurement of its phenophases. Most species of plants<br />
can easily be assigned to one of these architectural classes, so it will be a simple matter for readers to find the<br />
protocol that is most appropriate for the individual plant or species that they are observing.<br />
<strong>The</strong> methods and definitions presented here have been tested by Stewards in the UCSB <strong>Phenology</strong> Stewardship<br />
Program and we’re confident that, with a little practice, even novices will soon be able to identify the phenophases<br />
of most species that they encounter. In this chapter we will consider general points, such as where and<br />
when to observe plant phenology, as well as specific points such as phenophase definitions by which phenologists<br />
can standardize their observations with other phenologists in the Santa Barbara region and across the country.<br />
PLANT PHENOPHASES<br />
Before we address general points about phenological monitoring such as site and plant selection, we will first remind<br />
the reader about plant phenophases. Although there is considerable variation among flowering plant species<br />
with regard to when and how rapidly seasonal events occur, the generalized plant phenological sequence<br />
can be summarized as follows:<br />
• leaf budburst<br />
• first full leaf (first leaf is fully expanded)<br />
• entire plant leaf-out (all leaves on the plant are expanded)<br />
28
• first flower<br />
• peak flowering (largest floral display)<br />
• last flower<br />
• fruit maturity and seed dispersal<br />
• leaf senescence (color change and abcission — the process of losing leaves at the end of the<br />
growing season)<br />
Keep in mind that not all plants exhibit each of these phases, and not all plants complete phases in this order.<br />
Moreover, these phases can overlap substantially within a growing season both within and among individuals.<br />
For example, in contrast to deciduous trees and shrubs, evergreen species do not drop all of their leaves in<br />
the autumn nor do they exhibit the simultaneous production of new leaves in the spring (leaf budburst). Also,<br />
many wind pollinated plants such as birch and alder trees produce flowers before leaf budburst occurs—without<br />
leaves to break up the wind currents, pollen transport is much more efficient. Additionally, fruits often become<br />
fully ripe (and the seeds ready for dispersal) midway through the growing season before leaves have senesced<br />
and often before flowering has stopped. In Santa Barbara, California, where there is less seasonal change in<br />
climate relative to many other regions of the U.S., many species of plants flower for months at a time leading<br />
to overlap between leafing, flowering, and fruiting phenology. Keep this in mind as you continue reading and<br />
thinking about starting your own monitoring efforts.<br />
A FEW CONSIDERATIONS ABOUT PHENOLOGICAL MONITORING<br />
Consistency and accuracy are critical<br />
PROTOCOLS<br />
<strong>The</strong> success of all phenological studies depends on two things: consistent observations, and accurate identifications<br />
of phenophases. Especially in the case of a phenology network where hundreds to thousands of observers<br />
are simultaneously recording the dates of phenophases for the same set of species, consistency is the key. Here<br />
we describe how to best establish and maintain your phenological studies, and later we provide you with the<br />
explicit instructions to accurately ascribe dates to phenophases.<br />
Where To Do Phenological Monitoring<br />
<strong>The</strong> short answer is: anywhere! Nature is all around us all the time, we just have to make a conscious effort to<br />
look. <strong>The</strong> first step is to become familiar with your natural surroundings by exploring the outdoors regularly and<br />
with a keen eye towards week-to-week and day-to-day changes in the abundances and diversity of plants and<br />
animals. Phenological observations can take place in urban, rural, and wild environments; parks and backcountry<br />
trails; schoolyards, backyards, and prison yards; and botanic gardens, zoos, and universities. Even along the roads<br />
and bike paths while commuting to and from work. <strong>The</strong> more you start looking, the more you will notice how nature<br />
is dynamic but far from random. Each year, the sequences in which plant species flower, mammals emerge<br />
from hibernation, insects emerge from dormancy, and birds migrate often occur in repeatable patterns.<br />
<strong>The</strong> more appropriate answer to where to do phenological monitoring is: “It depends”. If your goals are simply<br />
to better acquaint yourself with the seasonality of your region, then anywhere will do—your neighborhood,<br />
outside your office building, or along the roadway or bike path on which you commute to work. If, however, your<br />
goals are to collect accurate phenological data to contribute to the Project Budburst database, then you’ll need<br />
to choose locations based on a few factors, including:<br />
• the convenience of, and access to, the site — make sure that you are not trespassing and that it’s<br />
29
a location that’s easy to visit even when your weeks are hectic or your disposition is lazy;<br />
• the permanence of the habitat — if that open space is slated for development in a couple months,<br />
it’s best to look toward protected areas, parks, botanic gardens, and back and front yards; and<br />
• the influence of human activity — make every effort to minimize this source of variation. If a city<br />
park is manicured to the point that you never see dried stems and fruits, or if shrubs are trimmed<br />
regularly so that leafing and flowering are constantly disrupted, go somewhere else. You may<br />
wish to avoid locations that you know are heavily watered, fertilized, or sprayed with chemicals<br />
because these activities impact phenology (and possibly your own health); at the very least, take<br />
note of these human-directed modifications of your plants’ habitats so that you can include them<br />
when you contribute your observations (you’ll have the opportunity to comment on these factors<br />
when uploading your data to the Project Budburst database).<br />
When To Do Phenological Monitoring<br />
<strong>The</strong> only thing that doesn’t change about the natural world is that it is constantly changing! That means you<br />
can observe phenology during any time of the year. <strong>The</strong> spring and autumn are particularly rewarding periods<br />
because the biosphere changes so quickly, but even in the middle of winter or during the long days of summer<br />
the fine details of plant development can be surprising and fascinating. Currently, the national data base hosted<br />
at the Project Budburst website (www.budburst.org) is focused on spring green-up and flowering, and invites<br />
any careful observer across the U.S. to contribute phenological information from February through June each<br />
year. Consequently, throughout this <strong>Handbook</strong>, we focus on and encourage phenological monitoring of spring<br />
events.<br />
<strong>The</strong> time schedule of a phenological study will depend on a few factors, including how rapidly the weather is<br />
changing, but can be generalized by the following example. Assume you are tracking the phenological status of a<br />
shrub in your backyard and it has dropped all of its leaves for the winter. It will remain dormant and leafless until<br />
it is warm enough to initiate springtime growth.<br />
<strong>The</strong> next phenophase that you’ll likely see is leaf budburst, so as winter beings to progress towards spring, every<br />
Thursday evening after work or school you take a close look at the status of the dormant buds. Just for fun you<br />
even start to measure the length or the circumference of a few buds on that shrub each week (mark them with a<br />
twist tie or string to revisit the same buds). As winter comes to an end and the temperature begins to warm, you<br />
increase the frequency of your observations to twice per week, say, Sunday and Thursday evenings. As spring<br />
approaches and you see the buds start to swell (you’re still measuring them for fun and could even make a nice<br />
graph of their development through time), take a look every day after work until the first bud bursts open on the<br />
plant (don’t forget to record the date!). This observation schedule, where observations increase in frequency<br />
as subsequent phenophases approach, is common to most phenological studies and can be repeated through<br />
the season for successive phenophases such as the full leaf expansion (typically just a day or two after leaf budburst!),<br />
first flower and fruit ripening.<br />
This example demonstrates a few aspects about the consistency of phenological monitoring:<br />
• Consistent observation intervals – With observations scheduled once weekly, then twice weekly,<br />
and then at daily intervals, you are certain to catch the exact date of each phenophase.<br />
• Consistent time of day – This mostly helps to establish a regular schedule within your lifestyle.<br />
Suggestions include: just after breakfast, upon returning from school or work, and before or after<br />
a favorite television or radio program.<br />
This example also illustrates how simple it is to make a more detailed study by tracking not just the date of the<br />
30
phenophase but the rate of development leading up to it. This is particularly fun with flowering phenology. Once<br />
the first flower opens, maintain regular observations at a frequency of one to three times weekly and record<br />
the number of open flowers. Over the course of the flowering season you should see that the floral display, or<br />
the number of open flowers on the plant per survey, increases to a peak and then reamins constant for a while<br />
before beginning to decrease. It is also interesting to keep notes on the diversity and abundance of pollinators<br />
that you observe visiting your plant(s).<br />
In sum, consistent monitoring intervals are critical to ensuring that you catch the precise date that a phenological<br />
event occurs. <strong>The</strong>re are many ways to increase the probability that you’ll maintain a consistent monitoring<br />
effort, and we outline some of these ways in the following section.<br />
Which Plant Species To Monitor<br />
<strong>The</strong>re are over 250,000 species of flowering plants in the world, so how do you choose which plants to monitor?<br />
Here we provide general advice on selecting plant species in your area as well as some specific ideas on which<br />
plants to look for.<br />
General advice for appropriate plant species for phenological monitoring<br />
<strong>The</strong> most general suggestion we can make is start monitoring any plant that you’ve learned to identify and for<br />
which you know the common or the scientific (latin) name! <strong>The</strong> first step is to familiarize yourself with your<br />
natural surroundings and begin to observe day-to-day and week-to-week changes in the appearances of plants.<br />
Choose plants where you spend the majority of your time, typically around your home, school, work place, and<br />
grocery store. Don’t be shy! Get into the habit of recording brief observations about a few plant species each<br />
week—do the leaves look green and healthy or brown and withered? Are there flower buds, open flowers, and/<br />
or developing fruits on the plant? What do they look like? Are there insects that visit or that live on the plants,<br />
and if so, what do they look like and approximately how many are there each week? By taking a few minutes a<br />
few times per week to record your observations (and to compare to your records from weeks past), you’re sure<br />
to develop a keen eye for the pace of plant phenology.<br />
PROTOCOLS<br />
Community-Based Decision<br />
Plant species can be chosen in a number of ways for phenological monitoring. To start, consider this basic question:<br />
What is the native habitat(s) and plant community in your region, and which are the dominant native plant<br />
species? To answer this question you can visit native plant nurseries, botanical gardens, or state parks in your<br />
region and ask staff members or docents to help you to identify native plant species that can be found locally.<br />
You may also take local hikes with a published field guide of your region’s native plants, enroll in a botany or<br />
horticulture class at a community college, or contact your county extension service. <strong>The</strong> immediate Santa Barbara<br />
region is fortunate to include several distinct habitats—coastal dune, coastal sage scrub and wetlands on<br />
the coastal plain (where the majority of people live), and chaparral and riparian (streamside) communities in<br />
the surrounding mountains. It is simple to conduct online searches of these (and other) habitats to discover the<br />
names and appearances of the dominant plants in each of them. You can then head into those habitats for a hike<br />
or a picnic to identify plant species.<br />
<strong>Phenology</strong>-Based Decision<br />
Species of plants can also be chosen for phenological monitoring based on their seasonal phenology. Choose<br />
a couple of species of wildflowers that bloom in the spring, a shrub that flowers in early summer, a shrub that<br />
flowers in late summer, and another herbaceous plant that flowers in the fall. <strong>The</strong>n, during the winter revisit<br />
31
your summer-flowering shrubs to check for dormant leaf buds. By following this scheme, you will become tunedin<br />
to the both the seasonality and the phenology of your region.<br />
Specific Advice For Appropriate Plant Species For Phenological Monitoring<br />
This <strong>Phenology</strong> <strong>Handbook</strong> has been created based on phenological research and monitoring conducted in the<br />
major habitat types in the Santa Barbara region. Most of this research has taken place at UCSB’s Coal Oil Point<br />
Natural Reserve which is characterized by coastal dune and coastal bluff vegetation. Below is a list of 21 species<br />
of plants that the UCSB <strong>Phenology</strong> Stewardship Program has been monitoring at this reserve since spring of<br />
2007. Many of these plants are available (seasonally) for purchase at local nurseries, the Santa Barbara Botanic<br />
Garden, and at plant sales held by local organizations. <strong>The</strong>y can be easily added to residential or workplace landscapes,<br />
facilitating their phenological monitoring. Some of these plant species are also described in detail in the<br />
“Field Guide to Coal Oil Point Natural Reserve” chapter of this <strong>Handbook</strong>.<br />
FAMILY SCIENTIFIC NAME COMMON NAME<br />
Anacardiaceae Toxicodendron diversilobum Poison Oak<br />
Asteraceae Ambrosia chamissonis Beach Bur<br />
Asteraceae Anaphalis margaritaceae Everlasting<br />
Asteraceae Encelia californica California Brittlebrush<br />
Asteraceae Isocoma menziesii Coast Goldenbush<br />
Asteraceae Malacothrix saxatilis Seacliff Daisy<br />
Brassicaceae Cakile maritima Sea Rocket<br />
Caprifoliaceae Sambucus mexicana Elderberry<br />
Chenopodiaceae Atriplex lentiformis Quailbush<br />
Convolvulaceae Calystegia soldanella Beach Morning Glory<br />
Fabaceae Lupinus arboreus Bush Lupine<br />
Hydrophyllaceae Phacelia ramosissima Branching Phacelia<br />
Nyctaginaceae Abronia umbellata Beach Sand Verbena<br />
Onagraceae Camissonia cheiranthifolia Beach Evening Primrose<br />
Onagraceae Epilobium canum California Fuchsia<br />
Onagraceae Oenothera elata Hooker’s Evening Primrose<br />
Papaveraceae Eschscholzia californica California Poppy<br />
Polygonaceae Eriogonum parvifolium Seacliff Buckwheat<br />
Scrophulariaceae Antirrhinum nuttallianum Nuttall’s Snapdragon<br />
Scrophulariaceae Scrophularia californica California Figwort<br />
Solanaceae Solanum douglassii Douglas’s Nightshade<br />
Table 1. List of plant species that have been monitored at Coal Oil Point Natural Reserve (in Santa Barbara,<br />
California) by the UCSB <strong>Phenology</strong> Stewardship Program since Spring of 2007. Two of these species<br />
(in bold) are also on the targeted species list for Project Budburst.<br />
<strong>The</strong>re are also many species of plants on which we are focusing the attention of phenologists across the country<br />
for participation in Project Budburst. <strong>The</strong> full list of targeted plant species is available (and is also broken down<br />
by each state, including California) in the “Participate” section of the Project Budburst website (www.budburst.<br />
org).<br />
32
It’s interesting to visit the species lists of other phenology networks worldwide which invite participation<br />
by citizen scientists. <strong>The</strong>re you will be able to find lists of species that are monitored throughout Europe<br />
and Canada, many of which are also found in the U.S. A particularly rewarding research exercise for teachers<br />
and students (or families with young scientists) is to determine: (1) which plant species monitored in<br />
these other phenology networks are also found in the U.S. and in the students’ region, and (2) how the<br />
phenology of the species found in the students’ region compares with the phenology of the same plant<br />
species monitored by citizen scientists in the other networks.<br />
NatureWatch (Canada): http://www.naturewatch.ca/english/plantwatch/<br />
Nature’s Calendar (UK): http://www.naturescalendar.org.uk/<br />
Natuurkalendar (Netherlands): http://www.natuurkalender.nl/index.asp (Translation via Google)<br />
<strong>The</strong> European <strong>Phenology</strong> <strong>Network</strong>: http://www.dow.wau.nl/msa/epn/index.asp<br />
Accumulating and comparing phenological data<br />
This brings us to an important point about the nature of collecting phenological data. Given that all flowering<br />
plants exhibit at least a few of the above phenophases (first, peak, and last flower), and given that<br />
pollination and fertilization events occur prior to most fruit and seed maturation, it is ideal to track each<br />
individual plant through its entire annual cycle and record the dates of all of its phenophases. This approach,<br />
when repeated for many individuals of the same species, enables us to compare their phenological<br />
progression in different locations or habitats and eventually, across years and decades.<br />
PROTOCOLS<br />
For instance, imagine that you have monitored the flowering duration of the California Poppies in your<br />
home garden (calculated as the number of days between the appearances of the first and last flowers).<br />
Imagine that you have also recorded the first and last flowering dates of 30 additional Poppy plants on a<br />
nearby hiking trail, noting the approximate elevations of each plant. With these simple records, it would<br />
then be possible to ask specific questions about this species, such as:<br />
• Do all California Poppies flower for the same duration, or do early-flowering individuals get a head<br />
start on the season and flower for a longer duration than later-flowering individuals?<br />
• Do individuals growing at low elevations flower earlier and/or longer than high-elevation individuals<br />
found at high elevations?<br />
• Do poppies that may be subject to urban heat-island effects flower earlier than those in natural<br />
habitats?<br />
• Do garden-grown Poppies flower longer than wild Poppies, possibly because environmental factors<br />
such as summer drought or herbivory shorten the flowering period in the wild?<br />
As many species of plants continue to initiate flowering earlier in the season as a phenological response<br />
to climate change, these questions are important to ecologists and agricultural specialists seeking to understand<br />
how plants respond to changes in climate and how they will balance different environmental<br />
pressures.<br />
33
Phenological monitoring is facilitated by first noting two features of all flowering plants:<br />
• Floral architecture or inflorescence type - are flowers clustered in inflorescences, or are they<br />
borne singly?<br />
• Habit - is the plant herbaceous (non-woody) or woody? Is the plant a shrub or a tree?<br />
FLOWERING ARCHITECTURE<br />
Whether a plant produces solitary flowers or inflorescences will change the way that flowering phenophases are<br />
determined and recorded. See the Phenophase Quick-Guide and the list below to examine these effects. Below<br />
are illustrations of the major inflorescence types that you are likely to encounter. Once you identify the inflorescence<br />
type of your targeted species, simply find the appropriate cell in the Quick-Guide to find the quick<br />
definition of each leafing or flowering phenophase.<br />
To help orient you when examining flowers on an unfamiliar plant, the following illustrations show a variety of<br />
floral displays you may encounter. Compare the illustrations to the photos in the “Field Guide to Coal Oil Point<br />
Natural Reserve” in this <strong>Handbook</strong>, and to photos in other field guides, to feel more comfortable in the field.<br />
To help simplify your experiences in the field we have categorized inflorescences by general appearance. Once<br />
you identify the inflorescence type of your targeted species, simply find the appropriate cell in the Phenophase<br />
Quick-Guide to find the quick definition of each leafing or flowering phenophase.<br />
SOLITARY FLOWERS<br />
Solitary flowers are borne singly on stems. <strong>The</strong> California Poppy, Eschscholzia californica,<br />
is an example.<br />
SPIKE-LIKE INFLORESCENCES<br />
Spike<br />
Elongated inflorescence in which flowers are arranged in a linear manner along<br />
the stem and are attached directly to the main stem (pedicels, or stems connecting<br />
flowers to the stem, are absent). Flowering typically begins at the bast of the<br />
spike and progresses upward.<br />
34
Raceme<br />
Elongated inflorescence in which flowers are attached to the main stem by pedicels.<br />
Flowering typically begins at the base of the raceme and progresses upward.<br />
Panicle<br />
Elongated and branching spike-like inflorescence. Each flower is attached to a<br />
branch by a pedicel, and each branch is similar to a small raceme. A panicle is essentially<br />
a compound raceme inflorescence. Flowering variably begins at the base<br />
of the panicle and progresses upward.<br />
UMBEL-LIKE INFLORESCENCES<br />
UMBEL<br />
<strong>The</strong> pedicels of umbelliferous flowers attach to the stem at a common point, like<br />
the struts of an umbrella. Flowering progression is variable but often starts at the<br />
outer edges and progress either concentrically toward the cneter or as a wave<br />
across the umbel.<br />
PROTOCOLS<br />
COMPOUND UMBEL<br />
An umbel of umbels. <strong>The</strong> pedicels of umbelliferous flowers attach at a common<br />
point, and the stems (peduncles) of each umbel is attached at a common point.<br />
<strong>The</strong> progression of flowering is highly variable.<br />
OTHER TYPES OF INFLORESCENCES<br />
CORYMB<br />
Not a true umbel, but often appears as umbel-like and flat-topped in the field.<br />
Actually a raceme where the lowest flowers have elongated pedicels. <strong>The</strong> lowest<br />
flowers on the main stem typically begin flowering first.<br />
HEAD<br />
A dense cluster of small flowers on a head-like stalk. All plants in the Sunflower<br />
family (Asteraceae) produce head inflorescences. Flowering typically begins at<br />
the outer edges of the head (“disk”) and progresses concentrically toward the<br />
center.<br />
35
Scorpioid cyme<br />
Essentially a raceme inflorescence that is coiled. Flowering begins with the lowest<br />
flowers on the stem and progresses upward as the inflorescence uncoils to an erect<br />
spike-like structure. <strong>The</strong> open flowers are typically found at the apex of the coil.<br />
Catkin<br />
Catkins are hanging spikes, typically found on trees.<br />
HABIT<br />
<strong>The</strong> habit of a plant is its characteristic appearance and growth form. Plant habits that are common to the<br />
temperate zone include:<br />
• Herbaceous – A non-woody flowering plant that can be annual, biennial, or perennial; the stems<br />
remain flexible and relatively soft. Examples in the Santa Barbara region include wildflowers such<br />
as Lupine and California Poppy, grasses, and many culinary herbs such as cilantro, parsley, and<br />
basil.<br />
• Forb – herbaceous flowering plants, excluding grasses. Typically used when referring to wildflowers.<br />
We use this term in the Phenophase Quick-Guide.<br />
• Shrub – A woody perennial plant, typically with multiple main stems. Shrubs can be evergreen or<br />
deciduous, and height is commonly 3m. Common<br />
examples in the Santa Barbara area include Eucalyptus, oaks, Sycamore, California Bay, and<br />
pines.<br />
<strong>The</strong> habit of your targeted plant will have a strong effect on how you record its leafing and flowering<br />
phenophases. In forbs, the very first appearance of the phenophase (e.g., first flower or leaf) marks the<br />
onset of a given phenophase, just as you’d expect. In shrubs and trees, however, we must accomodate<br />
their vastly larger size and number of branches. Consequently, the onset of a given phenophase in shrubs<br />
and trees is marked by the appearance of the phenophase in three different locations (branches for leafing<br />
phases, inflorescences for flowering phases) before we record it. Once you identify the habit of your<br />
targeted species, simply find the appropriate cell in the Quick-Guide to find the quick definition of each<br />
leafing or flowering phenophase.<br />
36
PROTOCOLS<br />
A note about fruits<br />
Fortunately, the “rules” of phenological development of fruits are more or less independent of inflorescence<br />
architecture, habit, and developmental pattern. All pollinated flowers develop into seed-containing fruits, given<br />
enough resources and time. <strong>The</strong>re are many kinds of fruits, each of which becomes ready for dispersal in a different<br />
way. For example, berries and other fleshy fruits are removed by animals when ripe; capsules and legumes<br />
split open to release their seeds when dry; and winged fruits, which often are dispersed by wind while still<br />
containing their seeds. Monitoring the timing of fruit maturity or ripening requires that you be able to identify<br />
when the seeds are dispersable, whether by animals or wind or gravity. Hints include noting when fruits appear<br />
to have been removed (or drop to the ground when soft), when fruits change color from unripe (usually green)<br />
to ripe-and-ready (often black, red, orange, or yellow), when capsules split open to reveal the seeds inside, and<br />
when the wind carries fruits (or winged seeds) away from their maternal plant.<br />
37
<strong>USA</strong>-NPN Monitoring System<br />
Phenophase and Phenological Event Definitions<br />
Phenophase: An observable stage or phase in the annual life cycle of a plant or animal that can be defined by<br />
a start and end point. A phenophase generally has a duration of a few days or weeks. Examples include the<br />
period over which newly emerging leaves are visible, or the period over which open flowers are present on a<br />
plant.<br />
Phenological event: A precisely defined point in the annual life cycle of a plant or animal, generally marking<br />
the start or end point of a phenophase. <strong>The</strong> occurrence of a phenological event can be pinpointed to a single<br />
date and time (in theory, if not in practice). Examples include the opening of the first flower on a plant, the<br />
end of leaf fall on a tree, or the first appearance of a particular songbird species in spring.<br />
Note: <strong>The</strong> definitions of the terms “phenophase” and “phenological event” have not yet been standardized and vary among<br />
scientists. <strong>The</strong> definitions presented here reflect our usage of the terms in the <strong>USA</strong>NPN <strong>National</strong> Coordinating Office.<br />
Specific Phenophase Definitions<br />
<strong>The</strong> tables on the following pages list the “phenophase” definitions in use by the <strong>USA</strong>‐NPN Monitoring<br />
System for various plant groups, and define the important “phenological events” that mark the start and end<br />
points of each phenophase. In observation data, these phenological events occur at the transition from an<br />
answer of “No” to “Yes” or “Yes” to “No” for the question “Do you see…?” a given phenophase (Figure 1).<br />
Phenological events defined by the <strong>USA</strong>‐NPN correspond to those defined in the BBCH scale1, a system for a<br />
uniform coding of phenologically similar growth stages of plant species that is commonly used in Europe.<br />
Please visit www.usanpn.org and click Observe! to see species profile pages which include<br />
more specific definitions for some species. Note that definitions are subject to change slightly<br />
for the 2010 monitoring season.<br />
1 Meier, U. (editor). 2001. Growth stages of mono‐ and dicotyledonous plants. BBCH Monograph, 2. Edition. Federal<br />
Biological Research Centre of Agriculture and Forestry. Germany.<br />
A PDF version of the BBCH scale is available here: http://www.bba.de/veroeff/bbch/bbcheng.pdf<br />
38
Table 1a: Deciduous Tree/Shrub with easy-to-see flowers<br />
(mostly insect-pollinated)<br />
Phenophase<br />
Title<br />
(Do you see…?)<br />
Emerging leaves<br />
Unfolded leaves<br />
≥75% of full leaf<br />
size<br />
≥50% of leaves<br />
colored<br />
All leaves colored<br />
≥50% of leaves<br />
fallen<br />
All leaves fallen<br />
Open flowers<br />
Full flowering<br />
Ripe fruits<br />
Phenophase Definition<br />
Leaves<br />
In at least 3 locations on the plant, an<br />
emerging leaf is visible. A leaf is considered<br />
"emerging" once the green tip is visible at the<br />
end of the leaf bud, but before it has fully<br />
unfolded to expose the petiole (leaf stalk) or<br />
leaf base.<br />
In at least 3 locations on the plant, an<br />
unfolded leaf is visible. A leaf is considered<br />
"unfolded" when the petiole (leaf stalk) or leaf<br />
base is visible. <strong>The</strong> leaf may need to be bent<br />
backwards to see whether the petiole or leaf<br />
base is visible.<br />
For the whole plant, the majority of leaves are<br />
unfolded and have elongated to at least threequarters<br />
(75%) of their mature size. Leaf size<br />
may also be estimated by viewing the canopy<br />
as a whole. At 75% of full leaf size, the<br />
canopy appears to be approximately threequarters<br />
(75%) full.<br />
For the whole plant, at least half (50%) of the<br />
leaves (including any that have fallen to the<br />
ground) have changed to their late-season<br />
colors.<br />
For the whole plant, virtually all (95-100%) of<br />
the leaves (including any that have fallen to<br />
the ground) have changed to their late-season<br />
colors, and there is virtually no green left in<br />
the leaves.<br />
For the whole plant, at least half (50%) of the<br />
leaves have fallen.<br />
For the whole plant, virtually all (95-100%) of<br />
the leaves have fallen.<br />
Flowers<br />
In at least 3 locations on the plant, an open<br />
fresh flower is visible. Flowers are considered<br />
"open" when the reproductive parts are visible<br />
between unfolded or open flower parts. Do not<br />
include spent (wilted) flowers that remain on<br />
the plant.<br />
For the whole plant, at least half (50%) of the<br />
flowers are open and still fresh.<br />
Fruits<br />
In at least 3 locations on the plant, a ripe fruit<br />
is visible. (For a more specific description of<br />
this phenophase, please check the plant<br />
species profile online.). Species definitions<br />
for fruit phenophases are still in progress.<br />
Phenophase<br />
Transition<br />
Phenological<br />
Event Title<br />
BBCH<br />
code<br />
Start Leaf budburst 09<br />
End<br />
All leaves<br />
unfolded<br />
19<br />
Start First leaf 11<br />
Start<br />
Start<br />
75% of full leaf<br />
size<br />
50% of leaves<br />
colored<br />
47<br />
92c<br />
Start All leaves colored 92e<br />
Start<br />
50% of leaves<br />
fallen<br />
95<br />
Start All leaves fallen 97<br />
Start First flowers 60<br />
End End of flowering 69<br />
Start<br />
Full flower or Peak<br />
flower<br />
65<br />
Start First fruit ripe 89<br />
39
Table 1b: Deciduous Tree/Shrub with hard-to-see flowers<br />
(mostly wind-pollinated)<br />
Phenophase<br />
Title<br />
(Do you see…?)<br />
Phenophase Definition<br />
Phenophase<br />
Transition<br />
Phenological<br />
Event Title<br />
Same as Table 1a with the following replacing flower phenophases<br />
First pollen<br />
In at least 3 locations on the plant, pollen is Start<br />
released<br />
Pollen release released from an inflorescence when gently<br />
End of pollen<br />
shaken or blown.<br />
End<br />
release<br />
Full pollen<br />
release<br />
For the whole plant, at least half (50%) of the<br />
inflorescences release pollen when gently<br />
shaken or blown.<br />
Start<br />
Full pollen or Peak<br />
pollen<br />
BBCH<br />
code<br />
60<br />
69<br />
65<br />
40
Table 2: Evergreen Broadleaf Tree/Shrub<br />
Phenophase<br />
Title<br />
(Do you see…?)<br />
Emerging leaves<br />
Young unfolded<br />
leaves<br />
Open flowers<br />
Full flowering<br />
Ripe fruits<br />
Phenophase Definition<br />
Leaves<br />
In at least 3 locations on the plant, an<br />
emerging leaf is visible. A leaf is considered<br />
"emerging" once the green tip is visible at the<br />
end of the leaf bud, but before it has fully<br />
unfolded to expose the petiole (leaf stalk) or<br />
leaf base.<br />
In at least 3 locations on the plant, a young<br />
unfolded leaf is visible. A leaf is considered<br />
"young" and "unfolded" once the leaf stalk<br />
(petiole) or leaf base is visible, but before the<br />
leaf has reached full size or turned the darker<br />
green color of mature leaves on the plant. <strong>The</strong><br />
leaf may need to be bent backwards to see<br />
whether the petiole or leaf base is visible.<br />
Flowers<br />
In at least 3 locations on the plant, an open<br />
fresh flower is visible. Flowers are considered<br />
"open" when the reproductive parts are visible<br />
between unfolded or open flower parts. Do not<br />
include spent (wilted) flowers that remain on<br />
the plant.<br />
For the whole plant, at least half (50%) of the<br />
flowers are open and still fresh.<br />
Fruits<br />
In at least 3 locations on the plant, a ripe fruit<br />
is visible. (For a more specific description of<br />
this phenophase, please check the plant<br />
species profile online.). Species definitions<br />
for fruit phenophases are still in progress.<br />
Phenophase<br />
Transition<br />
Phenological<br />
Event Title<br />
BBCH<br />
code<br />
Start Leaf budburst 09<br />
End<br />
All leaves<br />
unfolded<br />
19<br />
Start First leaf 11<br />
Start First flowers 60<br />
End End of flowering 69<br />
Start<br />
Full flower or<br />
Peak flower<br />
65<br />
Start First fruit ripe 89<br />
41
Table 3: Herbaceous plants<br />
Phenophase<br />
Title<br />
(Do you see…?)<br />
Emerging growth<br />
Unfolded leaves<br />
All leaves<br />
withered<br />
Open flowers<br />
Ripe fruits<br />
Phenophase Definition<br />
Leaves<br />
New bright green growth of the plant is visible<br />
above the soil surface, either from<br />
aboveground buds with green tips, or new<br />
green or white shoots breaking through the<br />
soil surface. Growth is considered "emerging"<br />
until the first leaf has fully unfolded from that<br />
bud or shoot.<br />
In at least one location on the plant, a fully<br />
unfolded leaf is visible. For seedlings,<br />
consider only true leaves and do not count the<br />
cotyledons (one or two small, round leaves)<br />
that are found on the stem almost immediately<br />
after the seedling emerges.<br />
Of the leaves that developed this season,<br />
virtually all (95-100%) are dried and dead.<br />
Flowers<br />
In at least one location on the plant, an open<br />
fresh flower is visible. Flowers are considered<br />
"open" when the reproductive parts are visible<br />
between unfolded or open flower parts. Do not<br />
include spent (wilted) flowers that remain on<br />
the plant.<br />
Fruits<br />
In at least one location on the plant, a ripe fruit<br />
is visible. (For a more specific description of<br />
this phenophase, please check the plant<br />
species profile online.). Species definitions<br />
for fruit phenophases are still in progress.<br />
Phenophase<br />
Transition<br />
Start<br />
Phenological<br />
Event Title<br />
Emergence<br />
above ground<br />
BBCH<br />
code<br />
09<br />
Start First leaf 11<br />
Start<br />
All leaves<br />
senesced<br />
97<br />
Start First flowers 60<br />
End End of flowering 69<br />
Start First fruit ripe 89<br />
42
Table 4: Grasses<br />
Phenophase<br />
Title<br />
(Do you see…?)<br />
Emerging growth<br />
Unfolded leaves<br />
All leaves<br />
withered<br />
Open flowers<br />
Ripe seeds<br />
Phenophase Definition<br />
Leaves<br />
New growth of the plant is visible above the<br />
soil surface with the appearance of fresh<br />
green shoots that show no signs of aging. For<br />
each shoot, growth is considered "emerging"<br />
until the first leaf has unfolded.<br />
In at least one location on the plant, an<br />
unfolded leaf is visible. A leaf is considered<br />
"unfolded" when it unrolls slightly from around<br />
the stem and begins to fall away at an angle.<br />
Of the leaves that developed this season,<br />
virtually all (95-100%) are dried and dead.<br />
Flowers<br />
In at least one location on the plant, an open<br />
fresh flower is visible. Flowers are considered<br />
"open" when the reproductive parts are visible<br />
between unfolded or open flower parts. Do not<br />
include spent (wilted) flowers that remain on<br />
the plant.<br />
Fruits<br />
In at least one location on the plant, a ripe<br />
seed is present. A ripe seed is hard when<br />
squeezed and is difficult to divide with a<br />
fingernail. Seeds may also be considered ripe<br />
when they fall into your hand when the plant is<br />
handled.<br />
Phenophase<br />
Transition<br />
Start<br />
Phenological<br />
Event Title<br />
Emergence<br />
above ground<br />
BBCH<br />
code<br />
09<br />
Start First leaf 11<br />
Start<br />
All leaves<br />
senesced<br />
97<br />
Start First flowers 60<br />
End End of flowering 69<br />
Start First fruit ripe 89<br />
43
Phenophase<br />
Title<br />
(Do you see…?)<br />
Flower buds<br />
Open flowers<br />
Ripe fruits<br />
Phenophase Definition<br />
Table 5: Cacti<br />
Flowers<br />
In at least one location on the plant, a flower<br />
bud or unopened flower is visible. A flower is<br />
considered "unopened" up until the point<br />
when reproductive parts are visible between<br />
unfolded or open flower parts.<br />
In at least one location on the plant, an open<br />
fresh flower is visible. Flowers are considered<br />
"open" when the reproductive parts are visible<br />
between unfolded or open flower parts. Do not<br />
include spent (wilted) flowers that remain on<br />
the plant.<br />
Fruits<br />
In at least one location on the plant, a ripe fruit<br />
is visible. (For a more specific description of<br />
this phenophase, please check the plant<br />
species profile online.). Species definitions<br />
for fruit phenophases are still in progress.<br />
Phenophase<br />
Transition<br />
Phenological<br />
Event Title<br />
BBCH<br />
code<br />
Start First flowers 60<br />
End End of flowering 69<br />
Start First fruit ripe 89<br />
44
Phenophase<br />
Title<br />
(Do you see…?)<br />
Emerging needles<br />
Young unfolded<br />
needles<br />
Pollen release<br />
Full pollen<br />
release<br />
Ripe seed cones<br />
Table 6a: Conifers<br />
Phenophase Definition<br />
Needles<br />
In at least 3 locations on the plant, an<br />
emerging needle is visible. A needle is<br />
considered "emerging" once the green tip is<br />
visible at the end of the bud, but before the<br />
needle has unfolded and spread away from<br />
the developing stem.<br />
In at least 3 locations on the plant, a young<br />
unfolded needle is visible. A needle is<br />
considered "young" and "unfolded" once it has<br />
spread away from the developing stem<br />
enough that its point of attachment to the<br />
stem is visible, but before it has reached full<br />
size and turned the darker green color of<br />
mature needles on the plant.<br />
Pollen cones<br />
In at least 3 locations on the plant, pollen is<br />
released from a male cone when it is gently<br />
shaken or blown.<br />
For the whole plant, at least half (50%) of the<br />
male cones release pollen when gently<br />
shaken or blown.<br />
Seed cones<br />
In at least 3 locations on the plant, a ripe seed<br />
cone is visible. (For a more specific<br />
description of this phenophase, please check<br />
the plant species profile online.). Species<br />
definitions for seed cone phenophases are<br />
still in progress.<br />
Phenophase<br />
Transition<br />
Phenological<br />
Event Title<br />
BBCH<br />
code<br />
Start Needle budburst 09<br />
End<br />
All leaves<br />
unfolded<br />
19<br />
Start First needle 11<br />
Start<br />
End<br />
Start<br />
First pollen<br />
released<br />
End of pollen<br />
release<br />
Full pollen or<br />
Peak pollen<br />
60<br />
69<br />
65<br />
Start First cone ripe 89<br />
Phenophase<br />
Title<br />
(Do you see…?)<br />
Emerging needles<br />
Young unfolded<br />
needles<br />
Phenophase Definition<br />
Table 6b: Pines<br />
Phenophase<br />
Transition<br />
Phenological<br />
Event Title<br />
Same as Table 6a with the following replacing needle phenophases<br />
In at least 3 locations on the plant, an<br />
emerging needle or needle bundle is visible. A<br />
needle or needle bundle is considered<br />
"emerging" once the green tip is visible along<br />
the newly developing stem (candle), but<br />
before the needles have begun to unfold and<br />
spread away from others in the bundle.<br />
In at least 3 locations on the plant, a young<br />
unfolded needle is visible. A needle is<br />
considered "young" and "unfolded" once it<br />
begins to spread away from other needles in<br />
the bundle (and is no longer pressed flat<br />
against them), but before it has reached full<br />
size and turned the darker green color of<br />
mature needles on the plant.<br />
BBCH<br />
code<br />
Start Needle budburst 09<br />
End<br />
All leaves<br />
unfolded<br />
19<br />
Start First needle 11<br />
45
Kids In Nature Journal 2008<br />
<strong>Phenology</strong> Activity Guide<br />
Contents<br />
<strong>The</strong> objective of this <strong>Phenology</strong> Activity Guide is to provide materials for the classroom and<br />
field that can help teachers, docents, naturalists and families to focus and to organize their<br />
students’ and their own phenological observations in school gardens, back yards,<br />
neighborhoods, local parks and wild areas.<br />
I. Kids in Nature Journal — Students Observing the Seasons (S.O.S):<br />
<strong>Phenology</strong> and Project Budburst. This is oriented towards upper<br />
elementary school students<br />
II. Advanced Phenological Activity Guide — <strong>The</strong> measurement,<br />
quantification, and comparison of individual and population‐level<br />
phenological phases. This section is designed for groups of middle<br />
school, high school, or introductory college‐level courses that integrate<br />
biological observations with the measurement, synthesis, analysis and<br />
interpretation of quantitative data. <strong>The</strong> Worksheets provided in this<br />
section may be mixed and matched depending on the motivation, goals,<br />
and quantitative skills of the instructor and the students<br />
III. <strong>Phenology</strong> guide for teachers – This guide was designed as a<br />
companion to the S.O.S. chapter of the Kids In Nauture Journal (pgs. 54‐<br />
63), but it can be used by educators at all levels to enhance their life<br />
sciences curricula and in‐class discussions.<br />
47 ‐ 56<br />
57 ‐ 70<br />
71 ‐ 76<br />
UCSB phenology stewards<br />
recording flowering times of<br />
native plants at Coal Oil Point<br />
Natural Reserve.<br />
46
Kids In Nature Journal 2008<br />
Students Observing the Seasons (S.O.S):<br />
<strong>Phenology</strong> and Project Budburst<br />
INTRODUCTION<br />
This section of the <strong>Phenology</strong> Activity Guide is also being integrated into a year‐round natural<br />
history journal developed for fifth grade classes in Santa Barbara County, California. <strong>The</strong><br />
journal is one component of the Kids In Nature (KIN) program developed by UCSB’s Cheadle<br />
Center for Biodiversity and Ecological Restoration (CCBER), which houses UCSB’s herbarium and<br />
zoological collections.<br />
Kids in Nature (KIN) was founded in 2001 by CCBER Director Dr. Jennifer Thorsch with funding<br />
from UCSB’s Faculty Outreach Grants Initiative (FOG). <strong>The</strong> focus of KIN is to enrich the learning<br />
experiences of underrepresented and underserved upper elementary students in our<br />
community through an environmental program that promotes the importance of preserving<br />
our ecosystems. KIN combines place‐based, hands‐on inquiry activities with interactive<br />
computer simulations and field trips. This highly regarded educational outreach program has<br />
served over 1200 students in the past seven years. It was formed through a partnership with<br />
the Sedgwick Reserve and the Cheadle Center for Biodiversity and Ecological Restoration<br />
(CCBER) at the University of California, Santa Barbara (UCSB).<br />
<strong>The</strong> Kids in Nature program received the 2007 Governor’s Environmental and Economic<br />
Leadership Award in the category of Children’s Environmental Education. This award is<br />
California’s highest and most prestigious environmental honor. It recognizes those individuals,<br />
organizations and businesses that have demonstrated exceptional leadership in conserving<br />
California’s resources, protecting and enhancing the environment, and building public‐private<br />
partnerships. To learn more about the award, please visit<br />
http://www.calepa.ca.gov/Awards/GEELA/default.htm.<br />
In fall of 2007, KIN and UCSB’s <strong>Phenology</strong> Stewardship Program entered a partnership to create<br />
a citizen science network of 5 th grade students and their teachers to contribute data to the<br />
<strong>National</strong> <strong>Phenology</strong> <strong>Network</strong> (NPN) using the Project Budburst website and protocols. <strong>The</strong> KIN<br />
students planted a native garden with key indicator species on their campuses. <strong>The</strong>y will<br />
observe the plants, record the phenological changes (bud burst, flowering, and seed dispersal),<br />
and report their observations to the Project Budburst website. Students will also compare their<br />
data with the CCBER herbarium collections during their visits to UCSB. When they complete the<br />
portion of the KIN journal that we’ve prepared, the students will become Certified Junior<br />
Phenologists!<br />
Special thanks to Dr. LeeAnn Kryder of UCSB, editor of the Kids In Nature journal, for providing<br />
comments on this S.O.S. chapter.<br />
47
Kids In Nature Journal 2008<br />
Students Observing the Seasons (S.O.S):<br />
<strong>Phenology</strong> and Project Budburst<br />
How do you know when the seasons are changing in Santa Barbara? Is there a change in the<br />
temperature, the amount of rain, or the length of the day? Have you ever waited for a special<br />
flower to bloom in the spring, or have you waited for fruits such as strawberries and peaches to<br />
ripen during the summer? In what season do you get the best corn and tomatoes that have<br />
been locally grown in Goleta or Santa Barbara (perhaps even in your own family’s garden)?<br />
<strong>Phenology</strong> (pronounced “fee‐nol‐o‐gee”) is the science of the<br />
seasons – it is the study of the timing of seasonal events such as<br />
animal migrations, plant flowering times, and the harvesting of ripe<br />
fruits and vegetables. In Santa Barbara, for example, the arrival of<br />
spring is accompanied by California Poppy blooms and the<br />
northbound gray whale migration. A person who studies when and<br />
how plants and animals respond to seasonal changes in the<br />
environment is called a phenologist (pronounced “fee‐nol‐o‐gist”).<br />
Scientists at UCSB who are phenologists need your help observing the seasons by studying<br />
plants in your school garden. <strong>The</strong>y’ve started a science training program called the UCSB<br />
<strong>Phenology</strong> Stewardship Program and they’ve selected you and your KIN classmates for training<br />
as Junior Phenologists!<br />
Focus Questions<br />
What resources does a plant need to grow?<br />
Do insects, birds, and other animals need the same resources to grow? How do they differ?<br />
Do you think that the resources that plants and animals need are available in constant supply<br />
year‐round? If they aren’t, what effects do you think this has on their ability to grow? Which<br />
resources are most abundant during the summer months? Which are most available during the<br />
winter months?<br />
Can you think of other phenological events in Santa Barbara or in the ocean nearby that signal<br />
the changing of the seasons?<br />
Challenge Words<br />
<strong>Phenology</strong><br />
Stewardship<br />
Herb<br />
Photosynthesis<br />
48
Kids In Nature Journal 2008<br />
Phenological traits (botanical events that you will observe and record<br />
for Project Budburst)<br />
Budburst/First Leaf: Budburst occurs when a plant produces its first open leaves. To record a<br />
plant’s budburst date, you will report the date at which the first leaf of the new growing<br />
season is completely unfolded.<br />
When you observe trees or large shrubs, you will need to make sure that there are at least<br />
three places on the tree or shrub where budburst has occurred. <strong>The</strong> leaves need to be fully<br />
open (or expanded) and the leaf stem or leaf base must be visible (you might need to bend the<br />
new leaf backwards in order to see those). This might have already happened for many of the<br />
plants in your school garden.<br />
Full Leaf: Report the date when nearly all of the leaves (at least 95%) have reached the<br />
completely unfolded stage described above (Budburst/First Leaf). This might have already<br />
happened for many of the plants in your school garden.<br />
First Flower: Report the date at which the first flower is completely open. You must be able to<br />
see the reproductive structures inside the flower, such as the stigma, style, anthers, and ovary.<br />
For trees or large shrubs you will want to make sure that there are open flowers on at least<br />
three places on the tree or shrub.<br />
End Flower: Report the date when nearly all of the flowers (at least 95%) have opened,<br />
withered, dried up, or died. When the plant has finished flowering, you’ll also notice that there<br />
are no remaining flower buds (or, if there are, they may never open).<br />
Seed or Fruit Dispersal: Report the date when you notice the first fruit is either splitting open<br />
to release its seeds (soft, ripe, and ready to attract birds or mammals who would want to eat it)<br />
or dropping naturally from the plant.<br />
Flower bud... almost there… first flower!... full bloom… mature fruit.<br />
Phenological progression of a native sunflower, the California Sunflower (Encelia californica).<br />
Look for this plant in your school’s native plant garden!<br />
49
Kids In Nature Journal 2008<br />
<strong>Phenology</strong> activities in the native plant garden, Part I.<br />
Date:______________________________<br />
Time of day:________________________<br />
Location:___________________________<br />
Latitude:_____________ Longitude:________________<br />
Plant name: ___________________________<br />
Appearance of the plant (use centimeters for all measurements):<br />
Vegetative structures:<br />
a. Do you see leaf buds at the tip of stems or as bulges on the sides of stems?<br />
b. If you do see leaf buds, measure the length of three of them (in centimeters) and<br />
record here:<br />
c. Do you see leaves?<br />
d. If you do see leaves, measure the length of three of them (in centimeters) and<br />
record here:<br />
e. Are all of the leaves the same size?<br />
f. If not, what are the lengths of the smallest leaf and the biggest leaf that you see?<br />
g. For this plant, what do you think is the size of a “fully grown” leaf?<br />
50
Kids In Nature Journal 2008<br />
Reproductive structures:<br />
a. Do you see flower buds?<br />
b. If you do see flower buds, count the total number of flower buds and record here:<br />
Note: if there are too many flower buds to count (>50), on the whole<br />
plant, then you may count the total number of buds on one branch.<br />
c. If you do see flower buds, measure the length of three buds and record here:<br />
d. Do you see open flowers?<br />
e. If you do see open flowers, count the total number and record here:<br />
Note: if there are too many flowers to count (>50), then<br />
estimate the total number.<br />
f. If you do see open flowers, measure the width of three flowers (across the widest<br />
portion) and record here:<br />
g. Do you see fruits?<br />
h. If you do see fruits, count the total number and record here:<br />
Note: if there are too many fruits to count (>50), then estimate the total number<br />
i. If you do see fruits, measure the length of three fruits and record here:<br />
Draw a picture of your plant as you see it today<br />
51
Plant’s environment:<br />
Kids In Nature Journal 2008<br />
Soil<br />
Describe the soil surrounding the plant. Is it dry or moist? What is the color of the soil?<br />
Is it clay‐like or sandy? Is it dark brown?<br />
Can you see small bits of plant parts in it, or are the particles all tiny?<br />
Insects<br />
Do you see any insects on the plant (look closely, many<br />
insects are very small!)? If so, where are they and what<br />
do they look like (size, color, shape)?<br />
What are the insects doing (eating, resting)? Draw the insects below.<br />
Surrounding plants<br />
Take a look at the plants that are growing outside the native plant garden – find two<br />
trees and describe them briefly. Be sure to include notes on whether they have leaves,<br />
buds, flowers, and/or fruits.<br />
Physical environment<br />
Is the temperature hot, warm, cool, or cold?<br />
Has it rained recently?<br />
How do you think the recent weather patterns have affected the phenology and<br />
appearance of your plant?<br />
52
Kids In Nature Journal 2008Kids In Nature Journal 2008<br />
<strong>Phenology</strong> activities in the native plant garden, Part II.<br />
Name of your plant: _______________________________<br />
Autumn Winter Spring Summer<br />
(KIN graduation)<br />
Structure you measured<br />
Date:____________<br />
Size (cm) or number<br />
Date:____________<br />
Size (cm) or number<br />
Date:____________<br />
Size (cm) or number<br />
Date:____________<br />
Size (cm) or number<br />
Vegetation<br />
Plant height<br />
Plant width<br />
Length of largest leaf<br />
Reproduction<br />
Number of flower buds<br />
Number of open flowers<br />
Number of fruits<br />
California Poppy, Eschscholzia californica<br />
Illustration by UCSB <strong>Phenology</strong> Steward Megan van den Bergh<br />
53
Kids In Nature Journal 2008<br />
Table for recording phenophases for entry to Project Budburst.<br />
Fill out this observation form for each plant you observe.<br />
Plant name:_____________________<br />
Phenophase<br />
Budburst/First leaf<br />
Full leaf<br />
First flower<br />
End flower<br />
Fruit/Seed dispersal<br />
Date<br />
Latitude of your location<br />
Longitude of your location<br />
Elderberry, Sambucus mexicana<br />
Illustration by UCSB <strong>Phenology</strong> Steward Megan van den Bergh<br />
54
Kids In Nature Journal 2008<br />
Things to write about…<br />
You are working as a junior scientist – a phenologist! Did you enjoy making careful observations<br />
across the seasons and writing them down? How did your plant change and how did the<br />
environment change from the autumn to the spring?<br />
At the end of your observations and journal entries, you will report your phenology data to the<br />
Project Budburst website. Many other junior phenologists, teachers, and families from across<br />
the United States will be reporting their phenological observations to Project Budburst. All of<br />
this information will be combined to help scientists understand how climate change is affecting<br />
the timing of seasonal events. How do you feel about being a part of this important scientific<br />
work?<br />
What was the hardest part about this work? What did you like the most?<br />
Would you like to continue this type of work in your school<br />
next year, or in your backyard with your family?<br />
How do you think that your observations and measurements might have differed if the weather<br />
was warmer or if your garden’s plants received more rain? If the plants in your school’s garden<br />
are watered, do you think that the plants would produce more or fewer flowers and leaves than<br />
if they only received natural rainfall? How do you think your measurements might have differed<br />
if the weather were cooler?<br />
55
Kids In Nature Journal 2008<br />
Botanical Basics<br />
Botany is the study of plants. It includes how and why plants grow, how they reproduce, and<br />
the communities in which they grow. Plants are producers (they create their own food).<br />
<strong>The</strong>re are four things you would need:<br />
1. Sunlight<br />
2. Water<br />
3. Carbon dioxide<br />
4. Soil<br />
Sunlight<br />
Plants absorb sunlight through their leaves. Leaves have a<br />
green chemical called chlorophyll that absorbs sunlight.<br />
Chlorophyll changes energy from sunlight into food energy<br />
for the plant.<br />
Sea cliff daisy (Malacothrix<br />
saxatilis) and a fly pollinator at<br />
Coal Oil Point Natural Reserve<br />
Water<br />
Plants take up water from the soil and transport it through their roots. Water travels from the<br />
roots to the stem and then upward to the leaves.<br />
Carbon Dioxide<br />
Carbon dioxide is a natural gas that you create when you breathe. Take a deep breath. You are<br />
breathing in oxygen. Now, breathe out. You are exhaling carbon dioxide. Plants use the<br />
carbon dioxide that you exhale to help make their food.<br />
Soil<br />
Soil covers much of the land. It is made up of minerals (rocks, sand, clay, silt), air, water and<br />
organic (plant & animal) material. Soil forms slowly as rock (parent material) erodes into tiny<br />
pieces and organic matter decays.<br />
How do plants make food using sunlight, water, soil and carbon dioxide? Plants use the energy<br />
in sunlight to change water and carbon dioxide into sugar. <strong>The</strong> sugar is food for plants and<br />
gives plants energy to grow. <strong>The</strong> process plants use to make food using sunlight, water, soil and<br />
carbon dioxide is called photosynthesis.<br />
56
Advanced Phenological Activity Guide<br />
Phenological Activities Guide for Middle, High School,<br />
and Introductory College‐level Biology students<br />
<strong>The</strong> worksheets below can be used in the field (remember to bring clipboards), school yards, or<br />
classrooms to record, to compare, and to interpret with your students phenological<br />
observations that are directly observed on living plants.<br />
<strong>The</strong> successive worksheets shown here provide templates for collecting, comparing, and<br />
manipulating data with different degrees of sophistication, ranging from the sixth grade to the<br />
undergraduate levels. So, instructors will need to look them over and imagine filling them out<br />
with their students before distributing them.<br />
<strong>The</strong>se worksheets may be copied and used in the classroom, but they are also designed for<br />
advanced students who can use them as templates for Excel spreadsheets that can be used to<br />
archive and to analyze repeated, quantitative phenological observations within and among<br />
individual plants and species.<br />
<strong>The</strong>se worksheets were designed to show that there is a wide range of mathematical,<br />
statistical, and geographical concepts that can be illustrated with phenological observations. In<br />
particular, the worksheets can be used to show rapidly and clearly that there is phenological<br />
variation at different levels of observation.<br />
For example, the simple tables of observations created with these worksheets can be used to<br />
explore the following questions:<br />
When observing different branches on the same plant:<br />
Do different branches on the same plant exhibit different phenophases?<br />
Do branches on the same plant show different rates of phenological progression?<br />
When considering all of the branches observed on the same plant, what is the average number<br />
of days between the date of first flower and the date of peak flowering?<br />
57
Advanced Phenological Activity Guide<br />
When observing individual plants of the same species:<br />
Do different individuals exhibit different phenophases?<br />
Do individuals differ in the rate at which they pass through different phenophases?<br />
How do species differ in their phenophases?<br />
Do all individuals open their first flowers on the same day?<br />
Do all individuals show peak flowering (the day when the greatest number of flowers are open)<br />
on the same day?<br />
How rapidly do individuals change over time in the abundances of buds, open flowers and<br />
fruits?<br />
When considering all of the individuals observed of the same species, what is the average<br />
number of days between the date of first flower and the date of peak flowering?<br />
When comparing different species:<br />
What is the first species to begin to flower and what is the first species to reach peak flowering?<br />
Are they the same species?<br />
Do species differ in the date of first flower?<br />
Do species differ in the date of peak flowering?<br />
Do species differ more in the date of first flower or in the date of peak flowering?<br />
Which species progresses most rapidly from opening its first flower to peak flowering?<br />
Which species progresses most slowly from opening its first flower to peak flowering?<br />
<strong>The</strong> final few pages of this section show – in more or less cartoon form – a few of the ways in<br />
which the data could be used in math/science curricula to illustrate ways in which observations<br />
can be synthesized and compared in quantitative ways. <strong>The</strong>re’s plenty of room to add to the<br />
few examples shown here; this is still a work in progress.<br />
California Poppy, Eschscholzia californica<br />
Illustration by UCSB <strong>Phenology</strong> Steward Megan van den Bergh<br />
58
Advanced Phenological Activity Guide<br />
Worksheet 1. This table could be used to compare three branches within individuals, three individuals within a species, and three species all<br />
observed on a single date to illustrate variation among them in their phenological progression. Each species has a numerical code (shown in<br />
the first column) that can be used when using these data to fill Worksheet 3. <strong>The</strong> numbers of buds, open flowers, wilting flowers and<br />
developing fruits is based either on the number of individual buds, flowers or fruits that are observed or on the numbers of clusters of buds,<br />
flowers, and fruits (see Protocols section to decide which is appropriate for the species you’re observing).<br />
Species<br />
Code<br />
Species Name<br />
Individual<br />
Plant ID<br />
(each plant is<br />
given its own<br />
number or<br />
name)<br />
Branch ID<br />
(A, B, C)<br />
(each branch<br />
is given its<br />
own name)<br />
Species 1 1 A<br />
Number of buds<br />
or<br />
the number of<br />
clusters of buds<br />
Number of open<br />
flowers<br />
or<br />
the number of<br />
flower clusters in<br />
flower<br />
Number of wilting<br />
flowers + developing<br />
fruits<br />
or<br />
the number of flower<br />
clusters showing these<br />
stages.<br />
Species 1 1 B<br />
Species 1 1 C<br />
Species 1 2 A<br />
Species 1 2 B<br />
Species 1 2 C<br />
Species 1 3 A<br />
Species 1 3 B<br />
Species 1 3 C<br />
59
Advanced Phenological Activity Guide<br />
Worksheet 1 (continued)<br />
Species<br />
Code<br />
Species Name<br />
Individual<br />
Plant ID<br />
(each plant is<br />
given its own<br />
number or<br />
name)<br />
Branch ID<br />
(A, B, C)<br />
(each branch<br />
is given its<br />
own name)<br />
Species 2 1 A<br />
Number of buds<br />
or<br />
the number of<br />
clusters of buds<br />
Number of open<br />
flowers<br />
or<br />
the number of<br />
flower clusters in<br />
flower<br />
Number of wilting<br />
flowers + developing<br />
fruits<br />
or<br />
the number of flower<br />
clusters showing these<br />
stages.<br />
Species 2 1 B<br />
Species 2 1 C<br />
Species 2 2 A<br />
Species 2 2 B<br />
Species 2 2 C<br />
Species 2 3 A<br />
Species 2 3 B<br />
Species 2 3 C<br />
60
Advanced Phenological Activity Guide<br />
Worksheet 1 (continued)<br />
Species<br />
Code<br />
Species Name<br />
Individual<br />
Plant ID<br />
(each plant is<br />
given its own<br />
number or<br />
name)<br />
Branch ID<br />
(A, B, C)<br />
(each branch<br />
is given its<br />
own name)<br />
Species 3 1 A<br />
Number of buds<br />
or<br />
the number of<br />
clusters of buds<br />
Number of open<br />
flowers<br />
or<br />
the number of<br />
flower clusters in<br />
flower<br />
Number of wilting<br />
flowers + developing<br />
fruits<br />
or<br />
the number of flower<br />
clusters showing these<br />
stages.<br />
Species 3 1 B<br />
Species 3 1 C<br />
Species 3 2 A<br />
Species 3 2 B<br />
Species 3 2 C<br />
Species 3 3 A<br />
Species 3 3 B<br />
Species 3 3 C<br />
61
Advanced Phenological Activity Guide<br />
Worksheet 2: For Math Geeks in high school and college. <strong>The</strong> observations above should be used<br />
to calculate averages (or means) and standard deviations<br />
Sum of values for Species 1<br />
Mean values of Species 1<br />
(Sum/Number of Observations)<br />
Standard Deviation of Species<br />
1<br />
Number of<br />
buds<br />
Number of<br />
open flowers<br />
Number of wilting flowers +<br />
developing fruits<br />
Sum of values for Species 2<br />
Mean values of Species 2<br />
SD of Species 2<br />
Sum of values for Species 3<br />
Mean values of Species 3<br />
SD of Species 3<br />
Instructions for Math Geeks: How to calculate the Mean and the Standard Deviation (SD) of a set of<br />
values.<br />
<strong>The</strong> standard deviation is a commonly used measure of the variation among a set of observations.<br />
<strong>The</strong> “mean” is the word that statisticians use for “average” (Mean = Average)<br />
(1) To obtain the mean, you add all the observed values for a given type of observation (e.g.,<br />
the number of buds) and divide by the number of observations:<br />
For example, if you have 4 observations (called x 1 , x 2 , x 3 , and x 4 )…<br />
Mean = average = (x 1 + x 2 + x 3 + x 4 ) / 4<br />
A general way of referring to each observation is: x i<br />
(2) To calculate the standard deviation, you must first calculate the “variance” among<br />
observations<br />
62
Advanced Phenological Activity Guide<br />
Look at this equation and think about it. What it says is this:<br />
“For each observation, we’re going to ask how much it deviates from the average value of all<br />
the observations.<br />
<strong>The</strong>n, we’re going to square this deviation so that we always come up with a positive number<br />
(a number > 0) to express the size of the deviation. In other words, because we’re interested<br />
in the magnitude of the variation, it doesn’t matter whether a given value is greater than the<br />
mean (generating a positive “deviation”) or less than the mean (generating a negative<br />
“deviation).<br />
<strong>The</strong>n, we’re going to add up all of these ‘squared deviations’. That’s the number that appears<br />
in the numerator of this fraction.<br />
After we calculate the number in the numerator, we divide it by the number of observations<br />
(minus one) to arrive at the ‘average’ of the squared deviations.”<br />
Not so difficult…<br />
x i is the observed value of each individual or branch (the unit of observation for a given<br />
species)<br />
x is the mean value of all observations<br />
n is the number of observations used to calculate the mean<br />
(3) <strong>The</strong> standard deviation is simply the square root of the variance.<br />
63
Advanced Phenological Activity Guide<br />
Worksheet 3. Phenological Biodiversity. Here we compare species with respect to the proportions of “observed flowering units”<br />
that are buds, flowers, or past‐flowering. First, use Worksheet 2 to fill cells with the sums of all buds, flowers, and fruits observed<br />
on all branches and individuals. <strong>The</strong>n, calculate the proportions and compare them among species.<br />
Species<br />
Total<br />
Number of<br />
buds<br />
or<br />
the total<br />
number of<br />
clusters of<br />
buds on all<br />
monitored<br />
branches<br />
Total Number<br />
of open flowers<br />
or<br />
the total<br />
number of<br />
flower clusters<br />
in flower<br />
on all<br />
monitored<br />
branches<br />
Total Number of<br />
wilted flowers<br />
and developing<br />
fruits<br />
or<br />
the total number<br />
of flower clusters<br />
with wilting<br />
flowers and<br />
developing fruits<br />
Total number<br />
of buds +<br />
open flowers<br />
+ fruits<br />
(A+B+C=D)<br />
% or proportion<br />
of buds<br />
A/D<br />
% or<br />
proportion of<br />
open flowers<br />
B/D<br />
% or<br />
proportion of<br />
wilting flowers<br />
+ developing<br />
fruits<br />
C/D<br />
Species 1<br />
(A)<br />
(B)<br />
(C)<br />
Species 2<br />
Species 3<br />
64
Advanced Phenological Activity Guide<br />
Worksheet 4. Phenological Progression Across the Growing Season. Within each species, track the change in the proportions of<br />
buds, open flowers, and wilted flowers (including developing fruits).<br />
Species Date Total<br />
Number of<br />
buds on all<br />
branches<br />
observed<br />
Species 1 Week 1<br />
(A)<br />
Total Number<br />
of open<br />
flowers on all<br />
branches<br />
observed<br />
(B)<br />
Total Number of<br />
wilted flowers<br />
and developing<br />
fruits on all<br />
branches<br />
observed<br />
(C)<br />
Total<br />
number of<br />
buds +<br />
flowers +<br />
fruits<br />
(A+B+C=D)<br />
% or<br />
proportion<br />
of buds<br />
A/D<br />
% or<br />
proportion<br />
of flowers<br />
B/D<br />
% or<br />
proportion of<br />
wilting flowers<br />
+ developing<br />
fruits<br />
C/D<br />
Week 2<br />
Week 3<br />
Week 4<br />
Etc.<br />
Species 2 Week 1<br />
Week 2<br />
Week 3<br />
Week 4<br />
Etc.<br />
65
Advanced Phenological Activity Guide<br />
Examples of ways to illustrate results in graphical form.<br />
66
Advanced Phenological Activity Guide<br />
67
Advanced Phenological Activity Guide<br />
68
Advanced Phenological Activity Guide<br />
In this figure, we’ve indicated the weeks as specific dates along the x‐axis, but this kind of<br />
flowering curve can be customized to match the weeks that you recorded in Worksheet 4, as<br />
in the figure below.<br />
69
Advanced Phenological Activity Guide<br />
Inspecting the figures above, can you answer the following questions?<br />
Which species flowered last?<br />
During Weeks 1 – 7, which species produced the most flowers for the longest period?<br />
During Weeks 1 – 2, which species produced the fewest flowers for the longest period?<br />
Between Weeks 5 and 6, which species changed rank with respect to flower production?<br />
For example, in Week 6, Species 2 produced more flowers than Species 4, but in Week 7,<br />
Species 4 produced more flowers than Species 2.<br />
By week 7, which species appears to have completed its flowering?<br />
Is there more variation among species in their flower production at Week 1 or at Week 7?<br />
Which species showed the fastest change in flower production from Week 1 to Week 2?<br />
Which species showed the least change in flowering production during this interval?<br />
From Week 3 to Week 4, which species showed the fastest increase in flower production?<br />
What other questions can be answered by examining flowering curves such as the ones<br />
shown in this figure?<br />
70
Teacher’s Guide to <strong>Phenology</strong><br />
Why do we care about <strong>Phenology</strong>?<br />
Introduction<br />
Phenological observations have been used for centuries by farmers to maximize crop<br />
production, by nature‐lovers to anticipate and to plan for optimal wildflower‐ or autumn leafviewing<br />
displays, by recreational fisherman to plan fishing trips, and by many of us to prepare<br />
for seasonal allergies. Today, this well‐established “science of the seasons” is also used by<br />
scientists to track the effects of global warming and climate change on organisms and to make<br />
predictions about the future health and function of natural and managed ecosystems. By<br />
tracking changes in the timing of phenological events such as the budburst and flowering times<br />
of wild and agricultural plant species; the appearance and abundance of pollinators; the<br />
emergence of invasive weeds; and the appearance and migration of beneficial insects and other<br />
pest‐controlling animals, scientists are able to better understand how our environment is<br />
changing.<br />
Today, phenological patterns are used to:<br />
√ Track the effects of climate change on plants and animals. If you and your class<br />
participate in phenological record‐keeping for more than one year, you may be able to<br />
observe changes in the dates of phonological events (such as the flowering dates of the<br />
plants in your garden) that correspond to changes in our local weather patterns. Even in<br />
a single year, the different Kids in Nature classes could report their observations to each<br />
other and compare them. What are the species that each class is observing? Do they<br />
observe the same dates of budburst, full flower, and end flower? If not, what might be<br />
the reasons for differences between their observations? (School gardens may differ in<br />
the amount of water, sunlight, temperature, and soil quality, all of which can affect the<br />
onset of budburst and flowering, the duration of flower and fruit production, and the<br />
total number of fruits produced per plant).<br />
√ To anticipate wildflower displays. Wildflowers can be seen on many roadsides and in<br />
disturbed sections of backyards and parks throughout Santa Barbara. Ask each student<br />
to find a wildflower near their house or on their street (preferably, a plant not growing<br />
in someone’s home garden, if they can find it) and to bring to class a flowering stem in a<br />
plastic zip‐lock bag (with a moist paper towel in it). How many different species do your<br />
students bring in? Are all of them in similar stages of flowering, or are some species in<br />
earlier stages of flowering (i.e., producing more buds and fewer flowers and fruits) than<br />
others. If students have located a patch of flowering herbs, ask them to record the date<br />
that they see the first flower being produced and the last flower being produced in that<br />
patch. Ask them to identify different “kinds” (e.g., species) of plants and to compare<br />
them with respect to their progression through flowering and fruiting.<br />
71
Teacher’s Guide to <strong>Phenology</strong><br />
√ To predict the onset and intensity of allergies. Ask your students to list any plants that<br />
they know to which they or any friends and family members are allergic. Ask them to<br />
interview friends and families once a month during this fall, winter and spring to report<br />
when their allergies occur and if they can name the plants to which they’re allergic.<br />
√ To plan the best time to plant our gardens and agricultural crops. Reinforce for your<br />
students that, just as fruits and vegetables become ripe and are harvested at different<br />
times of the year, they are also planted at different times of the year. Ask students to<br />
interview family members or neighbors who have vegetable/fruit gardens to find out<br />
what they plant each month of the year (particularly in February, March, April and May).<br />
If some students don’t have friends or family to interview, then assign students to teams<br />
of two or three, where they can cooperate in planning and writing down the questions<br />
they will ask even if they don’t all conduct the interviews.<br />
√ To determine the best time for weeding gardens and agricultural fields. Ask students<br />
to interview families and friends about the appearance and treatment of weeds in their<br />
gardens. Do different weeds appear in different months? Students could also bring in to<br />
class some specimens (with their names) of garden weeds from their family and<br />
neighbors’ gardens. Once the students know common local weeds, some of them might<br />
even be able to earn some extra money by offering a weed‐pulling service for their<br />
family or neighbors!!<br />
√ To determine when honeybees are necessary for pollinating a given crop. Do your<br />
students know that farmers pay to rent hives of honeybees to pollinate many of our<br />
California crops? Do they know that up to a third of the fruits, nuts, and vegetables that<br />
we eat would not be available if they weren’t pollinated by domesticated bees? Each<br />
week of renting hives costs money, so farmers can minimize their costs by renting bees<br />
only when their plants are in full flower! Pollination Time is Money! Enterprising<br />
students could look on the websites for honeybee rental to examine the cost!<br />
Read this article in the Pittsburgh Gazette (June 2008: “Cost of honeybee pollination goes sky‐high” for<br />
some recent information):<br />
http://www.post‐gazette.com/pg/08182/893603‐28.stm<br />
√ To plan recreational activities and to attract tourists. New England states such as<br />
Vermont and Maine pay special attention to the time at which the leaves on their<br />
deciduous trees (oaks, maples, birch, beech, and ash) change color in the fall, creating<br />
spectacular displays. Tourists flock to Vermont to see the beautiful displays, and plan<br />
their trips based on detailed information about each season’s leaf phenology that they<br />
can find on websites such as:<br />
http://www.travel‐vermont.com/seasons/forecaster.asp<br />
72
Teacher’s Guide to <strong>Phenology</strong><br />
Why do leaves change color? A great description is found at:<br />
http://www.travel‐vermont.com/seasons/whychange.asp<br />
Can your students think of recreational activities and tourist attractions in California that<br />
depend on the phenology of plants and animals? (Whale migration, snowy plover breeding,<br />
desert wildflower displays, monarch butterfly congregation)<br />
√ To plan for the appearance and control of insect pest outbreaks. Both organic farmers<br />
and non‐organic farmers have to control insect pests before the insect pests eat their<br />
crops! Each kind of fruit or vegetable is typically preferred by just a few different kinds<br />
insect pests that are strongly attracted to it, and the appearance of different pests<br />
changes over the spring and summer. Ask your students to interview their family<br />
members or neighbors with gardens in order to discover – each month – which insect<br />
pests are bothering their gardens and what the gardener is doing about it. Insect‐loving<br />
students can bring in examples of insect pests in small jars. If they know about<br />
“beneficial” or birds that are predators on these pests, it would be fun to study their<br />
phenology throughout the year as well.<br />
What will we do to become junior phenologists? Prepare your students to become Certified<br />
Junior Phenologists by explaining the following:<br />
Throughout the year as a Kids In Nature participant, you’ll explore many aspects of the<br />
environment, including the physical environment (water, air, and soil) and the biological<br />
environment (microbes, fungi, animals, and plants). Your mission as a phenologist‐in‐training is<br />
to observe and report how these aspects of the environment change across the seasons in your<br />
school’s native plant garden.<br />
To do this, and to become certified as a junior phenologist, you’ll need to record in your<br />
journal the appearance of the plants and insects in your school’s native plant garden. Are there<br />
leaves on the plants? Are there flower buds, open flowers, or fruits? What do they look like,<br />
and what are their relative proportions? (Note that a plant with 100% flower buds is at the<br />
beginning of its flowering season, whereas a plant with 100% fruits has finished its flowering<br />
season). Are there insects visiting the plants (are they visiting flowers or leaves?), and what are<br />
they doing (feeding, resting, etc.)? Did you see the same insects last time you checked the<br />
garden, or did they only recently appear?<br />
You’ll record this information in your journal, and just before the Kids In Nature graduation<br />
you’ll report your findings on the website that provides phenological information entered by<br />
thousands of Americans who are doing what you are doing. This effort is part of a project called<br />
“Project Budburst.” Go to the Project Budburst website (www.budburst.org) to learn more<br />
about how to become a citizen scientist!<br />
73
Teacher’s Guide to <strong>Phenology</strong><br />
Your mission doesn’t end there, because phenology is around us everywhere all the time – it’s<br />
a science for all seasons, locations, and species! So when you take KIN field trips you’ll be<br />
asked about how the changing seasons influence the ecosystem you’re learning about.<br />
Continue to explore the plants and animals in your neighborhood and in your backyard or<br />
family garden – when does each plant begin to flower and for how many days or weeks does it<br />
continue to flower? You can even ask your family to get involved! Do you have relatives and<br />
friends in other parts of the country? Ask them what’s going on in their physical and biological<br />
environment the next time you talk with them.<br />
Questions to Guide In‐class and Schoolyard Instruction<br />
1. How many examples of phenological events can you think of in the Santa Barbara region?<br />
(Example: the seasonal timing of gray whale migrations through the Santa Barbara channel.)<br />
2. <strong>The</strong>re are many types of scientists who study phenology. Using complete sentences, describe<br />
which aspect of the biological environment each of these scientists studies, and give an<br />
example of a measurement the scientist could record multiple times over the seasons to better<br />
understand the phenology of the organism that they’re studying. An example is provided.<br />
Botanist: A botanist studies plants. To better understand the phenology of a<br />
particular plant species like the California Poppy, a botanist could record the<br />
dates that they observe the first flower in the spring and the last flower in the<br />
summer. From these dates, the botanist could calculate the total duration of<br />
flowering; that is, the number of days that Poppies are displaying their<br />
flowers.<br />
Ornithologist:<br />
Mammologist:<br />
Soil Ecologist:<br />
Marine Biologist:<br />
Herpatologist:<br />
Entomologist:<br />
Arborist:<br />
3. What is the definition of a season? Is a season defined by temperature, the amount of<br />
rainfall, the length of day, or a combination of these environmental factors? If temperature is<br />
an important part of how you define a season, is the season defined by its highest temperature,<br />
the lowest temperature, the “usual” temperature, or by a combination of these<br />
measurements?<br />
74
Teacher’s Guide to <strong>Phenology</strong><br />
4.A. What resources and conditions does a plant need to grow (Discuss the importance of<br />
water, sunlight, soil nutrients, warm temperatures)?<br />
B. Are the resources available in constant supply year‐around?<br />
C. Are the conditions (temperature, number of daylight hours) constant year‐round?<br />
D. What would be the best conditions to promote the greatest plant growth and flower<br />
production? (Discuss the importance of sufficient rainfall or irrigation, warm temperatures,<br />
rich soils).<br />
E. How do you think that fluctuations in the availability of resources or in growing conditions<br />
might affect the timing of phenological events shown by individuals plants? (plants often<br />
delay flowering if its too cold or too dry)<br />
F. How do you think that fluctuations in the availability of resources or in growing conditions<br />
might affect the total number of leaves, flower buds, flowers, and fruits that may be<br />
produced by the plants?<br />
5. A. Describe the difference between climate and weather. For example, “Climate is<br />
characterized as _________, while weather is characterized as ___________.”<br />
B. How would you characterize the climate in Santa Barbara?<br />
6. Do you think that plants and animals respond to changes in the seasons? How? When?<br />
Overview of the UCSB <strong>Phenology</strong> Stewardship Program<br />
At the University of California, Santa Barbara (UCSB), two scientists have designed a<br />
program to recruit and to engage local families, teachers, nature enthusiasts, and students at<br />
all levels in phenological monitoring and education. <strong>The</strong> UCSB <strong>Phenology</strong> Stewardship Program<br />
is a growing network of observers dedicated to tracking the timing of seasonal biological events<br />
in the Santa Barbara region. With funding from UCSB’s Coastal Fund, the <strong>Phenology</strong><br />
Stewardship Program was initiated in the Spring of 2007 by PhD student Brian Haggerty and Dr.<br />
Susan Mazer (a Professor in the Department of Ecology, Evolution & Marine Biology). Through a<br />
combination of scientific research, environmental education, and outreach presentations for<br />
amateur and professional naturalists, pre‐service teachers, and experienced educators, their<br />
mission is to engage California residents in the collection of phenological data and the reporting<br />
of those observations to a national online database they helped establish – Project Budburst.<br />
75
Teacher’s Guide to <strong>Phenology</strong><br />
<strong>The</strong> UCSB <strong>Phenology</strong> Stewardship Program provides training and teaching materials for<br />
scientists and for both university and K‐12 teachers to bring phenological observation and its<br />
interpretation into the classroom and outdoor schoolyard or phenology garden. <strong>The</strong> Kids In<br />
Nature (KIN) environmental education program, coordinated by Dr. Jennifer Thorsch at UCSB’s<br />
Cheadle Center for Biodiversity and Ecological Restoration, is a prime example of how modern<br />
scientific research on biological responses to climate change can be interpreted for, and<br />
implemented in, local 5 th grade classrooms. A detailed background of phenology, its<br />
interpretation and importance, and the history of the <strong>USA</strong>‐NPN and Project Budburst is<br />
provided in Haggerty and Mazer’s <strong>The</strong> <strong>Phenology</strong> <strong>Handbook</strong>: a guide to phenology monitoring<br />
for students, teachers, families, and nature enthusiasts, which is available for free at their<br />
website .<br />
Project Budburst is one of the citizen‐science partnerships of the newly created <strong>USA</strong><br />
<strong>National</strong> <strong>Phenology</strong> <strong>Network</strong>, whose mission is to engage governmental agencies,<br />
environmental networks and field stations, educational institutions, and mass participation by<br />
citizen scientists in collecting phenological information on plants and animals. <strong>The</strong> <strong>USA</strong>‐NPN is<br />
managed by the U.S. Geological Survey, and includes partners such as the <strong>National</strong> Science<br />
Foundation, the University of Arizona, the U.S. Fish and Wildlife Service, and other agencies and<br />
institutions.<br />
76
<strong>Phenology</strong> Field Guide<br />
for Coal Oil Point Natural Reserve<br />
and the central California coast<br />
This guide to observing seasonal changes in plant communities<br />
can be used in conjunction with phenological monitoring protocols<br />
established by the UCSB <strong>Phenology</strong> Stewardship Program and<br />
the <strong>USA</strong> <strong>National</strong> <strong>Phenology</strong> <strong>Network</strong>.<br />
Visit www.usanpn.org to learn more.<br />
Brian P Haggerty and Susan J Mazer<br />
University of California, Santa Barbara<br />
© 2008 Brian P Haggerty and Susan J Mazer<br />
77
California Poppy<br />
Scientific name: Eschscholzia californica<br />
Plant family: Papaveraceae (Poppy family)<br />
IDENTIFYING CHARACTERISTICS<br />
habit: Herbaceous, sometimes with<br />
woody stem bases.<br />
plant size: Height 5 - 60 cm<br />
Width 5 - 40 cm<br />
leaves: Stems spreading from central base.<br />
Leaves sometime with bluish-green tint, finely lobed<br />
and concentrated at the base of flowering stems.<br />
flowers: Conspicuous, borne singly on tips of erect<br />
stems, 4 yellow-orange to golden petals each 20-60mm length.<br />
Interior base of petals generally darker orange than outer edges. Stamens
phenology of california poppy<br />
Approximate timing of phenophases<br />
In the Santa Barbara region, California Poppy seeds germinate with late-autumn rains and<br />
leaves develop throughout the winter. Leaf development slows and flowering begins as<br />
soils warm in the spring. Fruits mature through mid-summer, plants die by late summer.<br />
flowering<br />
fruit maturity<br />
leafing<br />
Nov Dec Jan Feb Mar Apr May Jun Jul Aug Sep Oct<br />
phenophase identification<br />
Key terms to use with the Phenophase Quick-Guide<br />
plant Habit<br />
herbaceous<br />
Floral Architecture<br />
Solitary flowers<br />
phenophases to observe<br />
First flower, last flower, first mature fruit,<br />
onset of leaf senescence, full leaf senescence<br />
<strong>The</strong> flowers of California Poppy close up at night and during harsh weather. Take this into<br />
consideration when determining phenophases or quantifying floral display.<br />
flower Bud<br />
First flower<br />
stamens<br />
visible<br />
mature fruit<br />
splits open from<br />
middle of vertical<br />
axis<br />
pink<br />
receptacle<br />
<strong>The</strong> genus Eschscholzia was named after Johann Friedrich Gustav von Eschscholtz, a<br />
naturalist and surgeon aboard a Russian ship that dropped anchor in the San Francisco Bay<br />
in 1815. He, like many others, was smitten with the wildflower-covered hills. He was also responsible<br />
for collecting specimens throughout his journey - a legacy which led his colleages<br />
to name a group of closely-related species after him. When the scientific name of the genus<br />
was published formally, the “t” in Eschscholtz was inadvertently omitted. Eschscholzia californica<br />
was named California’s state flower in 1903.<br />
phenology field guide to coal oil point natural reserve<br />
79
California sunflower<br />
Scientific name: Encelia californica<br />
Plant family: Asteraceae (Sunflower family)<br />
IDENTIFYING CHARACTERISTICS<br />
HABIT: Broad rounded shrub, with many erect<br />
slender woody stems from base.<br />
plant size: Height 0.5 - 2m<br />
Width 1 - 3m<br />
leaves: Cauline (located along upper portions of<br />
stems). Blades silvery green, canescent<br />
(covered with small whitish grayish hairs),<br />
diamond to ovate in shape and 2.5-4cm in length.<br />
inflorescence: Solitary head, 4-8cm diameter. Peduncle (the head’s stem)<br />
canescent to hairy.<br />
Ray Flowers: Yellow, 15-25 per infl and each ligule (“petal”) 15-40mm length. Sterile.<br />
Disk Flowers: Corollas brown-purplish and 5-6mm in length with 2 yellow stigma<br />
lobes exserted 1-3mm.<br />
Fruits: A composite of small achenes, each 5-7mm in length. Each achene reminiscent of a<br />
commercially-available sunflower seed (but smaller).<br />
habitat<br />
Restricted to South & Central California coastal region. Coastal sage scrub, sandy backdunes,<br />
coastal bluff and interior to
phenology of california sunflower<br />
Approximate timing of phenophases<br />
<strong>Phenology</strong> for Encelia californica is highly variable and depends largely on plant size and<br />
the microsite (e.g., soil type, water availability, shade). Generally, plants begin developing<br />
leaves mid-late winter. Look for flower buds near spring equinox; flowering begins late<br />
spring. Summer drought brings on rapid senescence of leaves, flowers, and fruits.<br />
leafing<br />
flowering<br />
fruit maturity<br />
Nov Dec Jan Feb Mar Apr May Jun Jul Aug Sep Oct<br />
phenophase identification<br />
Key terms to use with the Phenophase Quick-Guide<br />
plant Habit<br />
shrub<br />
Floral Architecture<br />
head inflorescence (sunflower)<br />
phenophases to observe<br />
First leaf, first flower, last flower, first mature fruit,<br />
onset of leaf senescence, full leaf senescence<br />
<strong>The</strong> date of first flower for head inflorescences (e.g., sunflowers) occurs when the first disk<br />
flowers open (on three separate branches for CA sunflower because it’s a shrub), not when the<br />
ligules (the petal look-alikes) are expanding. Flowering progresses concentrically toward the<br />
center of the head (compare the first flower photo below with the large photo on the previous<br />
page, which was taken at a later stage of flowering). <strong>The</strong> date of last flower occurs when the<br />
last disk flower opens (look for it in the center of the head), not when the ligules wilt.<br />
flower Bud<br />
disk flowers not yet visible<br />
First flower<br />
first three<br />
branches<br />
with disk<br />
flowers<br />
visible<br />
mature fruit<br />
ligules<br />
wilted<br />
achenes<br />
(sunflower<br />
seeds)<br />
removable<br />
phenology field guide to coal oil point natural reserve<br />
Stay on the lookout for pollinators!<br />
Many different species of flies and<br />
bees visit these sunflowers (two different<br />
flies are shown here). Notice<br />
the detail of each disk flower!<br />
81
Coast Goldenbush<br />
Scientific name: Isocoma menziesii<br />
Plant family: Asteraceae (Sunflower family)<br />
IDENTIFYING CHARACTERISTICS<br />
HABIT: Rounded, open, or mat-forming shrub with<br />
low-branching erect or prostrate stems<br />
plant size: Height < 2m<br />
Width Up to 2m<br />
leaves: Dark green and slightly stiff, ovate to<br />
spoon-shaped, length 0.5-4.5cm and width<br />
5-15mm. Leaves concentrated at stem tips<br />
(i.e., cauline). Leaf margin depends on position<br />
along stem: lower leaves show entire margins<br />
whereas higher leaves show serrated margins.<br />
inflorescence: Head, in loose to tight clusters of 4-10 heads.<br />
Ray flowers: Not produced by this plant.<br />
Disk flowers: 12-20 disk flowers per head, Individual flowers yellow and<br />
tubular abruptly expanding into larger cylinder at base.<br />
Fruits: A composite of brownish to whitish achenes, silky-hairy, 3.5mm long.<br />
habitat<br />
Arid regions with sandy and rocky soils. Typically found on stabilized backdunes, hillsides,<br />
and canyons.<br />
life history<br />
duration: Perennial<br />
flowering time: April - November<br />
pollination: Entomophilous: bumblebees, solitary bees, flies, butterflies, moths.<br />
distribution<br />
82
phenology of coast goldenbush<br />
Approximate timing of phenophases<br />
Coast Goldenbush shrubs produce new leaves in early spring, after winter rains have accumulated<br />
and as warm temperatures return. Flower buds appear around summer solstice;<br />
flowering begins a few weeks later. Leaves senesce and flowering is completed by late summer;<br />
fruits mature into early autumn.<br />
leafing<br />
flowering<br />
fruit maturity<br />
Nov Dec Jan Feb Mar Apr May Jun Jul Aug Sep Oct<br />
phenophase identification<br />
Key terms to use with the Phenophase Quick-Guide<br />
plant Habit<br />
shrub<br />
Floral Architecture<br />
head inflorescence (sunflower)<br />
phenophases to observe<br />
First flower, peak flowering, last flower, first mature fruit,<br />
onset of leaf senescence, full leaf senescence<br />
Look closely for flowering phenophases: Isocoma menziesii does not produce ray flowers<br />
(compare to Encelia californica), and the inflorescence buds turn golden yellow (same color<br />
as flowers) before actually opening. Remember that the date of first flower for sunflowers is<br />
when the first disk flower opens (on three separate branches for Coast Goldenbush because<br />
it’s a shrub). <strong>The</strong> date of last flower occurs when the last disk flower opens.<br />
flower Bud<br />
First flower<br />
first three<br />
branches<br />
with disk<br />
flower<br />
visible<br />
mature fruit<br />
first three<br />
branches<br />
with<br />
feathery<br />
pappus<br />
phenology field guide to coal oil point natural reserve<br />
Ever wonder why the specific epithet menziesii appears so frequently in the scientific names<br />
of plants? <strong>The</strong>se plants were named after Archibald Menzies (1754-1842), a Scottish surgeon<br />
and botanist who collected many plants and animals from around the world. Some of the<br />
specimens he collected were named in his honor, including this plant.<br />
83
Pink Sand Verbena<br />
Scientific name: Abronia umbellata<br />
Plant family: Nyctaginaceae (Four O’Clock family)<br />
IDENTIFYING CHARACTERISTICS<br />
HABIT: Prostrate herb<br />
plant size: Height 5 - 40 cm<br />
Width 0.5 - 2 m<br />
leaves: Semi-succulent and glabrous to<br />
glandular-hairy, therefore often appearing<br />
sticky and covered with sand. Petiole<br />
1-6cm, blade shape varies from ovate to<br />
elliptic to rhombic, margins entire.<br />
inflorescence: Umbel (hence the specific epithet umbellata), spherical with 8-27<br />
flowers. Peduncle 2.5-15cm, generally erect.<br />
FLOWERS: Color varies from light pink (occasionally white) to dark magenta. Diameter<br />
5-20mm, perianth tube (flower length) 5-20mm, yellow anthers visible inside.<br />
Fruits: A “multiple fruit”, therefore fruits produced by different flowers of the same inflorescence<br />
aggregate into one larger fruit, appearing brain-like. Each fruit 7-12mm long,<br />
glabrous below, glandular-hairy above with 2-5 (often 4) wings rounded at top.<br />
habitat<br />
Full sunlight and sandy soils. Typical of coastal dunes and backdunes, occasionally coastal<br />
scrub. Also occuring in disturbed sandy areas.<br />
life history<br />
duration: Annual, possibly perennial with moderate environmental conditions<br />
flowering time: March - November. Individual plants flower for 2 - 6 months.<br />
pollination: Entomophilous- mostly bumblebees; also solitary bees, flies, and beetles.<br />
distribution<br />
84
phenology of pink sand verbena<br />
Approximate timing of phenophases<br />
Pink Sand Verbena germinates and develops leaves at the onset of winter rains. Flower<br />
buds appear in early spring (approx. when CA Poppy starts flowering); flowering begins a<br />
couple weeks later, continuing through the summer. Fruits mature continuously throughout<br />
the summer. Drought-hardy plant, but dies with prolonged summer drought in Aug/Sep.<br />
leafing<br />
flowering<br />
fruit maturity<br />
Nov Dec Jan Feb Mar Apr May Jun Jul Aug Sep Oct<br />
phenophase identification<br />
Key terms to use with the Phenophase Quick-Guide<br />
plant Habit<br />
herb<br />
Floral Architecture<br />
umbel inflorescence<br />
phenophases to observe<br />
First flower, last flower, first mature fruit,<br />
onset of leaf senescence, full leaf senescence<br />
<strong>The</strong> glandular-hairy leaves and inflorescences of Pink Sand Verbena become covered with<br />
sand over time - take this into consideration when looking for buds, flowers, and fruits.<br />
flower Bud<br />
First flower<br />
corolla<br />
tube visible<br />
anthers<br />
small and<br />
hard to see<br />
mature fruit<br />
at least one<br />
ripe fruit on<br />
one “multiple<br />
fruit”<br />
see fruit description<br />
Stay on the lookout for pollinators! Bumblebees foraging for nectar<br />
and pollen, like the one in this photo, visit the flowers of Pink<br />
Sand Verbena often in the spring and early summer. Bumblebees<br />
are heavier than the inflorescences they visit and so must<br />
put on an athletic display as they hang on to the inflorescences<br />
that sway under their weight!<br />
phenology field guide to coal oil point natural reserve<br />
85
Sea cliff daisy<br />
Scientific name: Malacothrix saxatilis<br />
Plant family: Asteraceae (Sunflower family)<br />
IDENTIFYING CHARACTERISTICS<br />
HABIT: Rounded subshrub to shrub, erect stems.<br />
plant size: Height 0.5 - 1 m<br />
Width: 0.5 - 1.5 m<br />
leaves:<br />
Linear to obovate, sharply serrated<br />
margins, blades 25-50mm long. Last<br />
year’s woody stems usually present and<br />
create an unmanicured appearance.<br />
inflorescence: Head, borne singly, distributed evenly across plant.<br />
Flowers: White, 5 notches on outer tip. Tightly packed in concentric whorls, like<br />
onion layers. Whorls open in succession, each ray flower (“petal”) fused with one<br />
disk flower (white, erect, tubular structure).<br />
Fruits: “Dandelion-like”, but more durable. Fruiting head composed of minute brown to<br />
purplish seeds (achenes), each with white feathery pappus for wind dispersal.<br />
1-3mm diameter.<br />
habitat<br />
Full sunlight, well-drained soils. Coastal sage scrub, coastal dune and backdune, canyons,<br />
and chaparral
phenology of sea cliff daisy<br />
Approximate timing of phenophases<br />
Sea cliff daisy is a deciduous perennial and, similar to many Mediterranean shrubs, it is dormant<br />
at the end of the summer. Look for leaf budburst after first winter rains. Flower buds<br />
develop in mid-spring, flowering begins in early summer and continues until plant scenesces<br />
due to prolonged drought. Fruits mature throughout summer.<br />
leafing<br />
flowering<br />
fruit maturity<br />
Nov Dec Jan Feb Mar Apr May Jun Jul Aug Sep Oct<br />
phenophase identification<br />
Key terms to use with the Phenophase Quick-Guide<br />
plant Habit<br />
shrub<br />
Floral Architecture<br />
head inflorescence (sunflower)<br />
phenophases to observe<br />
Leaf budburst, First flower, last flower,<br />
first mature fruit, onset of leaf senescence, full leaf senescence<br />
To the untrained eye, the buds and the “spent flowers” (i.e., developing fruits) of sea cliff<br />
daisies look similar. Whereas the buds are spherical, with vertical, purplish bracts that protect<br />
the flowers inside the inflorescence (giving the bud a manicured appearance), each fruit<br />
produces a feathery pappus that protrudes from its tip, and the bracts appear to become<br />
twisted around the central axis.<br />
flower Bud<br />
First flower<br />
first three<br />
branches<br />
with disk<br />
flowers<br />
visible<br />
mature fruit<br />
first three<br />
branches<br />
with<br />
feathery<br />
pappus<br />
phenology field guide to coal oil point natural reserve<br />
<strong>The</strong> sunflowers of Malacothrix saxitilis are often visited by flies<br />
who are foraging for nectar, like in this photo. At Coal Oil Point<br />
Natural Reserve, these daisies bloom early-mid summer when<br />
different types of flies are emerging and increasing in abundance.<br />
How many types of flies can you count on these sunflowers?<br />
87
Common Name: Kinnikinnick<br />
Alternate Name: Bearberry<br />
Scientific Name: Arctostaphylos<br />
uva-ursi<br />
Plant Family: Ericaceae<br />
Identifying Characteristics:<br />
Size: Can occur in extremely dense, trailing<br />
stands, with heights rarely taller than 15 cm (6<br />
in).<br />
Leaves: Leathery, dark green leaves have<br />
rounded tips and are 2.5 cm (1 in) long, held<br />
vertically by a twisted leaf stalk.<br />
Flowers: Small, white to pink urn-shaped<br />
flowers occurring in clusters.<br />
Habitat: very cold tolerant, preferring coarse,<br />
well-drained soils of forests, sand dunes, bald<br />
or barren areas.<br />
Photograph by G.A. Cooper @ USDA-NRCS<br />
PLANTS Database<br />
Photograph by G.A. Cooper @ USDA-NRCS<br />
PLANTS Database<br />
Bloom time: Late spring (May to June),<br />
depending on location<br />
Information source:<br />
USDA Plants Database (plants.usda.gov/java/profile?symbol=ARUV)<br />
Phenological observations of Interest:<br />
First Leaf, First Flower, Full Flower, End of<br />
Flowering, First Ripe Fruit<br />
Did you know? “[Kinnikinnick] serves a<br />
dual role on sandy soils, as both a<br />
beautification plant as well as a critical area<br />
stabilizer. <strong>The</strong> thick, prostrate, vegetative<br />
mat and evergreen character are what<br />
make bearberry a very popular ground<br />
cover. It is often planted around home<br />
sites, sand dunes, sandy banks, and<br />
commercial sites.” Contributed by USDA<br />
NRCS Northeast Plant Materials Program<br />
Distribution Area:<br />
Map courtesy of USDA-NRCS PLANTS Database (plants.usda.gov)<br />
www.budburst.org<br />
© 2007 University Corporation for Atmospheric Research All Rights Reserved
Kinnikinnick (Arctostaphylos uva-ursi)<br />
Phenophase Field Guide<br />
Identification www.budburst.org<br />
First Leaf First Flower Full Flower<br />
Photo Needed!<br />
Share your photo<br />
of this phenophase.<br />
budburstweb@ucar.edu<br />
End of Flowering<br />
First Ripe Fruit<br />
First Leaf: Report the date at which the first leaves are completely unfolded from the bud on at least three<br />
places on the shrub where budburst has occurred. <strong>The</strong> leaves need to be opened completely and the leaf<br />
stem or leaf base must be visible (you might need to bend the new leaf backwards in order to see those).<br />
First Flower: Report the date at which the first flowers are completely open on three or more places. You<br />
must be able to see the stamens among the unfolded petals.<br />
Full Flower: Report the date when 50% of the flowers are fully opened. Note that some trees and shrubs,<br />
especially in southern areas never reach full flowering (never have 50% of flowers open at one time). For<br />
these plants just record first flower and end of flowering. If flowers are in clusters or stalks on a tree or shrub<br />
then there need to be open flowers on at least 50% of the branches on the plant.<br />
End of Flowering: Report the date when the last flower has withered, dried up, or died. If flowers are in<br />
clusters or stalks then the stalks should have no open flowers.<br />
First Ripe Fruit : Report the date when you notice the first fruits becoming fully ripe or seeds dropping<br />
naturally from the plant on three or more places on plant. Ripening is usually indicated by a change in color<br />
from green to bright red.<br />
Photographs courtesy of Paul Alaback, University of Montana; John Hixson, Lady Bird Wildflower Center, www.wildflower.org.<br />
Phenophase descriptions written by Paul Alaback, University of Montana.<br />
www.budburst.org<br />
© 2007-2009 University Corporation for Atmospheric Research All Rights Reserved
Common Name: Big sagebrush<br />
Scientific Name: Artemisia tridentata<br />
Plant Family: Asteraceaea<br />
Identifying Characteristics:<br />
Size: A tall, rounded shrub, usually less than<br />
30 cm (12 in) in height, but it has been<br />
observed to grow as high as 4 to 5 meters (15<br />
ft) tall when conditions are highly favorable.<br />
Leaves: Leaves wedge-shaped, generally 1 to<br />
3 cm long, although they can reach 6 cm in<br />
length. Leaves are usually 3- or 5-toothed at<br />
the tip, although sometimes the leaf tips are<br />
rounded. <strong>The</strong> surfaces of the leaves are<br />
silvery to gray-green and covered with dense<br />
hairs. If you crush and smell the leaves, you<br />
will find that they are highly aromatic.<br />
Flowers: Flowers are small and borne in<br />
dense heads that are 2.0 – 2.5 mm in<br />
diameter, located at the tips of the erect stems.<br />
<strong>The</strong>y are usually rather inconspicuous, so take<br />
a close look!<br />
Habitat: Common in habitats with dry soils,<br />
and on desert slopes, including valleys and<br />
slopes 300 – 3000 meters elevation and<br />
higher.<br />
Bloom time: Buds typically form in June;<br />
Flowering and seed ripening occur in the fall.<br />
Information source:<br />
<strong>The</strong> Jepson Manual. 1993. University of California Press; U. S.<br />
Department of Agriculture, Natural Resources Conservation Service.<br />
Did you know? Sage grouse depend on big<br />
sagebrush for food more than any other species. Up<br />
to 70 – 75% of their diet is composed of the leaves<br />
and flower heads of big sagebrush. Antelope and<br />
mule deer also eat big sagebrush leaves and stems<br />
during the fall, winter, and spring. A variety of birds<br />
can also be found hiding in the brush provided by<br />
sagebrush, including sage grouse, sharp tailed<br />
grouse, prairie sparrows, chukar, quail, and gray<br />
partridge.<br />
Photograph by J.S. Peterson. USDA NRCS NPDC.<br />
<strong>USA</strong>, CO, Denver Botanic Gardens. August 11, 2003.e<br />
Phenological observations of interest:<br />
First Leaf, First Pollen, Full Pollen, End of<br />
Pollen, First Ripe Fruits<br />
Distribution Area:<br />
Map courtesy of USDA-NRCS PLANTS Database (plants.usda.gov)<br />
Photograph by J.S. Peterson. USDA NRCS NPDC.<br />
<strong>USA</strong>, UT, Grand Co., near Thompson. July 15, 2001<br />
www.budburst.org<br />
© 2007 University Corporation for Atmospheric Research All Rights Reserved
Big sagebrush (Artemisia tridentata)<br />
Phenophase Field Guide<br />
Identification www.budburst.org<br />
Photo Needed!<br />
Share your photo<br />
of this phenophase.<br />
budburstweb@ucar.edu<br />
First Pollen<br />
Full Pollen<br />
End of Pollen<br />
First Leaf<br />
First Ripe Fruit<br />
First Pollen: Report the date when 50% of the branches with flowers are have fully opened flowers. Note that some<br />
trees and shrubs, especially in southern areas never reach full flowering (never have 50% of flowers open at one time).<br />
For these plants just record first flower and last flower. On sagebrush flowers will turn bright yellow when they are<br />
dispersing pollen. If there is pollen you should see the pollen dust in the air or on your fingers when you gently touch<br />
the flowers.<br />
Full Pollen: Report the date when 50% of the flowers have pollen. <strong>The</strong>re need to be flowers with pollen on at least 50%<br />
of the branches on the plant.<br />
End of Pollen: Report the date when there are no longer any flowers with pollen. If flowers are in clusters or stalks then<br />
the stalks should have no flowers with pollen. Flowers usually look brown when pollen dispersal has ended.<br />
First Leaf: Report the date at which the first leaves are completely unfolded from the bud. For trees or large shrubs<br />
you will want to make sure there are at least three places on the tree or shrub where budburst has occurred. <strong>The</strong><br />
leaves need to be opened completely and the leaf stem or leaf base must be visible (you might need to bend the new<br />
leaf backwards in order to see those).<br />
First Ripe Fruit : Report the date when you notice the first fruits becoming fully ripe or seeds dropping naturally from<br />
the plant on 3 or more branches. Ripening is usually indicated by a change in color of fruits to brown.<br />
Photographs courtesy of Paul Alaback, University of Montana; Steve Baskauf, Vanderbilt University, bioimages.vanderbilt.edu.<br />
Phenophase descriptions written by Paul Alaback, University of Montana.<br />
www.budburst.org<br />
© 2007-2009 University Corporation for Atmospheric Research All Rights Reserved
Common Name: Creeping barberry<br />
Alternate Name: Oregon grape<br />
Scientific Name: Mahonia repens, or<br />
Berberis aquifolium var. repens<br />
Plant Family: Berberidaceae<br />
Identifying Characteristics:<br />
Size: Creeping barberry is an evergreen shrub<br />
usually about 80 cm (31 in) in height.<br />
Leaves: Leaves are variable, pinnately<br />
compound, with 5 – 7 leaflets, each 2 to 7 cm<br />
(0.75 to 2.75 in) long. <strong>The</strong> leaves are arranged<br />
alternately along the stem, attached by 1 to 6<br />
cm (0.4 to 2.4 in) petioles. Each leaf is made<br />
up of 3 – 11 round to elongated leaflets with<br />
spine-toothed margins.<br />
Flowers: Flowers are borne in branched<br />
clusters at the sides or tips of branches. Each<br />
flower has 9 sepals produced in 3 tiers and 6<br />
petals produced in two tiers of three petals.<br />
<strong>The</strong> flowers develop into spherical to elliptical,<br />
purple-black berries in grape-like clusters.<br />
Bark: On young trees, the bark is smooth, but<br />
it develops ridges and furrows in older trees.<br />
Young twigs are covered with a waxy coating<br />
that appears shiny and green to purple in color.<br />
Habitat: Creeping barberry favors hills, dry<br />
slopes, and canyons in coniferous forest, oak<br />
woodland, and chaparral, often in partial<br />
shade.<br />
Phenological observations of interest:<br />
First Leaf, First Flower, Full Flower, End of<br />
Flowering, First Ripe Fruit<br />
Distribution Area:<br />
Photograph by Margaret Williams. Courtesy<br />
of Nevada Native Plant Society. ©Nevada<br />
Native Plant Society.<br />
Photograph by R.A. Howard, Courtesy of<br />
Smithsonian Institution<br />
Bloom time: Generally flowers from April –<br />
June.<br />
Information source:<br />
<strong>The</strong> Jepson Manual. 1993. University of California Press<br />
Did you know? Creeping Oregon grape is adapted<br />
to habitats that have regular wildfires. It regenerates<br />
after a fire when dormant buds sprout from the<br />
surface of the underground rhizomes.<br />
Map courtesy of USDA-NRCS PLANTS Database (plants.usda.gov)<br />
www.budburst.org<br />
© 2007 University Corporation for Atmospheric Research All Rights Reserved
Oregon grape (Mahonia repens)<br />
Phenophase Field Guide<br />
Identification www.budburst.org<br />
Photo Needed!<br />
Share your photo<br />
of this phenophase.<br />
budburstweb@ucar.edu<br />
First Leaf First Flower Full Flower<br />
Photo Needed!<br />
Share your photo<br />
of this phenophase.<br />
budburstweb@ucar.edu<br />
End of Flowering<br />
First Ripe Fruit<br />
First Leaf: Report the date at which the first leaves are completely unfolded from the bud. For trees or large<br />
shrubs you will want to make sure there are at least three places on the tree or shrub where budburst has<br />
occurred. <strong>The</strong> leaves need to be opened completely and the leaf stem or leaf base must be visible. New<br />
leaves are a bright green color.<br />
First Flower: Report the date at which the first flowers are completely open on at least three places on the<br />
shrub. You must be able to see the stamens among the unfolded petals.<br />
Full Flower: Report the date when 50% of the flowers are fully opened. Note that some trees and shrubs,<br />
especially in southern areas never reach full flowering (never have 50% of flowers open at one time). For<br />
these plants just record first flower and end of flowering. If flowers are in clusters or stalks on a tree or shrub<br />
then there need to be open flowers on at least 50% of the branches on the plant.<br />
End of Flowering: Report the date when the last flower has withered, dried up, or died. If flowers are in<br />
clusters or stalks then the stalks should have no open flowers.<br />
First Ripe Fruit : Report the date when you notice the first berries becoming fully ripe or seeds dropping<br />
naturally from the plant on at least three places on the shrub. Ripening is usually indicated by a change in<br />
color from green or red to blue.<br />
Photographs courtesy of Paul Alaback, University of Montana; Michael G. Alder, Lady Bird Wildflower Center, www.wildflower.org.<br />
Phenophase descriptions written by Paul Alaback, University of Montana.<br />
www.budburst.org<br />
© 2007-2009 University Corporation for Atmospheric Research All Rights Reserved
Common Name: Black elderberry<br />
Alternate Names: Blue elder, Elderberry,<br />
Blue elderberry, American elder, wild<br />
elder, Europen black elderberry<br />
Scientific Name: Sambucus mexicana,<br />
Sambucus niger, Sambucus caerulea<br />
Plant Family: Caprifoliaceae<br />
Identifying Characteristics:<br />
Size: <strong>The</strong> elderberry is 2 to 8 m tall (6 to 24 ft)<br />
Leaves: Pinnately compound with 3-9 leaflets<br />
per leaf; the leaflets are oval to elliptical,<br />
smooth-surface or hairy, with a highly pointed<br />
tip and often with an asymmetrical base. <strong>The</strong><br />
margins of the leaflets are serrated. Leaves<br />
are deciduous.<br />
Flowers: Flowers are white or cream-colored,<br />
small, and borne in terminal clusters (4 to 33<br />
cm in diameter) that bear dozens to hundreds<br />
of flowers. <strong>The</strong> flower is radially symmetrical<br />
and 5-lobed.<br />
Bark: <strong>The</strong> bark of mature trees is dark and<br />
rough.<br />
Habitat: Common, particularly in stream<br />
banks, riverside woodlands, and in open areas<br />
in the forest understory. Although elderberry’s<br />
preferred habitats are the bottoms of canyons<br />
where water persists longest during the<br />
summer, it is also often found on dry hillsides.<br />
Photograph by William & Wilma Follette.<br />
USDA NRCS. 1992. Western wetland<br />
flora: Field office guide to plant species.<br />
West Region, Sacramento, CA.<br />
Courtesy of USDA NRCS Wetl and<br />
Science Institute.<br />
Photograph by J.S. Peterson. USDA NRCS NPDC. <strong>USA</strong>, AZ,<br />
<strong>The</strong> Arboretum at Flagstaff. July 14, 2001.<br />
Phenological observations of interest:<br />
First Leaf, All Leaves Unfolded, First<br />
Flower, Full Flower, End of Flowering, 50%<br />
Color, 50% Leaf Fall, First Ripe Fruit<br />
Distribution Area:<br />
Bloom time: Flowers from May – September<br />
Information sources:<br />
Math/Science Nucleus: http://msnucleus.org and<br />
http://msnucleus.org/watersheds/mission/trees.html; USDA Natural<br />
Resources Conservation Service.<br />
Did you know? <strong>The</strong> flowers develop into blue<br />
berries which are an important source of food for<br />
birds and mammals. <strong>The</strong> blue berries were also<br />
dried and preserved for eating by Native Americans,<br />
and used by the early California immigrants to make<br />
jam and wine.<br />
Map courtesy of USDA-NRCS PLANTS Database (plants.usda.gov)<br />
www.budburst.org<br />
© 2007 University Corporation for Atmospheric Research All Rights Reserved
Black elderberry (Sambucus nigra)<br />
Phenophase Field Guide<br />
Identification www.budburst.org<br />
Photo Needed!<br />
Share your photo<br />
of this phenophase.<br />
budburstweb@ucar.edu<br />
First Leaf<br />
All Leaves Unfolded<br />
First Flower<br />
Full Flower<br />
Photo Needed!<br />
Share your photo<br />
of this phenophase.<br />
budburstweb@ucar.edu<br />
Photo Needed!<br />
Share your photo<br />
of this phenophase.<br />
budburstweb@ucar.edu<br />
Photo Needed!<br />
Share your photo<br />
of this phenophase.<br />
budburstweb@ucar.edu<br />
End of Flowering First Ripe Fruit 50% Color 50% Leaf Fall<br />
First Leaf: Report the date at which the first leaves are completely unfolded from the bud. You will want to make sure<br />
there are at least three branches where First Leaf has occurred. <strong>The</strong> whole leaves need to be opened completely (flat)<br />
not just the leaflets.<br />
All Leaves Unfolded: Report the date when nearly all (at least 95%) of the growing leaf buds have already reached the<br />
completely unfolded stage described above (First Leaf). This often occurs within days of first leaf.<br />
First Flower: Report the date at which the first flowers are completely open. You must be able to see the stamens<br />
among the unfolded petals. You need to make sure there are blooms on at least three flower clusters on the tree or<br />
shrub.<br />
Full Flower: Report the date when 50% of the flower clusters are fully opened. Elderberries quickly develop from the<br />
first flowers to full flowering, often within a few days.<br />
End of Flowering: Report the date when the last flower has withered, dried up, or died.<br />
First Ripe Fruit: Report the date when you notice the first fruits becoming fully ripe or seeds dropping naturally from<br />
the plant from three or more clusters. Ripening is usually indicated by a change in color to the mature color. Typically<br />
this is a bright blue or black with a whitish bloom.<br />
50% Color: Report the date when 50% of the leaves have started to change color. (usually yellow or brown)<br />
50% Leaf Fall: Report the date when 50% of the leaves have fallen off the tree or shrub.<br />
Photographs courtesy of Paul Alaback, University of Montana; Steve Baskauf, Vanderbilt University, www.cas.vanderbilt.edu/bioimages.<br />
Phenophase descriptions written by Paul Alaback, University of Montana.<br />
www.budburst.org<br />
© 2007-2009 University Corporation for Atmospheric Research All Rights Reserved
Common Snowberry (Symphoricarpos albus)<br />
Also Known As: White coralberry, snowberry<br />
Plant Family: Honeysuckle (Caprifoliaceae)<br />
Identification Guide<br />
Identification www.budburst.org<br />
Identification Hints: An unusual feature of common snowberry is its<br />
hollow stems. <strong>The</strong> flowers of common snowberry are pinkish-white and<br />
bell shaped. Creeping snowberry (Symphoricarpos molis) is very similar,<br />
however, as its name implies, it is a lower growing shrub with a spreading<br />
habit.<br />
Did you know? Some groups in the south used the branches of common<br />
snowberry to make brooms and hollowed out the twigs to make pipe<br />
stems. <strong>The</strong> hollow stems can also be used as whistles. <strong>The</strong> berries have<br />
been used to settle upset stomachs after too much fatty food. <strong>The</strong> berries<br />
were also used as treatment for burns, rashes, and sores. Common<br />
snowberry is very important as a browse for many types of wildlife<br />
and livestock. It provides food and shelter for various birds and small<br />
mammals. <strong>The</strong> berries and stems can be mildly toxic to children and even<br />
fatal to some animals.<br />
Phenological Observations of Interest: First Leaf, All Leaves Unfolded,<br />
First Flower, Full Flower, End of Flowering, 50% color, 50% Leaf fall,<br />
First Ripe Fruit<br />
General: This native, perennial shrub usually grows<br />
to about 0.6 to 1.5 m (2 to 5 ft) tall. It forms thickets<br />
about 1.2 to 1.8 m (4 to 6 ft) wide. It is widely dispersed<br />
throughout much of the US.<br />
Leaves: <strong>The</strong> leaves are green, large, opposite. <strong>The</strong>y<br />
are divided into five to seven leaflets that are toothed or<br />
irregularly lobed. <strong>The</strong>y are leathery and oval shaped.<br />
Flowers: <strong>The</strong> flowers are small, white to creamy, with<br />
a strong unpleasant odor. <strong>The</strong> flowers are tiny, pinkishwhite,<br />
bell-shaped and are found in small clusters that<br />
resemble parasols.<br />
Fruit: <strong>The</strong> fruits are roundish, waxy, dull-white berries<br />
that become brown and almost blackish.<br />
Habitat: Common snowberry is found along stream<br />
banks, in swampy thickets, moist clearings, and open<br />
forest at sea level to middle elevations. It tolerates a<br />
variety of soil types but thrives in heavy clay soils. It<br />
grows well in both shade and sun. Common snowberry<br />
inhabits slopes and valley bottoms of the foothills of the<br />
Coast Ranges, the Sierra Nevada, and the mountains<br />
of southern California. It extends northward to British<br />
Columbia and eastward to Pennsylvania, West Virginia,<br />
and the New England states.<br />
Bloom time: <strong>The</strong> flowers bloom from mid May to July.<br />
Fruits ripen in August or September.<br />
Distribution Area<br />
Bark: <strong>The</strong> bark is tan-gray to grayish brown and tends to<br />
split lengthwise on the older stems.<br />
Compiled by: Sandra Henderson<br />
Sources: USDA Plants Database; Lady Bird Johnson Wildflower Center.<br />
Photograph by: Frank Vincentz, Wikimedia Commons<br />
www.budburst.org<br />
© 2007-2009 University Corporation for Atmospheric Research All Rights Reserved
Phenophase Field Guide<br />
Common snowberry (Symphoricarpos albus) Identification www.budburst.org Guide<br />
First Leaf<br />
All Leaves Unfolded<br />
First Flower<br />
Full Flower<br />
Photo Needed!<br />
Share your photo<br />
of this phenophase.<br />
budburstweb@ucar.edu<br />
Photo Needed!<br />
Share your photo<br />
of this phenophase.<br />
budburstweb@ucar.edu<br />
Photo Needed!<br />
Share your photo<br />
of this phenophase.<br />
budburstweb@ucar.edu<br />
End of Flowering First Ripe Fruit 50% Color 50% Leaf Fall<br />
First Leaf: Report the date at which the first leaves are completely unfolded from the bud. You will want to make sure<br />
there are at least three branches where First Leaf has occurred. <strong>The</strong> leaves need to be opened completely (flat). For<br />
snowberries leaves can be quite small when they open up to first leaf, often within a few days of the buds opening up.<br />
All Leaves Unfolded: Report the date when nearly all (at least 95%) of the growing leaf buds have already reached the<br />
completely unfolded stage described above (First Leaf).<br />
First Flower: Report the date at which the first flowers are completely open on at least three branches. You must be<br />
able to see the stamens among the unfolded petals (they protrude outside of flower). Flowers are generally in small<br />
clusters, but only one open flower is needed to consider the cluster in flower.<br />
Full Flower: Report the date when 50% of the branches with flowers are have fully opened flowers. Note that some<br />
shrubs, especially in southern areas never reach full flowering (never have 50% of flowers open at one time). For these<br />
plants just record first flower and end of flowering.<br />
End of Flowering: Report the date when the last flower has withered, dried up, or died.<br />
First Ripe Fruit: Report the date when you notice the first fruits becoming fully ripe or dropping naturally from the plant<br />
(but not including fruits blown off plant in high winds or by animals before they are ripe). Ripening is usually indicated<br />
by a change in color to a bright white.<br />
50% Color: Report the date when 50% of the leaves have started to change color. (usually yellow or brown)<br />
50% Leaf Fall: Report the date when 50% of the leaves have fallen off the tree or shrub. Snowberry leaves are often<br />
quite tough and tend to persist longer than for other shrub species. <strong>The</strong>y often fall all at once in a strong fall storm as<br />
late as November in northern climates.<br />
Photographs courtesy of Paul Alaback, University of Montana.<br />
Phenophase descriptions written by Paul Alaback, University of Montana.<br />
www.budburst.org<br />
© 2007-2009 University Corporation for Atmospheric Research All Rights Reserved
Common Name: Bigleaf maple<br />
Scientific Name: Acer macrophyllum<br />
Plant Family: Aceraceae<br />
Identifying Characteristics:<br />
Size: Long-lived medium to large trees that<br />
reach up to 30 m (100 ft) in height with a trunk<br />
up to 76 cm (30 in) in diameter. Its usual height<br />
is 5 to 30 m (16 to 100 ft).<br />
Leaves: Leaves are simple, opposite, shiny<br />
dark green, and large: 15 to 30 cm (6 to 12 in)<br />
long and borne on long petioles (5 to 12 cm<br />
long, or 2 to 5 in) that attach them to the stem.<br />
<strong>The</strong> leaves are deeply lobed, and the margins<br />
are usually undulating or with shallow lobes.<br />
Flowers: <strong>The</strong> separate male and female trees<br />
have sweetly fragrant flowers. <strong>The</strong>y are<br />
creamy white colored and bean-like arranged<br />
in a pyramidal spike. <strong>The</strong> flower clusters are 10<br />
to 20 cm (4 to 8 in) long and the individual<br />
flowers have five petals.<br />
Bark: On young stems and twigs, the surface is<br />
smooth and gray to brown, becoming redbrown<br />
with age. Older branches have deeply<br />
fissured bark, which eventually fragments into<br />
separate scales.<br />
Habitat: Big leaf maple is most common in<br />
coarse and gravelly soils in dry to somewhat<br />
moist habitats. It is most abundant near the<br />
borders of low-elevation mountain streams and<br />
in river bottoms.<br />
Photograph by Susan McDougall.<br />
<strong>The</strong> Flora of Mt. Adams. <strong>USA</strong>, WA,<br />
Tacoma. June 2003<br />
Phenological observations of interest:<br />
First Leaf, All Leaves Unfolded, First<br />
Flower, Full Flower, End of Flowering, 50%<br />
Color, 50% Leaf Fall, First Ripe Fruit<br />
Distribution Area:<br />
Photograph by J.S. Peterson. USDA NRCS NPDC.<br />
<strong>USA</strong>, CA, Sacramento, Goethe Arboretum. June 3,<br />
Bloom time: Late spring<br />
Information source:<br />
<strong>The</strong> Jepson Manual. 1993. University of California Press<br />
Did you know? <strong>The</strong> inner bark of Big Leaf<br />
maple used to be dried and ground up into a<br />
powder that was used to thicken soups, just as<br />
we sometimes use cornstarch or flour to thicken<br />
soups and stews today.<br />
Map courtesy of USDA-NRCS PLANTS Database (plants.usda.gov)<br />
www.budburst.org<br />
© 2007 University Corporation for Atmospheric Research All Rights Reserved
Bigleaf maple (Acer macrophyllum)<br />
Phenophase Field Guide<br />
Identification www.budburst.org<br />
Photo Needed!<br />
Share your photo<br />
of this phenophase.<br />
budburstweb@ucar.edu<br />
First Leaf<br />
All Leaves Unfolded<br />
First Flower<br />
Full Flower<br />
Photo Needed!<br />
Share your photo<br />
of this phenophase.<br />
budburstweb@ucar.edu<br />
Photo Needed!<br />
Share your photo<br />
of this phenophase.<br />
budburstweb@ucar.edu<br />
Photo Needed!<br />
Share your photo<br />
of this phenophase.<br />
budburstweb@ucar.edu<br />
End of Flowering First Ripe Fruit 50% Color 50% Leaf Fall<br />
First Leaf: Report the date at which the first leaves are completely unfolded from the bud. You will want to make sure<br />
there are at least three branches where First Leaf has occurred. <strong>The</strong> leaves need to be opened completely (flat).<br />
Leaves on maples often droop for a long time before they expand and become flat. Look for smaller leaves which tend<br />
to flatten out first.<br />
All Leaves Unfolded: Report the date when nearly all (at least 95%) of the growing leaf buds have already reached the<br />
completely unfolded stage described above (First Leaf).<br />
First Flower: Report the date at which the first flowers are completely open on three or more branches. You must be<br />
able to see the stamens among the unfolded petals. You need to make sure there are blooms on at least three places<br />
on the tree or shrub. Big-leaf maples have flowers in clusters, clusters are considered in flower when at least one of the<br />
flowers is open in a cluster.<br />
Full Flower: Report the date when 50% of the branches have open flowers. Note that some trees and shrubs, especially<br />
in southern areas never reach full flowering (never have 50% of flowers open at one time). For these plants just<br />
record first flower and end of flowering.<br />
End of Flowering: Report the date when the last flower has withered, dried up, or died.<br />
First Ripe Fruit: Report the date when you notice the first fruits becoming fully ripe or seeds dropping naturally from<br />
the plant. Ripening is usually indicated by a change in color to the mature color. For maples this is when fruit (a twowinged<br />
samara or “helicopter”) turns brown in color.<br />
50% Color: Report the date when 50% of the leaves have started to change color. (usually yellow or brown)<br />
50% Leaf Fall: Report the date when 50% of the leaves have fallen off the tree or shrub.<br />
Photographs courtesy of J.S. Peterson, USDA-NRCS PLANTS Database; Susan McDougall, USDA-NRCS PLANTS Database; Donald Owen,<br />
California Department of Forestry and Fire Protection, Bugwood.org; Steve Baskauf, Vanderbilt University, bioimages.vanderbilt.edu.<br />
Phenophase descriptions written by Paul Alaback, University of Montana.<br />
www.budburst.org<br />
© 2007-2009 University Corporation for Atmospheric Research All Rights Reserved
Common Name: Beaked hazelnut<br />
Alternate Name: Filbert<br />
Scientific Name: Corylus cornuta<br />
Plant Family: Betulaceae<br />
Identifying Characteristics:<br />
Size: <strong>The</strong> beaked hazelnut is a multi-stemmed<br />
perennial-deciduous shrub or small tree that<br />
can grow 1 to 6 m (3 to 19 ft) in height.<br />
Leaves: Alternate leaf arrangement with hairy,<br />
oblong to ovate leaves generally 4 to 10 mm<br />
long. Leaf margins doubly serrate.<br />
Flowers: Beaked hazelnut has separate male<br />
(staminate) and female (pistillate) flowers. Tiny<br />
pistillate flowers are arranged spirally in a<br />
yellowish catkin that hangs from twigs; pistillate<br />
flowers are enclosed in bracts at the tips of<br />
twigs (appear as terminal buds) with red showy<br />
stigmas visible.<br />
Photograph by William S. Justice @ USDANRCS<br />
PLANTS Database<br />
Photograph by John R. Seiler @ USDA-NRCS<br />
PLANTS Database<br />
Bark: Smooth or scaly, dark brown. Twigs<br />
glabrous to sparsely pubescent, sometimes<br />
with glandular hairs.<br />
Habitat: Full sun to part shade in organically<br />
rich, medium moisture but well-drained soils.<br />
Associated with forest edges and openings,<br />
thickets, and rocky slopes at low to middle<br />
elevations.<br />
Phenological observations of interest:<br />
First Leaf, All Leaves Unfolded, First<br />
Pollen, Full Pollen, End of Pollen,<br />
50% Color, 50% Leaf Fall, First Ripe Fruit<br />
Distribution Area:<br />
Bloom time: Early spring<br />
Information sources:<br />
(1) <strong>The</strong> Jepson manual: higher plants of California. University of<br />
California Press.<br />
(2) USDA, NRCS. <strong>The</strong> PLANTS Database (plants.usda.gov)<br />
(3) Flora of North America Editorial Committee (www.fna.org/FNA/)<br />
(4) Missouri Botanical Garden. (www.mobot.org/gardeninghelp)<br />
Did you know? As the common name suggests,<br />
the husk (involucral tube) surrounding the nut<br />
extends beyond the nut by at least one inch to form<br />
a beak. Nuts ripen in late August and September<br />
and are edible, though most commercially-available<br />
hazelnuts come from hybrid plants.<br />
Map courtesy of USDA-NRCS PLANTS Database (plants.usda.gov)<br />
www.budburst.org<br />
© 2007-2009 University Corporation for Atmospheric Research All Rights Reserved
Beaked hazelnut (Corylus cornuta)<br />
Phenophase Field Guide<br />
Identification www.budburst.org<br />
Photo Needed!<br />
Share your photo<br />
of this phenophase.<br />
budburstweb@ucar.edu<br />
First Pollen<br />
Full Pollen<br />
End of Pollen<br />
First Leaf<br />
Photo Needed!<br />
Share your photo<br />
of this phenophase.<br />
budburstweb@ucar.edu<br />
All Leaves Unfolded First Ripe Fruit 50% Color 50% Leaf Fall<br />
First Pollen: Report the date at which the first flowers are dispersing pollen on three or more branches. You<br />
should be able to see the yellowish pollen on the surface of the catkins and see it when you gently touch the<br />
flowers.<br />
Full Pollen: Report the date when 50% of the branches with flowers have pollen.<br />
End of Pollen: Report the date when the last catkin has withered, dried up, and you no longer can see pollen<br />
when touching the surface. Catkins generally fall of branches shortly after end of pollen.<br />
First Leaf: Report the date at which the first leaves are completely unfolded from the bud on three or more<br />
branches. <strong>The</strong> leaves need to be opened completely and the leaf blade flat. Leaves normally emerge folded<br />
sideways (accordion-like) then flatten out and later expand to their mature size.<br />
All Leaves Unfolded: Report the date when nearly all (at least 95%) of the growing leaf buds have already<br />
reached the completely unfolded stage described above (First Leaf).<br />
First Ripe Fruit : Report the date when you notice the first fruits becoming fully ripe or seeds dropping naturally<br />
from 3 or more branches on the plant. Ripening is usually indicated by a change in color from green to<br />
brown and the scales opening on the catkins.<br />
50% Color: Report the date when 50% of the branches have leaves which have started to change color.<br />
50% Leaf Fall: Report the date when 50% of the leaves have fallen off the tree or shrub.<br />
Photographs courtesy of William S. Justice, John R. Seiler, USDA-NRCS PLANTS Database; Jorg and Mimi Fleige, www.westernwildflower.com;<br />
www.gaiser.org; Pat Breen, Oregon State University Landscape Plants, oregonstate.edu/dept/ldplants.<br />
Phenophase descriptions written by Paul Alaback, University of Montana.<br />
www.budburst.org<br />
© 2007-2009 University Corporation for Atmospheric Research All Rights Reserved
Pinyon pine (pinus edulis)<br />
Also Known As: Colorado pinyon, Two-leaf pinyon<br />
Plant Family: Pine (Pinaceae)<br />
Identification Guide<br />
Identification www.budburst.org<br />
Identification Hints: A distinct feature of Pinyon pine is that it has two<br />
needles per bundle. It is usually a short branched tree and can be a<br />
shrub. Its cones do not have spines. Other pinions, which are found in the<br />
southwestern US, usually have different numbers of needles in each bundle<br />
(fascicle).<br />
Did you know? Pinyon pine only needs about 12 to 18 inches of rainfall<br />
per year making it one of the most drought resistant species of pine. <strong>The</strong><br />
edible seeds, known as pinyon nuts, are highly prized for their delicate<br />
flavor. <strong>The</strong> seeds are harvested in the wild and sold commercially. Eaten<br />
raw, roasted, and in candies, they were once a staple food of southwestern<br />
Native people. Every autumn, local residents, especially Navajo Indians and<br />
Spanish-Americans, harvest quantities for the local and gourmet markets.<br />
Small pinyons are popular as Christmas trees.<br />
Phenological observations of interest: First Needles, First Pollen,<br />
Full Pollen, First Ripe Fruit<br />
General: Pinyon pine is one of those species that can<br />
be considered a tree or a shrub depending on its growth.<br />
As a tree, it is a relatively small native evergreen that<br />
grows to about 3 to 9 meters (10 to 30 feet) in height and<br />
has a single, strongly tapering trunk which can result in<br />
either a pyramidal or spreading shape. As a shrub, it is<br />
multi-stemmed, bushy, and sprawling. Pinyon pine is cold<br />
and drought tolerant and is very slow growing.<br />
Leaves: <strong>The</strong> curving evergreen needles are 2 to 4<br />
cm (0.7 to 1.6 inches) long and are found in ‘bundles’<br />
containing two needles. New growth is bluish-green<br />
turning to yellowish-green.<br />
Male Cones: Pinyon pines have cones that are found in<br />
clusters at the end of the branches. <strong>The</strong> male cones are<br />
found in clusters of 20 to 40 and are dark red to purplish<br />
red.<br />
Female Cones: Emerging female cones are purplish<br />
and solitary. Mature female cones are thick scaled and<br />
are light brown to tan in color. <strong>The</strong> cones usually contain<br />
about 8 or 10 small seeds. <strong>The</strong> seeds are light brown<br />
and wingless.<br />
Bark: <strong>The</strong> bark is shallowly and irregularly furrowed. It<br />
is gray to reddish brown. <strong>The</strong> trunk is often twisted and<br />
crooked. Twigs are smooth becoming rough and scaly<br />
branches as they mature.<br />
Habitat: Pinyon pine is found in the intermountain region<br />
of Wyoming, Utah, Colorado, Arizona and New Mexico<br />
east to Oklahoma and Texas. It does well on dry rocky<br />
soils and is often found mixed in with juniper on rocky<br />
mesas, plateaus, and dry mountain slopes.<br />
Bloom time: Pollen is present in late spring and<br />
early summer. It disperses for about 2 weeks. First<br />
year cone development stops around the last week of<br />
August. Cones reach their full size in July and mature by<br />
September of their second year. In late September and<br />
October, cones begin to open and seeds are dispersed.<br />
Distribution Area<br />
Compiled by Sandra Henderson and Paul Alaback<br />
Source: USDA Plants Database; Utah State University extension); Ladybird Johnson<br />
Wildflower Center Database<br />
Photograph by: Sally and Andy Wasowski, Lady Bird Johnson Wildflower Center<br />
www.budburst.org<br />
© 2007-2009 University Corporation for Atmospheric Research All Rights Reserved
Pinyon pine (Pinus edulis)<br />
Phenophase Field Guide<br />
Identification www.budburst.org<br />
Photo Needed!<br />
Share your photo<br />
of this phenophase.<br />
budburstweb@ucar.edu<br />
First Pollen<br />
Full Pollen<br />
First Needles<br />
First Ripe Fruit<br />
First Pollen: Report the date when the plant starts releasing the powdery, yellow pollen from their<br />
cones on three or more branches. If there is pollen you should see the pollen dust in the air or on<br />
your fingers when you gently touch the cones.<br />
Full Pollen: Report the date when 50% of the branches with cones have pollen.<br />
First Needles: Report when new needles emerge from tips of buds, or are visible from the side of<br />
the buds.<br />
First Ripe Fruit: Report the date when you notice the first fruits becoming fully ripe or seeds<br />
dropping naturally from the plant. Record when the cones turn brown and the scales expand on<br />
three or more branches (seeds should start dispersing shortly thereafter).<br />
Photographs courtesy of J.S. Peterson, Al Schneider, Susan McDougall, USDA-NRCS PLANTS Database, plants.usda.gov.<br />
Phenophase descriptions written by Paul Alaback, University of Montana.<br />
www.budburst.org<br />
© 2007-2009 University Corporation for Atmospheric Research All Rights Reserved
Ponderosa pine (Pinus ponderosa)<br />
Also Known As: Yellow pine, Western yellow pine, Bull pine<br />
Plant Family: Pine (Pinaceae)<br />
Identification Guide<br />
Identification www.budburst.org<br />
Identification Hints: Ponderosa pine is the iconic pine of the interior west, with<br />
its thick colorful bark which can be bright orange or yellow in color in open sunny<br />
spots. It is the only 3-needle pine in the Rockies. In California, and near its borders<br />
in Oregon and Nevada and in the Southwest there are other 3-needle pines and<br />
ornamental pines that can be confused with ponderosa. Jeffrey pine is very similar but<br />
usually has larger cones up to 38 cm (15 in), and purplish twigs (the twigs are orange<br />
to red in ponderosa). Jeffrey pine twigs have a pineapple-like odor. In Arizona and<br />
New Mexico Apache pine is found which has longer needles up to 38 cm (15 in).<br />
Did You Know? Ponderosa pine got its name because of its ponderous, or heavy,<br />
wood. It is one of the most widely distributed pines in western North America.<br />
Ponderosa pine is a major source of timber, which is especially suited for window<br />
frames and panel doors. Ponderosa pine forests are also important as wildlife habitat.<br />
Quail, nutcrackers, squirrels, and many other kinds of wildlife consume the seeds.<br />
Dispersal is aided by chipmunks that store the seeds in their caches.<br />
Phenological observations of interest: First Needles, First Pollen, Full Pollen,<br />
First Ripe Fruit<br />
General: Ponderosa pine is a large, long-lived native<br />
evergreen conifer that grows between 18 to 30.5 m (60 to<br />
100 ft) and frequently lives for over two hundred years. It<br />
is common throughout the western U.S. Young trees are<br />
narrow and pyramid shaped. As they mature, the crown<br />
becomes irregular in shape.<br />
Leaves: <strong>The</strong> curved, rigid needles are clustered in<br />
bundles of 3. <strong>The</strong>y can be dark green to yellow green.<br />
<strong>The</strong> needles remain attached and continue growing for<br />
approximately 5 years.<br />
Bark: When the tree is young, the bark is dark brown to<br />
nearly black. As the tree matures, the bark turns from<br />
cinnamon brown to orange-yellow at about 90 years of<br />
age. <strong>The</strong> bark of older trees is split into broad plates<br />
covered with small concave scales. <strong>The</strong> bark has a<br />
fragrance of vanilla or butterscotch.<br />
Cones: Male and female cones are separate but found<br />
on the same tree. Female cones are pineapple-shaped,<br />
7.6 to 15 cm (3 to 6 inches) long, and take 2 years to<br />
mature. <strong>The</strong>y are borne singly or in clusters of 3 to 5.<br />
<strong>The</strong>y are light reddish brown. <strong>The</strong> male cones are small,<br />
yellowish, and in clusters. <strong>The</strong> tips of the cone scales are<br />
armed with short, sharp, prickles that curve out.<br />
Fruit: <strong>The</strong> small seeds are about 0.6 cm (.25 in) long,<br />
with a broad terminal wing about 2.5 cm (1 in) long.<br />
Habitat: Ponderosa pine is found in rocky hills and<br />
low elevations in mountains. It is well adapted to grow<br />
on bare rock with its roots following crevices or cracks<br />
in the rocks. It needs sun and prefers deep moist welldrained<br />
soil, but will grow in a wide range of conditions.<br />
Ponderosa pine is drought and salt tolerant.<br />
Bloom time: First pollen is correlated closely with the<br />
passing of freezing weather and generally occurs in<br />
mid-Spring.<br />
Distribution Area<br />
Compiled by: Brooke McBride and Sara Mulder<br />
Sources:USDA Plant Database; <strong>USA</strong>-NPN; Lady Bird Johnson Wildflower<br />
Center; Preston, North American Trees; ECOS guide to the Ecology of the<br />
Northern Rockies; Utah State Extension<br />
Photograph by: Sally and Andy Wasowski, Lady Bird Johnson Wildflower<br />
Center<br />
www.budburst.org<br />
© 2007-2009 University Corporation for Atmospheric Research All Rights Reserved
Ponderosa pine (Pinus ponderosa)<br />
Phenophase Field Guide<br />
Identification www.budburst.org<br />
First Pollen<br />
Full Pollen<br />
First Needles<br />
First Ripe Fruit<br />
First Pollen: Report the date when the plant starts releasing the powdery, yellow pollen from their<br />
cones on three or more branches. If there is pollen you should see the pollen dust in the air or on<br />
your fingers when you gently touch the cones. Male cones are generally reddish in color and when<br />
pollen starts to disperse first needles start to appear<br />
Full Pollen: Report the date when 50% of the branches with cones have pollen.<br />
First Needles: Report when new needles emerge from tips of buds, or are visible from the side<br />
of the buds. First needles generally show green tips which grow out of brownish scales for each<br />
cluster of needles.<br />
First Ripe Fruit: Report the date when you notice the first fruits becoming fully ripe or seeds<br />
dropping naturally from the plant. Record when the cones turn brown and the scales expand on 3 or<br />
more branches (seeds should start dispersing shortly thereafter)<br />
Photographs courtesy of Paul Alaback, University of Montana.<br />
Phenophase descriptions written by Paul Alaback, University of Montana.<br />
www.budburst.org<br />
© 2007-2009 University Corporation for Atmospheric Research All Rights Reserved
Douglas-fir (Pseduotsuga menziessii)<br />
Also Known As: Interior douglas-fir, Coastal douglas-fir<br />
Plant Family: Pine (Pinaceae)<br />
Identification Guide<br />
Identification www.budburst.org<br />
Identification Hints: Douglas-firs are called firs because like firs they have a series of<br />
needles that are separately attached to the twigs as contrasted with pines or larches<br />
which have needles in bundles (fascicles) or spurs. Pointed red buds distinguish Douglasfirs<br />
from true firs, such as grand-fir (Abies grandis) and subalpine fir (Abies lasiocarpa).<br />
True firs have sticky rounded green to whitish buds. True firs also have more stiff rounded<br />
needles (with a tiny notch at the tip), and cones which are erect and born on the upper<br />
sides of branches. <strong>The</strong> most distinctive feature of Douglas-firs are the “mouse-tails” or<br />
exerted bracts on the cone scales, which extend outside of scales and have long narrow<br />
point (the tail).<br />
Did You Know? Douglas-fir is the one of the most valuable lumber trees in the world. <strong>The</strong><br />
wood is used as poles, beams, in bridges, as rail road ties, structural timber, in plywood,<br />
and to make furniture. It is found in many homes every December as a popular Christmas<br />
tree. Native Americans used the resin as an antiseptic in the treatment of burns, scrapes,<br />
and rashes. European explorers often placed young shoots in their boots to prevent<br />
athlete’s foot and nail fungus. <strong>The</strong> tallest Douglas-fir on recored is 100 meters (330 feet)<br />
high! This long lived species can exceed 1,000 years of age.<br />
Phenophases of Interest: First Needles, First Pollen, Full Pollen, First Ripe Fruit<br />
General: Large, native, coniferous evergreen tree with<br />
a broad, pointed pyramidal crown. It is one of the worlds’<br />
tallest trees, commonly reaching over 76 meters (250<br />
feet) in height.<br />
Leaves: Small, crowded, flat, straight evergreen needles<br />
that are spirally arranged, but can appear flattened in 2<br />
rows due to twisting at the base. <strong>The</strong>y are 2 to 3 cm (0.8<br />
to-1.3 inches) long, pointed at the tip. <strong>The</strong> needles are<br />
flexible and soft to touch, dark yellowish green to bluegreen<br />
in color and aromatic when crushed.<br />
Bark: On young trees, the bark is gray or ashy-brown<br />
and thin and smooth with distinctive resin blisters. As the<br />
tree matures, the color becomes more grayish-brown<br />
with deep and irregular ridges and fissures and develops<br />
distinctive thick bark, which can be many inches thick in<br />
older trees<br />
Male Cones: As a conifer, Douglas-fir does not have true<br />
flowers. It produces male and female cones on trees at<br />
least 12 to 15 years old. Male cones are yellow to deep<br />
red located at branch tips and are about 2.5 cm (1 in)<br />
long.<br />
Female Cones: Female cones are approximately 3 cm<br />
(1.2 inches) long and green to deep red, they have large<br />
distinctive leaf-like bracts and occur along the sides of<br />
branch tips.<br />
www.budburst.org<br />
Fruit: <strong>The</strong>y are 8 to 10 cm (3 to 4 inches) long, ovoidcylindrical<br />
cones that are pendant and green to reddish<br />
brown with semi-woody scales. A distinctive feature<br />
is the 3-pronged bract that extends beyond the scales<br />
(sometimes referred to as “the mouse tail”).<br />
Habitat: Grows best in well drained, deep, moist soils,<br />
but can also exist in dry soils. Often in pure conifer<br />
forests or in transition zones with the forest and found<br />
from dry grassy valleys to timberline.<br />
Bloom time: Blooms (pollen disperses) in mid spring<br />
(March-April in southern range, May-June in Montana or<br />
at higher elevations). Dispersal generally occurs between<br />
mid August and late September depending on elevation<br />
and latitude. Distribution Area<br />
Compiled By: Paul Alaback and Sandra Henderson<br />
Sources: USDA Plants Database; Preston, North American Trees; ECOS<br />
guide to the Ecology of the Northern Rockies; Uconn Plant Database<br />
Photograph by: Walter Siegmund, Wikimedia Commons<br />
© 2007-2009 University Corporation for Atmospheric Research All Rights Reserved
Douglas-fir (Pseudotsuga menziesii)<br />
Phenophase Field Guide<br />
Identification www.budburst.org<br />
Photo Needed!<br />
Share your photo<br />
of this phenophase.<br />
budburstweb@ucar.edu<br />
First Pollen<br />
Full Pollen<br />
First Needles<br />
First Ripe Fruit<br />
First Pollen: Report the date when the plant starts releasing the powdery, yellow pollen from their<br />
cones on three or more branches. If there is pollen you should see the pollen dust in the air or on<br />
your fingers when you gently touch the flowers. This often occurs before first needles.<br />
Full Pollen: Report the date when 50% of the branches with cones have pollen.<br />
First Needles: Report when green tips of needles emerge from buds, or are visible from the side of<br />
the buds.<br />
First Ripe Fruit: Report the date when you notice the first fruits becoming fully ripe or seeds<br />
dropping naturally from the plant. Record when the cones on three or more branches turn brown<br />
and the scales expand (seeds should start dispersing shortly thereafter).<br />
Photographs courtesy of Paul Alaback, University of Montana<br />
Phenophase descriptions written by Paul Alaback, University of Montana.<br />
www.budburst.org<br />
© 2007-2009 University Corporation for Atmospheric Research All Rights Reserved