The Reporting of the Findings of Student Statistics ... - MAA Sections
The Reporting of the Findings of Student Statistics ... - MAA Sections
The Reporting of the Findings of Student Statistics ... - MAA Sections
You also want an ePaper? Increase the reach of your titles
YUMPU automatically turns print PDFs into web optimized ePapers that Google loves.
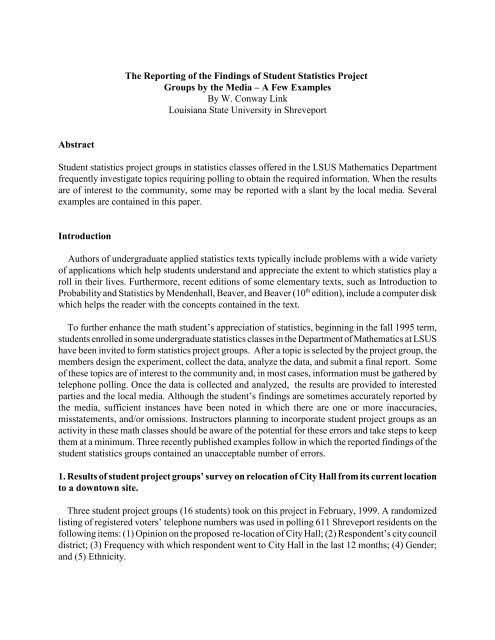
<strong>The</strong> <strong>Reporting</strong> <strong>of</strong> <strong>the</strong> <strong>Findings</strong> <strong>of</strong> <strong>Student</strong> <strong>Statistics</strong> Project<br />
Groups by <strong>the</strong> Media – A Few Examples<br />
By W. Conway Link<br />
Louisiana State University in Shreveport<br />
Abstract<br />
<strong>Student</strong> statistics project groups in statistics classes <strong>of</strong>fered in <strong>the</strong> LSUS Ma<strong>the</strong>matics Department<br />
frequently investigate topics requiring polling to obtain <strong>the</strong> required information. When <strong>the</strong> results<br />
are <strong>of</strong> interest to <strong>the</strong> community, some may be reported with a slant by <strong>the</strong> local media. Several<br />
examples are contained in this paper.<br />
Introduction<br />
Authors <strong>of</strong> undergraduate applied statistics texts typically include problems with a wide variety<br />
<strong>of</strong> applications which help students understand and appreciate <strong>the</strong> extent to which statistics play a<br />
roll in <strong>the</strong>ir lives. Fur<strong>the</strong>rmore, recent editions <strong>of</strong> some elementary texts, such as Introduction to<br />
Probability and <strong>Statistics</strong> by Mendenhall, Beaver, and Beaver (10 th edition), include a computer disk<br />
which helps <strong>the</strong> reader with <strong>the</strong> concepts contained in <strong>the</strong> text.<br />
To fur<strong>the</strong>r enhance <strong>the</strong> math student’s appreciation <strong>of</strong> statistics, beginning in <strong>the</strong> fall 1995 term,<br />
students enrolled in some undergraduate statistics classes in <strong>the</strong> Department <strong>of</strong> Ma<strong>the</strong>matics at LSUS<br />
have been invited to form statistics project groups. After a topic is selected by <strong>the</strong> project group, <strong>the</strong><br />
members design <strong>the</strong> experiment, collect <strong>the</strong> data, analyze <strong>the</strong> data, and submit a final report. Some<br />
<strong>of</strong> <strong>the</strong>se topics are <strong>of</strong> interest to <strong>the</strong> community and, in most cases, information must be ga<strong>the</strong>red by<br />
telephone polling. Once <strong>the</strong> data is collected and analyzed, <strong>the</strong> results are provided to interested<br />
parties and <strong>the</strong> local media. Although <strong>the</strong> student’s findings are sometimes accurately reported by<br />
<strong>the</strong> media, sufficient instances have been noted in which <strong>the</strong>re are one or more inaccuracies,<br />
misstatements, and/or omissions. Instructors planning to incorporate student project groups as an<br />
activity in <strong>the</strong>se math classes should be aware <strong>of</strong> <strong>the</strong> potential for <strong>the</strong>se errors and take steps to keep<br />
<strong>the</strong>m at a minimum. Three recently published examples follow in which <strong>the</strong> reported findings <strong>of</strong> <strong>the</strong><br />
student statistics groups contained an unacceptable number <strong>of</strong> errors.<br />
1. Results <strong>of</strong> student project groups’ survey on relocation <strong>of</strong> City Hall from its current location<br />
to a downtown site.<br />
Three student project groups (16 students) took on this project in February, 1999. A randomized<br />
listing <strong>of</strong> registered voters’ telephone numbers was used in polling 611 Shreveport residents on <strong>the</strong><br />
following items: (1) Opinion on <strong>the</strong> proposed re-location <strong>of</strong> City Hall; (2) Respondent’s city council<br />
district; (3) Frequency with which respondent went to City Hall in <strong>the</strong> last 12 months; (4) Gender;<br />
and (5) Ethnicity.
<strong>The</strong> polling produced several noteworthy results:(1) Of <strong>the</strong> 611 registered voters responding,<br />
54.7% (334/611) did not visit City Hall at all during <strong>the</strong> previous 12-month period and 88.7%<br />
(542/611) visited City Hall six times or less during <strong>the</strong> same 12-month period; (2) Only nine <strong>of</strong><br />
<strong>the</strong> 611 (1.5%) responding went to City Hall more than 50 times during <strong>the</strong> previous 12 months, and<br />
it was reported by <strong>the</strong> students that three <strong>of</strong> <strong>the</strong>se nine were employed at City Hall, making <strong>the</strong><br />
reason for <strong>the</strong>ir more-than-fifty trips quite obvious; (3) Over 80 % <strong>of</strong> <strong>the</strong> respondents did not know<br />
<strong>the</strong> city council district in which <strong>the</strong>y resided, making it impossible to do a breakdown on <strong>the</strong><br />
relocation question by city council district.<br />
Along with a cover letter, tables giving frequencies within categories and a collection <strong>of</strong> SPSS<br />
8.0 Crosstabs tables with <strong>the</strong> typical cross-classifications and breakdowns were provided to <strong>the</strong><br />
Mayor’s <strong>of</strong>fice and <strong>the</strong> local newspaper. <strong>The</strong>re was a considerable amount <strong>of</strong> information which<br />
could be reported, including opinion <strong>of</strong> <strong>the</strong> proposed re-location move by gender, race, and frequency<br />
<strong>of</strong> visits to City Hall.<br />
When reporting <strong>the</strong> students’ findings, however, <strong>the</strong> local newspaper looked at only three items:<br />
(1) <strong>The</strong> response to <strong>the</strong> overall re-location question (in favor <strong>of</strong>, opposed to, no opinion); (2) <strong>The</strong><br />
percent <strong>of</strong> respondents who did not know <strong>the</strong> city council district in which <strong>the</strong>y lived; and (3) <strong>The</strong><br />
opinion <strong>of</strong> those respondents who visited City Hall more than 50 times in <strong>the</strong> last 12 months. Each<br />
<strong>of</strong> <strong>the</strong> reported statistics were correct, but <strong>the</strong> reason to report (2) and (3) and <strong>the</strong>n to omit a mention<br />
<strong>of</strong> <strong>the</strong> opinion <strong>of</strong> those who seldom visit City Hall (six or less times in <strong>the</strong> last 12 months -- 88.7%<br />
<strong>of</strong> those polled) was not apparent. In fact, in <strong>the</strong> news story, <strong>the</strong> percent <strong>of</strong> frequent visitors who<br />
favored such a move was emphasized: “... those who visited City Hall <strong>the</strong> most were more likely to<br />
favor <strong>the</strong> move. Seventy-eight percent <strong>of</strong> those who said <strong>the</strong>y visit City Hall more than 50 times a<br />
year wanted to see a downtown location.”<br />
2. Results <strong>of</strong> student project groups’ survey on public support for a zoo, and preservation <strong>of</strong><br />
public landmarks.<br />
<strong>The</strong> headline for this story, “Poll shows support for zoo, city landmarks,” published December<br />
28, 1999, is misleading. It implies that <strong>the</strong>re was only one poll. Actually, <strong>the</strong>re were two separate<br />
polls -- one with three questions on public landmarks and downtown greenspace and six questions<br />
concerning regarding Wal Mart’s proposed site in a residential area, hereafter referred to as Survey<br />
1. <strong>The</strong> second poll (Survey 2) had three questions about a proposed zoo and six questions regarding<br />
<strong>the</strong> mandatory wearing <strong>of</strong> uniforms in Caddo Parish public schools. <strong>The</strong> news story also contained<br />
<strong>the</strong> following errors, misstatements, and omissions.<br />
a. According to <strong>the</strong> story, “more than 400 registered voters” responded to <strong>the</strong> survey. Actually, 434<br />
registered voters agreed to participate in Survey 1, but <strong>the</strong> number who responded to <strong>the</strong> three<br />
questions on public landmarks and downtown greenspace ranged from 405 to 431. <strong>The</strong>re were 499<br />
registered voters who agreed to participate in Survey 2, and <strong>the</strong> number <strong>of</strong> persons responding to <strong>the</strong><br />
three questions on <strong>the</strong> zoo topic ranged from 450 to 463.<br />
b. Although <strong>the</strong> news story correctly reported <strong>the</strong> percent in favor (62.1%) on <strong>the</strong> support for city
landmarks question, <strong>the</strong> percent opposed (15.1%) was omitted, as well as <strong>the</strong> percent who had no<br />
opinion. When only <strong>the</strong> 62% in favor is reported, <strong>the</strong> reader likely assumes that 37.9% were<br />
opposed, a 1.64 to 1 margin, considerably different from <strong>the</strong> actual 4.11 to 1 margin.<br />
c. <strong>The</strong> time period over which <strong>the</strong> surveys were taken was not specifically mentioned, but reported<br />
as “a recent poll.” <strong>The</strong> surveys were done in early November, 1999.<br />
d. No margin <strong>of</strong> error was given in <strong>the</strong> news story, although <strong>the</strong> information was given to <strong>the</strong><br />
reporter.<br />
e. <strong>The</strong> results <strong>of</strong> perhaps <strong>the</strong> most controversial issues, Wal-Mart’s intrusion into a residential<br />
neighborhood and downtown greenspace, were omitted.<br />
3. Results <strong>of</strong> student project groups’ survey on mandatory wearing <strong>of</strong> uniforms in Caddo<br />
Parish public schools.<br />
<strong>The</strong> results <strong>of</strong> this telephone survey were included in a February 16, 2000 story on <strong>the</strong><br />
deliberations <strong>of</strong> <strong>the</strong> Caddo Parish School Board regarding <strong>the</strong> implementation <strong>of</strong> a policy for <strong>the</strong><br />
mandatory wearing <strong>of</strong> uniforms in <strong>the</strong> public schools. <strong>The</strong> following errors, misstatements, and<br />
omissions in <strong>the</strong> news story were noted.<br />
a. <strong>The</strong> poll was identified only as a “random poll.” In reality, <strong>the</strong> poll was done by telephone from<br />
a a randomized list <strong>of</strong> telephone numbers <strong>of</strong> registered Shreveport voters.<br />
b. <strong>The</strong> news story reported <strong>the</strong> results <strong>of</strong> “three <strong>of</strong> nine questions asked.” In fact <strong>the</strong>re were only six<br />
survey questions on <strong>the</strong> uniform issue. <strong>The</strong> remaining three questions concerned public support for<br />
a zoo, <strong>the</strong> findings <strong>of</strong> which were reported on December 28.<br />
c. According to <strong>the</strong> story, “nearly 500 people responded to <strong>the</strong> survey.” Although 499 persons agreed<br />
to participate, <strong>the</strong> number <strong>of</strong> persons responding to <strong>the</strong> six questions ranged from 463 to 499.<br />
d. No margin <strong>of</strong> error was given in <strong>the</strong> news story, although <strong>the</strong> information was given to <strong>the</strong><br />
reporter.<br />
e. <strong>The</strong> percent response for “not enough information” for one question was not given, although it was<br />
given for <strong>the</strong> o<strong>the</strong>r two.<br />
f. <strong>The</strong> question regarding decrease in violence and school uniforms was omitted from <strong>the</strong> story. This<br />
was one <strong>of</strong> <strong>the</strong> most important questions on <strong>the</strong> survey.<br />
g. One <strong>of</strong> <strong>the</strong> paragraphs in <strong>the</strong> story was unintelligible.
Summary<br />
<strong>The</strong> evaluation <strong>of</strong> published news stories based on <strong>the</strong> students project groups, findings is mixed.<br />
<strong>The</strong> procedure used to determine what information from <strong>the</strong> reports should be printed and what<br />
should be omitted is unclear. <strong>The</strong> reader will be unaware <strong>of</strong> what was omitted, unless, <strong>of</strong> course, <strong>the</strong><br />
reader is <strong>the</strong> instructor or one <strong>of</strong> <strong>the</strong> group members who collected <strong>the</strong> data.<br />
<strong>The</strong> inaccuracies, misstatements, and omissions noted in <strong>the</strong> three news stories range from minor<br />
to moderate. <strong>The</strong> omission <strong>of</strong> <strong>the</strong> margin <strong>of</strong> error in two <strong>of</strong> <strong>the</strong>se news stories is a concern. Even if<br />
a reader knew how to calculate <strong>the</strong> margin <strong>of</strong> error, it would be impossible in <strong>the</strong>se instances since<br />
<strong>the</strong> sample sizes given were so vague. Certainly a sample size <strong>of</strong> 499 is close to a sample size <strong>of</strong><br />
“nearly 500 people,” but <strong>the</strong> reader would have no way <strong>of</strong> knowing how close to 500 <strong>the</strong> sample was,<br />
or that <strong>the</strong> number <strong>of</strong> responses ranged from 463 to 499. Fur<strong>the</strong>rmore, “more than 400 registered<br />
voters” is somewhat different than <strong>the</strong> actual number <strong>of</strong> respondents which ranged from 450 to 463<br />
on <strong>the</strong> individual questions.<br />
Should a ma<strong>the</strong>matics instructor choose to incorporate <strong>the</strong> student project groups concept in<br />
statistics classes and release findings <strong>of</strong> a telephone poll to <strong>the</strong> media, it is recommended that <strong>the</strong><br />
instructor have available for <strong>the</strong> reporter all pertinent tables, graphs, telephone logs, and<br />
questionnaires, each accompanied by a written explanation <strong>of</strong> anything that could be misunderstood<br />
by <strong>the</strong> reporter. Perhaps this will help reduce <strong>the</strong> number <strong>of</strong> errors in <strong>the</strong> published news story.


