Nov 2009 - NEWS (The NASA Energy and Water cycle Study)
Nov 2009 - NEWS (The NASA Energy and Water cycle Study)
Nov 2009 - NEWS (The NASA Energy and Water cycle Study)

Create successful ePaper yourself
Turn your PDF publications into a flip-book with our unique Google optimized e-Paper software.
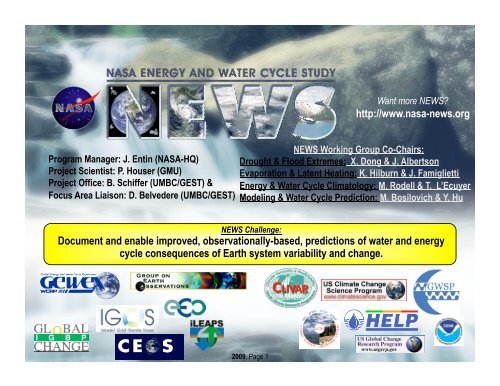
Want more <strong>NEWS</strong>?<br />
http://www.nasa-news.org<br />
Program Manager: J. Entin (<strong>NASA</strong>-HQ)<br />
Project Scientist: P. Houser (GMU)<br />
Project Office: B. Schiffer (UMBC/GEST) &<br />
Focus Area Liaison: D. Belvedere (UMBC/GEST)<br />
<strong>NEWS</strong> Working Group Co-Chairs:<br />
Drought & Flood Extremes: X. Dong & J. Albertson<br />
Evaporation & Latent Heating: K. Hilburn & J. Famiglietti<br />
<strong>Energy</strong> & <strong>Water</strong> Cycle Climatology: M. Rodell & T. L’Ecuyer<br />
Modeling & <strong>Water</strong> Cycle Prediction: M. Bosilovich & Y. Hu<br />
<strong>2009</strong>, Page 1
Is the water <strong>cycle</strong> accelerating?<br />
Why study the water & <strong>Energy</strong> <strong>cycle</strong>?<br />
1. <strong>Water</strong> exists in all three phases in the climate<br />
system <strong>and</strong> the phase transitions are a<br />
significant factor in the regulation of the global<br />
<strong>and</strong> regional energy balances<br />
2. <strong>Water</strong> vapor in the atmosphere is the principal<br />
greenhouse gas <strong>and</strong> clouds at various levels <strong>and</strong><br />
composition in the atmosphere represent both<br />
positive <strong>and</strong> negative feedback in climate system<br />
response<br />
3. <strong>Water</strong> is the ultimate solvent <strong>and</strong> global<br />
biogeochemical <strong>and</strong> element <strong>cycle</strong>s are mediated<br />
by the dynamics of the water <strong>cycle</strong><br />
Why <strong>NEWS</strong>?<br />
Need the collective of <strong>NASA</strong> & community<br />
information <strong>and</strong> expertise to ask (<strong>and</strong><br />
define) the larger questions<br />
(aka) Need the whole to be more than the<br />
sum of the parts<br />
4. <strong>Water</strong> is the element of the Earth system that most<br />
directly impacts <strong>and</strong> constraint human society<br />
<strong>and</strong> its well-being.<br />
<strong>2009</strong>, Page 2
<strong>NEWS</strong> Constraints<br />
• Focus on energy <strong>and</strong> water processes <strong>and</strong> dynamics in the climate system.<br />
• <strong>The</strong> <strong>NEWS</strong> challenge is a global scale objective<br />
• Integrate energy <strong>and</strong> water <strong>cycle</strong> system components (observations <strong>and</strong> predictions)<br />
• <strong>NEWS</strong> elements: Observation, Underst<strong>and</strong>ing, Models, Prediction <strong>and</strong> Consequences<br />
• Make decisive progress toward <strong>NEWS</strong> challenge<br />
• <strong>NASA</strong> administers the energy <strong>and</strong> water <strong>cycle</strong> focus area as an end-to-end program<br />
• <strong>NEWS</strong> is an experiment in the power of coordination, integration <strong>and</strong> teamwork<br />
<strong>NEWS</strong> Objectives:<br />
• Develop <strong>and</strong> deploy experimental E&WC global observing system<br />
• Document the global E&WC by obtaining complete observational record of all associated relevant<br />
geophysical properties<br />
• Build fully interactive global climate model that encompasses process-level E&WC forcings <strong>and</strong><br />
feedbacks – Climate models that can predict weather-scale extremes<br />
• Create global surface <strong>and</strong> atmosphere data assimilation system for E&WC variables<br />
• Assess variability of the global E&WC on time scales ranging from seasonal to decadal, <strong>and</strong> space<br />
scales ranging from regional to continental to global<br />
• Support the application of climate prediction capabilities for estimating the impact of climate<br />
variability <strong>and</strong> change on water resources<br />
<strong>2009</strong>, Page 3
-<br />
<strong>2009</strong>, Page 4
-<br />
• Rainfall over eastern Africa <strong>and</strong> the Indian subcontinent are strongly correlated with<br />
patterns in water vapor transport over the Indian ocean; the example above shows<br />
the correlation for Kenya<br />
• Chris Funk is using water vapor transport data developed by <strong>NEWS</strong> to monitor <strong>and</strong><br />
predict rain anomalies over Africa <strong>and</strong> India<br />
• Kyle Hilburn (working with Chris) has developed an experimental version of his<br />
water vapor transport dataset using QuikSCAT data to provide on-going climate<br />
monitoring capabilities updated every 10 days; these data are being evaluated by<br />
Chris<br />
<strong>2009</strong>, Page 5
Science issue: Determine recent climatology of<br />
extremes in precip as a first step in<br />
characterizing the satellite-era record <strong>and</strong><br />
seeking fluctuations/trends<br />
Approach: Test a range of definitions of<br />
“extreme” with high quality satellite data sets<br />
<strong>and</strong> gauge validation<br />
Satellite-based data: TRMM Multi-satellite<br />
Precipitation Analysis (TMPA) 3-hr data<br />
Project status: With funding by <strong>NEWS</strong> <strong>and</strong> PMM,<br />
G.J. Huffman (SSAI; GSFC), R.F. Adler (UMD;<br />
GSFC)<br />
• Developed 11-year climatologies for several<br />
st<strong>and</strong>ard “extremes” variables<br />
• Demonstrated reasonable behavior against 6<br />
years - of gauge data for various climate zones<br />
• Worked to select stable definitions of<br />
“extreme”; generally parameters depending on<br />
a few values<br />
are less stable than<br />
those using more data<br />
• Beginning to examining seasonality of<br />
“extremes” parameters<br />
Huffman, G.J., R.F. Adler, D.T. Bolvin, E.J. Nelkin, 2008: Validation <strong>and</strong> Analysis of<br />
Precipitation Extremes in the TMPA. 4 th Workshop of the IPWG, 13-17 October 2008,<br />
Beijing, China, http://www.isac.cnr.it/~ipwg/ meetings/beijing/4th-IPWG-Proceedings<br />
-web-March-<strong>2009</strong>.pdf, 154-161; http://www.isac.cnr.it/~ipwg/meetings/beijing/pres<br />
/Huffman.ppt.<br />
Avg. Precip (mm/d) 0 3 6 9 12 15+<br />
R95p (mm/d) 0 20 40 60 80 100+<br />
CDDavg (days) 0 100 200 300 400 500+<br />
Example “extremes” in daily precip from the TMPA for 1998-2008:<br />
rain rate for the 95th percentile (R95p; middle); average longest<br />
run of dry days in a year (CDDavg; bottom). Although closely<br />
related to the avg. precip (top), there are important <strong>and</strong><br />
interesting differences, such as the R95p maxima on the<br />
southern coast of Mexico <strong>and</strong> in South America’s la Plata basin,<br />
<strong>and</strong> the small CDDavg gradient in the SPCZ.<br />
<strong>2009</strong>, Page 6