Flash Flood Risk Management â A Training of Trainers ... - ReliefWeb
Flash Flood Risk Management â A Training of Trainers ... - ReliefWeb
Flash Flood Risk Management â A Training of Trainers ... - ReliefWeb

Create successful ePaper yourself
Turn your PDF publications into a flip-book with our unique Google optimized e-Paper software.
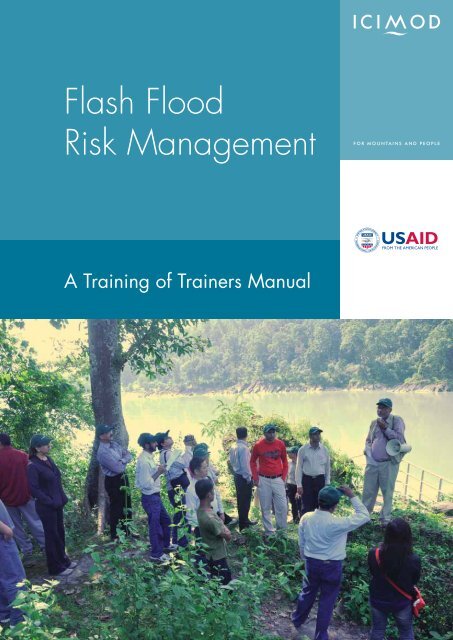
<strong>Flash</strong> <strong>Flood</strong><br />
<strong>Risk</strong> <strong>Management</strong><br />
A <strong>Training</strong> <strong>of</strong> <strong>Trainers</strong> Manual
<strong>Flash</strong> <strong>Flood</strong> <strong>Risk</strong> <strong>Management</strong><br />
A <strong>Training</strong> <strong>of</strong> <strong>Trainers</strong> Manual<br />
Prepared by<br />
Arun Bhakta Shrestha<br />
Prem Sagar Chapagain<br />
Rajesh Thapa<br />
International Centre for Integrated Mountain Development, Kathmandu, 2011
Published by<br />
International Centre for Integrated Mountain Development<br />
GPO Box 3226, Kathmandu, Nepal<br />
Copyright © 2011<br />
International Centre for Integrated Mountain Development (ICIMOD)<br />
All rights reserved. Published 2011<br />
ISBN<br />
978 92 9115 222 3 (printed)<br />
978 92 9115 223 0 (electronic)<br />
LCCN 2011-312016<br />
Photos: Cover, p118, Sundar Rai; p6, Partha Das; p114, Arun B Shrestha<br />
Printed and bound in Nepal by<br />
Hill Side Press (P) Ltd., Kathmandu, Nepal<br />
Production team<br />
Isabella Bassignana-Khadka (Consultant editor)<br />
Andrea Perlis (Senior editor)<br />
Dharma R Maharjan (Layout and design)<br />
Asha Kaji Thaku (Editorial assistant)<br />
Note<br />
This publication may be reproduced in whole or in part and in any form for educational or non-pr<strong>of</strong>it purposes without special<br />
permission from the copyright holder, provided acknowledgement <strong>of</strong> the source is made. ICIMOD would appreciate receiving a<br />
copy <strong>of</strong> any publication that uses this publication as a source. No use <strong>of</strong> this publication may be made for resale or for any other<br />
commercial purpose whatsoever without prior permission in writing from ICIMOD.<br />
The views and interpretations in this publication are those <strong>of</strong> the author(s). They are not attributable to ICIMOD and do not imply<br />
the expression <strong>of</strong> any opinion concerning the legal status <strong>of</strong> any country, territory, city or area <strong>of</strong> its authorities, or concerning the<br />
delimitation <strong>of</strong> its frontiers or boundaries, or the endorsement <strong>of</strong> any product.<br />
This publication is available in electronic form at www.icimod.org/publications<br />
Citation: Shrestha, AB; Chapagain, PS; Thapa, R (2011) <strong>Flash</strong> flood risk management – A training <strong>of</strong> trainers manual.<br />
Kathmandu: ICIMOD
Contents<br />
Foreword<br />
Acknowledgements<br />
Acronyms and Abbreviations<br />
iv<br />
v<br />
vi<br />
Introduction 1<br />
About This Manual 2<br />
How to Use This Manual 2<br />
Course Structure 3<br />
Materials for the Workshop 3<br />
Suggested Schedule 5<br />
Day 1 7<br />
Session 1: Introduction 8<br />
Session 2: <strong>Flash</strong> <strong>Flood</strong> Hazards in the HKH Region 13<br />
Session 3: Types, Causes, and Impacts <strong>of</strong> <strong>Flash</strong> <strong>Flood</strong>s 20<br />
Session 4: <strong>Flash</strong> <strong>Flood</strong> Hazard Analysis and Assessment 27<br />
Day 2 31<br />
Session 5: Vulnerability and <strong>Flash</strong> <strong>Flood</strong> <strong>Risk</strong> Assessment 32<br />
Session 6: Local Knowledge on Disaster <strong>Management</strong> 36<br />
Session 7: Community-Based <strong>Flash</strong> <strong>Flood</strong> <strong>Risk</strong> <strong>Management</strong> 45<br />
Session 8: Gender Perspectives in Disaster <strong>Management</strong> 53<br />
Session 9: Social Hazard Mapping and <strong>Risk</strong> Assessment 56<br />
Day 3 63<br />
Session 10: Non-Structural Measures for <strong>Flash</strong> <strong>Flood</strong> <strong>Risk</strong> <strong>Management</strong> 64<br />
Session 11: Modelling Tools for <strong>Flash</strong> <strong>Flood</strong> <strong>Management</strong> 70<br />
Session 12: Integrated <strong>Flash</strong> <strong>Flood</strong> and Watershed <strong>Management</strong> 74<br />
Session 13: Hazard-Specific <strong>Flash</strong> <strong>Flood</strong> <strong>Management</strong>: Intense Rainfall <strong>Flood</strong>s 81<br />
Session 14: Hazard-Specific <strong>Flash</strong> <strong>Flood</strong> <strong>Management</strong>: Landslide Dam Outburst <strong>Flood</strong>s 90<br />
Day 4 103<br />
Session 15: Country Presentations 104<br />
Session 16: Hazard-Specific <strong>Flash</strong> <strong>Flood</strong> <strong>Management</strong>: Glacial Lake Outburst <strong>Flood</strong>s 105<br />
Days 5, 6, and 7 117<br />
Field Trip 117<br />
Day 8 119<br />
Session 17: Legal and Institutional Issues <strong>of</strong> Integrated <strong>Flood</strong> <strong>Risk</strong> <strong>Management</strong> 120<br />
Session 18: <strong>Flash</strong> <strong>Flood</strong> <strong>Management</strong> Cycle – Preparedness 128<br />
Session 19: <strong>Flash</strong> <strong>Flood</strong> <strong>Management</strong> Cycle – Response and Recovery 135<br />
Session 20: Overall Discussion 145<br />
Session 21: <strong>Training</strong> Evaluation and Closing Session 146<br />
References 148
Foreword<br />
The Hindu Kush-Himalayan (HKH) region is a prominent physiographic feature <strong>of</strong> our planet. As the youngest<br />
mountain system in the world, it has unstable geological conditions and a steep topography, which,<br />
combined with frequent extreme weather conditions, makes the region prone to many different natural<br />
hazards from landslides, avalanches, and earthquakes, to massive snowfalls and flooding. Among these,<br />
flash floods are particularly challenging for communities.<br />
<strong>Flash</strong> floods are severe flood events that occur with little warning. They can be triggered by intense rainfall,<br />
failure <strong>of</strong> natural or artificial dams, and outbursts <strong>of</strong> glacial lakes. The frequent occurrence <strong>of</strong> flash floods in<br />
the Hindu Kush-Himalayan region poses a severe threat to lives, livelihoods, and infrastructure, both in the<br />
mountains and downstream. Vulnerable groups such as the poor, women, children, the elderly, and people<br />
with disabilities are <strong>of</strong>ten the hardest hit. <strong>Flash</strong> floods tend to carry with them much higher amounts <strong>of</strong> debris<br />
than normal floods and as a result cause more damage to hydropower stations, roads, bridges, buildings,<br />
and other infrastructure.<br />
Since its establishment in 1983, ICIMOD has explored different ways to reduce the risk <strong>of</strong> disasters from<br />
natural hazards and to reduce the physical and social vulnerability <strong>of</strong> the people in the region. Approaches<br />
have included training courses, hazard mapping, and vulnerability assessments in the region as well as<br />
fostering dialogue among stakeholders and developing materials for capacity building.<br />
ICIMOD, in collaboration with various partners, has compiled and published resource materials on flash<br />
flood risk management in order to support capacity development and to support the training <strong>of</strong> planners<br />
and practitioners. These materials, after having been tested with various groups, have now been converted<br />
into this <strong>Training</strong> <strong>of</strong> <strong>Trainers</strong> Manual with the objective <strong>of</strong> disseminating the capacity to a larger number <strong>of</strong><br />
practitioners. The present publication was produced as part <strong>of</strong> the project ‘<strong>Flash</strong> <strong>Flood</strong> <strong>Risk</strong> Reduction –<br />
Strengthening Capacity in the Hindu Kush-Himalayas’, supported by the United States Agency for International<br />
Development, Office for Foreign Disaster Assistance (USAID/OFDA). While this manual is a small step, we<br />
hope that it will contribute meaningfully towards reducing disaster risk and providing greater physical security<br />
for the people <strong>of</strong> this vulnerable region.<br />
David Molden<br />
Director General, ICIMOD
Acknowledgements<br />
This manual is an output <strong>of</strong> the project ‘<strong>Flash</strong> <strong>Flood</strong> <strong>Risk</strong> Reduction – Strengthening Capacity in the Hindu<br />
Kush-Himalayas’, which was supported by the United States Agency for International Development, Office for<br />
Foreign Disaster Assistance (USAID/OFDA).<br />
We are grateful to several colleagues who have contributed to this manual and to all the resource persons<br />
who supported the <strong>Training</strong> <strong>of</strong> <strong>Trainers</strong> Workshop which was instrumental in improving it. Pr<strong>of</strong>essor Narendra<br />
Raj Khanal <strong>of</strong> Tribhuvan University, Mr Sagar Ratna Bajracharya, and Mr Sundar Kumar Rai <strong>of</strong> ICIMOD<br />
provided important input to the workshop and helped in preparing the draft <strong>of</strong> the manual. Dr Wolfgang Eric<br />
Grabs and Dr Giacomo Teruggi <strong>of</strong> the World Meteorological Organization (WMO) contributed significantly<br />
to the workshop and supported us with resource material. Practical Action Nepal provided support on the<br />
field visit.<br />
Sincere thanks go to Pr<strong>of</strong>essor Hua Ouyang, ICIMOD’s Programme Manager for Integrated Water and<br />
Hazard <strong>Management</strong>, for seeing through the completion <strong>of</strong> the module and to all the staff <strong>of</strong> this programme<br />
who were supportive during the preparation <strong>of</strong> the manual. Our heartfelt thanks also go to the many other<br />
colleagues, both within and outside ICIMOD, who read the manuscript and provided valuable comments and<br />
suggestions.
Acronyms and Abbreviations<br />
CFFRMC<br />
DTM<br />
DWIDP<br />
GIS<br />
GLOF<br />
GWP<br />
HKH<br />
ICIMOD<br />
IFM<br />
IFFM<br />
ITCZ<br />
IWRM<br />
LDOF<br />
masl<br />
NGO<br />
P3DM<br />
PGIS<br />
PRA<br />
MWRS<br />
USACE/HEC<br />
UNISDR<br />
WMO<br />
community flash flood risk management committee<br />
digital terrain model<br />
Department <strong>of</strong> Water Induced Disaster Prevention, Nepal<br />
geographic information system<br />
glacial lake outburst flood<br />
Global Water Partnership<br />
Hindu Kush-Himalayas<br />
International Centre for Integrated Mountain Development<br />
integrated flood management<br />
integrated flash flood management<br />
inter-tropical convergence zone<br />
integrated water resources management<br />
landslide dam outburst flood<br />
meters above sea level<br />
Non-governmental organisation<br />
participatory three-dimensional modelling<br />
participatory GIS<br />
Participatory Rural Appraisal<br />
monitoring, warning, and response system<br />
United States Army Corps <strong>of</strong> Engineers’ Hydrologic Engineering Center<br />
United Nations International Strategy for Disaster Reduction<br />
World Meteorological Organization
Introduction<br />
<strong>Flash</strong> floods are one <strong>of</strong> the most common forms <strong>of</strong> natural disaster in the Hindu Kush-Himalayan (HKH)<br />
region. They consist <strong>of</strong> sudden and very strong surges <strong>of</strong> water (usually along a riverbed or gully) and can<br />
carry rocks, soil, and other debris. The physical environment <strong>of</strong> the HKH is conducive to flash floods since<br />
these are the youngest mountains on earth and are still tectonically active. Since this area is undergoing<br />
uplift, it is characterised by steep slopes and a high rate <strong>of</strong> surface erosion. In addition to the geological<br />
conditions, intense seasonal precipitation in the central and eastern Himalayas (particularly during the summer<br />
monsoon season) and in the western Himalayas and the Hindu Kush (particularly during winter precipitation)<br />
triggers various types <strong>of</strong> natural hazards. <strong>Flood</strong>s are one <strong>of</strong> the most common forms <strong>of</strong> natural disaster in this<br />
region. Intense monsoon rainfall or cloudbursts can cause devastating flash floods in the middle mountains<br />
(500–3,500 masl), and rapid melting <strong>of</strong> snow accumulated during winter is the main cause <strong>of</strong> flash floods<br />
in the Hindu Kush and western Himalayas. Furthermore, the region is experiencing widespread deglaciation,<br />
likely due to climate change, which has caused the formation and rapid growth <strong>of</strong> many glacial lakes. These<br />
lakes can burst their boundaries as a result <strong>of</strong> internal instabilities or external triggers in a process known as a<br />
glacial lake outburst flood (GLOF), which can cause immense flooding downstream. Landslides due to intense<br />
rainfall, in combination with geological instabilities and earthquakes, can cause the ephemeral damming <strong>of</strong><br />
rivers. The outbreak <strong>of</strong> lakes created by such damming is another type <strong>of</strong> flash flood common in the region.<br />
Hundreds <strong>of</strong> lives and billions <strong>of</strong> dollars worth <strong>of</strong> property and high-cost infrastructure are lost and much<br />
scarce agricultural land is destroyed every year in the region owing to landslides, debris flows, and floods.<br />
In the last decade <strong>of</strong> the twentieth century, floods killed about 100,000 persons and overall affected about<br />
1.4 billion people worldwide; moreover, there is every indication that the number <strong>of</strong> events (and deaths) is<br />
increasing (Jonkman 2005). Statistics show that the number <strong>of</strong> people killed per event is significantly higher<br />
in Asia than elsewhere, and that not only are flash floods responsible for the greatest number <strong>of</strong> deaths<br />
among all water-induced disasters (Jonkman 2005), but in addition mortality rates for flash flood events are<br />
significantly higher than for riverine floods.<br />
Despite the destructive nature and immense impact they have on the socioeconomy <strong>of</strong> the region, flash floods<br />
have not received adequate attention and the HKH regional capacity to manage this risk is low. This lack<br />
<strong>of</strong> capacity can be attributed to poor understanding <strong>of</strong> the processes and a lack <strong>of</strong> knowledge on what<br />
measures can be used. This manual was developed to address this need and to help develop regional<br />
capacity to manage the risk <strong>of</strong> flash floods. It contains a training curriculum and the resource materials<br />
needed to deliver a basic training in flash flood risk management. The manual has been prepared to help<br />
different stakeholders (government staff, non-governmental organisations and other civil society groups,<br />
lawyers, academics, and media people) understand the basics <strong>of</strong> flash floods and the full range <strong>of</strong> flood and<br />
risk management measures for an integrated approach to flash floods, including the importance <strong>of</strong> community<br />
participation, legal and institutional aspects, the latest social hazard mapping techniques, and an introduction<br />
to the various modelling tools. The overall objective <strong>of</strong> the training is to enable participants to effectively help<br />
communities and nations to be better prepared for flash floods using the implements that are available. The<br />
aim is to develop a pool <strong>of</strong> people who are able to serve as knowledge multipliers in the region.<br />
In using the manual, it must be remembered that training needs are subject to the specific context in which<br />
the training is being conducted. Since national policies and legislation can and do differ among countries,<br />
the trainer should try to place the training in the context <strong>of</strong> the particular situation at hand, including countryspecific<br />
policies and legal provisions.<br />
1
<strong>Flash</strong> <strong>Flood</strong> <strong>Risk</strong> <strong>Management</strong> – A <strong>Training</strong> <strong>of</strong> <strong>Trainers</strong> Manual<br />
About This Manual<br />
This manual was designed to help build the capacity <strong>of</strong> trainers in the field <strong>of</strong> flash flood risk management.<br />
It is largely based on ICIMOD's Resource Manual on <strong>Flash</strong> <strong>Flood</strong> <strong>Risk</strong> <strong>Management</strong>, Module 1 (Shrestha et<br />
al. 2008) and Module 2 (Shrestha 2008). The manual was tested during the ‘Integrated Approach to <strong>Flash</strong><br />
<strong>Flood</strong>s and <strong>Flood</strong> <strong>Risk</strong> <strong>Management</strong> in the Hindu Kush-Himalayan Region’ <strong>Training</strong> <strong>of</strong> <strong>Trainers</strong> Workshop<br />
which was organised by ICIMOD from 25 October to 2 November 2010 in Kathmandu, and revisions were<br />
incorporated.<br />
The manual was prepared assuming that the participants have a basic knowledge and understanding <strong>of</strong> flash<br />
flood risk assessment and management. Building on this basic knowledge the manual aims to provide:<br />
• a better understanding <strong>of</strong> the types, causes, and impacts <strong>of</strong> flash floods;<br />
• a better understanding <strong>of</strong> flash flood hazards, vulnerability, risk assessment, and management methods;<br />
• an appreciation <strong>of</strong> the role that local knowledge and gender perspectives can play in flash flood risk<br />
management;<br />
• an introduction to social hazard mapping techniques, and valuing the process <strong>of</strong> community participation;<br />
• an understanding <strong>of</strong> the full range <strong>of</strong> flood and risk management measures for specific types <strong>of</strong> flash floods;<br />
• an assessment <strong>of</strong> the legal and institutional aspects <strong>of</strong> flood and disaster management;<br />
• an introduction to the various modelling tools that are available;<br />
• an understanding <strong>of</strong> the full range <strong>of</strong> concepts and methods for an integrated approach to flash flood risk<br />
management;<br />
• an in-depth understanding <strong>of</strong> the flash flood risk management cycle;<br />
• the necessary tools and materials that will enable the trainers to replicate this course in their own work<br />
areas.<br />
How to Use This Manual<br />
This <strong>Training</strong> <strong>of</strong> <strong>Trainers</strong> Manual uses an adult learning method for the presentation <strong>of</strong> materials. Participantcentred<br />
learning has been kept in mind in designing the sessions and activities and in the training process.<br />
The authors envisage that a 'facilitator' will oversee the entire training session and that each session will be<br />
taught by one or more 'trainers' who can, in turn, call upon specific experts for the technical sessions and<br />
resource persons who either have some specific expertise or who can help with local arrangements for the<br />
field visits, if and when required. The facilitator intervenes at the end <strong>of</strong> activities to conduct the discussion<br />
and other training-related matters. For effective learning, the participants are requested to engage fully in the<br />
sessions and to be active and open.<br />
Presentations, case studies, discussions, and question and answer sessions are used to enhance learning in<br />
each session. Suggestions are given to help the trainer lead the training effectively. For effective teaching<br />
the participants need to be actively involved and the facilitators need to allot time for motivating them. It is<br />
suggested that participatory teaching and learning methods be used as much as possible in each session, but<br />
for highly technical subjects it may be necessary to rely primarily on a presentation format. Sufficient time is<br />
allotted for each session so that the participants are engaged in both learning and sharing. The authors have<br />
designed a total <strong>of</strong> 21 sessions to take place over five days, but the number <strong>of</strong> days can be modified based<br />
on the needs <strong>of</strong> the participants and the context. In addition, a three-day field trip is recommended to provide<br />
the participants with hands-on learning about various aspects <strong>of</strong> field methods and techniques. In total, it is<br />
proposed that the training can be completed in eight days.<br />
Experience shows that the maximum number <strong>of</strong> participants that can be accommodated is around 30. With<br />
more participants it is difficult to ensure the interaction and participation <strong>of</strong> all.<br />
The training process is outlined at the beginning <strong>of</strong> each session. Resource materials are included at the<br />
end <strong>of</strong> each session, so the manual can also be used as a resource manual. The sessions are structured as<br />
follows.<br />
2
Introduction<br />
Session Title: Introduces the main content <strong>of</strong> the session<br />
Time: Rough guide <strong>of</strong> the minimum time needed for the session and the exercises<br />
Objectives: Broad objectives and areas to be covered, followed by a point-wise list <strong>of</strong> specific focus areas,<br />
issues to be discussed, and skills to be imparted<br />
Suggested method: The methods and techniques appropriate to the activities for the session are left to the<br />
discretion <strong>of</strong> the presenter who can choose to do a verbal presentation, use a media tool such as PowerPoint,<br />
or come up with his/her own innovative methodology to present case studies and exercises. When a specific<br />
method, such as group work, is warranted, it is signalled at the beginning <strong>of</strong> the session; otherwise it is<br />
assumed that the normal classroom situation applies.<br />
Materials required: The resource materials needed are given at the end <strong>of</strong> each session. These activitywise<br />
resource materials will make it easier to understand each activity and can also be valuable for future<br />
reference. The numbering follows the numbering <strong>of</strong> the activities; for instance, RM 7.1 refers to the resource<br />
materials for Activity 7.1 <strong>of</strong> Session 7.<br />
Note to the trainer: Additional instructions or supporting material on methodology, process, and themes to be<br />
discussed are given in the text as needed.<br />
Activities: The activities and exercises<br />
Course Structure<br />
The session themes for each day are listed on the first page <strong>of</strong> the sections for each day. The suggested<br />
outline is as follows.<br />
Day 1: Introduction, flash flood hazards in the HKH region; types, causes and impacts; hazard analysis<br />
and assessment<br />
Day 2: Vulnerability and flash flood risk assessment, local knowledge on disaster management, communitybased<br />
flash flood risk management, gender perspective in disaster management, social hazard mapping and<br />
risk assessment<br />
Day 3: Non-structural measures for flash flood risk management, integrated flash flood and watershed<br />
management, hazard-specific flash flood management for intense rainfall floods and landslide dam<br />
outburst floods<br />
Day 4: Country presentations, flash flood management for glacial lake outburst floods, briefing on the field trip<br />
Days 5, 6, and 7: Field trip<br />
Day 8: Legal and institutional issues <strong>of</strong> integrated flood risk management, flash flood management cycle<br />
(preparedness, response and recovery), and overall discussion<br />
The curriculum and schedule for the training are provided at the start <strong>of</strong> the manual.<br />
The manual has been designed so that learning during training sessions can be incorporated when the<br />
manual is updated and revised. It is hoped that trainers will be able to conduct the training easily with the<br />
help <strong>of</strong> the manual, and that participants in the training sessions will be able to act as multiplier agents by<br />
training others.<br />
Materials for the Workshop<br />
Ensure that the materials required for the workshop are ready before the training begins. Some materials<br />
may need to be procured in advance. Planning will help save time and overcome confusion. The following<br />
materials are required for the workshop:<br />
• a bag for each participant containing a pen, writing pad, and any relevant documents and materials, to<br />
be distributed during registration;<br />
• laptop, overhead projector, extension cords, and any other associated equipment, depending on the<br />
training venue and the trainer’s chosen methodology;<br />
3
<strong>Flash</strong> <strong>Flood</strong> <strong>Risk</strong> <strong>Management</strong> – A <strong>Training</strong> <strong>of</strong> <strong>Trainers</strong> Manual<br />
• wall clock;<br />
• flipcharts, s<strong>of</strong>t boards, different coloured meta cards (i.e., 6 x 8 cm pieces <strong>of</strong> coloured card), masking<br />
tape, ruler, a whiteboard or blackboard, board markers or chalk, s<strong>of</strong>t pin board and pins, writing pads,<br />
pens, and other similar materials;<br />
• an appropriate number <strong>of</strong> copies <strong>of</strong> reading material for distribution to the participants.<br />
The training room should be set up every day. The materials required for the day should be available during<br />
the entire training period.<br />
Ensure that media presentations are prepared in advance and that equipment is set up and tested before the<br />
participants enter the training room.<br />
Suggestions for<br />
the facilitator<br />
• Set up the training room in advance to ensure that<br />
everything is in its right place.<br />
• Test equipment in advance to ensure that session time is<br />
not used up in making it work.<br />
• Acquaint yourself with the training methodology in<br />
advance.<br />
• Prepare exercises prior to the session.<br />
• Put a wall clock in the room and ask participants to align<br />
their watches with the clock to ensure that everyone<br />
arrives at the right time after breaks.<br />
• Make participants as comfortable as possible.<br />
• Seating arrangements should be made keeping aspects<br />
<strong>of</strong> human behaviour in mind.<br />
• Be aware <strong>of</strong>, and sensitive to, the culture and views <strong>of</strong><br />
participants.<br />
• Group rules and norms should be made clear at the<br />
beginning <strong>of</strong> the training.<br />
Use <strong>of</strong> an interactive approach<br />
An interactive approach keeps the participants interested.<br />
Engage the class in short question and answer sessions<br />
throughout the day to keeps them alert. Interacting with the<br />
class also allows the presenter the opportunity to assess how<br />
well the class understands the material and, if needed, to clear<br />
up any misconceptions.<br />
Energising participants<br />
Observe participants’ level <strong>of</strong> engagement during the sessions<br />
and be aware when an energising activity is needed. Ask<br />
participants between sessions if they need an energiser and let<br />
them know that they should tell you if they feel they need one.<br />
Choose an energiser yourself or ask participants to suggest<br />
one. Always have an energiser exercise or game ready in case<br />
the participants cannot suggest one. Typical energisers can be<br />
found in HAA (2002) and Pike and Busse (2004).<br />
4
Introduction<br />
Suggested Schedule<br />
The eight-day training schedule is based on an average day lasting from 9:30 to 17:00, with two breaks<br />
<strong>of</strong> 30 minutes each, morning and afternoon, and a one-hour break for lunch. Participants are expected<br />
to review the day’s material in the evening. The day can be extended (e.g., starting at 8:30 or ending at<br />
18:00) if participants need more time to understand the material.<br />
Day 1<br />
Morning<br />
Session 1 Introduction<br />
Session 2 <strong>Flash</strong> <strong>Flood</strong> Hazards in the HKH Region<br />
Afternoon<br />
Session 3 Types, Causes, and Impacts <strong>of</strong> <strong>Flash</strong> <strong>Flood</strong>s<br />
Session 4 <strong>Flash</strong> <strong>Flood</strong> Hazard Analysis and Assessment<br />
Day 2<br />
Morning<br />
Session 5 Vulnerability and <strong>Flash</strong> <strong>Flood</strong> <strong>Risk</strong> Assessment<br />
Session 6 Local Knowledge on Disaster <strong>Management</strong><br />
Afternoon<br />
Session 7 Community-Based <strong>Flash</strong> <strong>Flood</strong> <strong>Risk</strong> <strong>Management</strong><br />
Session 8 Gender Perspectives in Disaster <strong>Management</strong><br />
Session 9 Social Hazard Mapping and <strong>Risk</strong> Assessment<br />
Day 3<br />
Morning<br />
Session 10 Non-Structural Measures for <strong>Flash</strong> <strong>Flood</strong> <strong>Risk</strong> <strong>Management</strong><br />
Session 11 Modelling Tools for <strong>Flash</strong> <strong>Flood</strong> <strong>Management</strong><br />
Session 12 Integrated <strong>Flash</strong> <strong>Flood</strong> and Watershed <strong>Management</strong><br />
Afternoon<br />
Session 12 Continued<br />
Session 13 Hazard-Specific <strong>Flash</strong> <strong>Flood</strong> <strong>Management</strong>: Intense Rainfall <strong>Flood</strong>s<br />
Session 14 Hazard-Specific <strong>Flash</strong> <strong>Flood</strong> <strong>Management</strong>: Landslide Dam Outburst <strong>Flood</strong>s<br />
Day 4<br />
Morning<br />
Session 15 Country Presentations<br />
Session 15 Continued<br />
Afternoon<br />
Session 15 Continued<br />
Session 16 Hazard-Specific <strong>Flash</strong> <strong>Flood</strong> <strong>Management</strong>: Glacial Lake Outburst <strong>Flood</strong>s<br />
Briefing for the Field Trip<br />
Days 5, 6, and 7<br />
Field Trip Activities<br />
Day 8<br />
Morning<br />
Session 17 Legal and Institutional Issues <strong>of</strong> <strong>Flash</strong> <strong>Flood</strong> <strong>Management</strong><br />
Session 18 <strong>Flash</strong> <strong>Flood</strong> <strong>Management</strong> Cycle: Preparedness<br />
Session 19 <strong>Flash</strong> <strong>Flood</strong> <strong>Management</strong> Cycle: Response and Recovery<br />
Session 20 Overall Discussion<br />
Afternoon<br />
Session 21 <strong>Training</strong> Evaluation and Closing Session<br />
5
Introduction<br />
Day 1<br />
Session/Activity<br />
Session 1: Introduction<br />
Activity time<br />
(minutes)<br />
Cumulative time<br />
<strong>of</strong> session<br />
1.1 Registration 20 20<br />
1.2 Opening ceremony 15 35<br />
1.3 Mutual introductions 15 50<br />
1.4 Participants’ expectation survey 10 60<br />
1.5<br />
General introduction to the training objectives and programme<br />
schedule<br />
10 70<br />
1.6 Agreement on group rules and norms 10 80<br />
1.7 Other issues (housekeeping) 10 90<br />
Session 2: <strong>Flash</strong> <strong>Flood</strong> Hazards in the HKH Region<br />
2.1 Geographic setting <strong>of</strong> the region 10 10<br />
2.2 Regional rainfall and temperature patterns 20 30<br />
2.3<br />
Physiographic features and run<strong>of</strong>f patterns <strong>of</strong> the major river<br />
basins<br />
15 45<br />
2.4 Major characteristics <strong>of</strong> flash floods in the HKH region 45 90<br />
Session 3: Types, Causes, and Impacts <strong>of</strong> <strong>Flash</strong> <strong>Flood</strong>s<br />
3.1 Types <strong>of</strong> flash flood 15 15<br />
3.2 Identifying the causes <strong>of</strong> flash floods 10 25<br />
3.3 Group presentation on activities 3.1 and 3.2 15 40<br />
3.4 Outcomes and impacts <strong>of</strong> flash floods 20 60<br />
Session 4: <strong>Flash</strong> <strong>Flood</strong> Hazard Analysis and Assessment<br />
4.1 <strong>Flash</strong> flood risks and hazards 30 30<br />
4.2 Methods <strong>of</strong> hazard analysis and assessment 60 90<br />
7
<strong>Flash</strong> <strong>Flood</strong> <strong>Risk</strong> <strong>Management</strong> – A <strong>Training</strong> <strong>of</strong> <strong>Trainers</strong> Manual<br />
Session 1<br />
Session 1 Introduction<br />
Objectives<br />
To introduce the participants, find out their expectations, and clarify the objectives <strong>of</strong> the training<br />
X X Introduction <strong>of</strong> participants, facilitator(s), trainer(s) and resource person(s)<br />
X X Discovery <strong>of</strong> participants’ expectations<br />
X X Discussion <strong>of</strong> how the training objectives relate to the participants' expectations<br />
X X Setting the training norms and clarifying the logistics<br />
X X Discussion <strong>of</strong> any issues <strong>of</strong> concern raised by the participants<br />
Time: 90 minutes<br />
Materials<br />
• One bag/file per participant containing a pen, writing pad, the training schedule, and relevant<br />
documents/materials<br />
• Wall clock<br />
• Different coloured meta cards<br />
• General equipment and materials as described in the section 'How to use this Manual'<br />
Activities<br />
Activity 1.1: Registration<br />
Time: 20 minutes<br />
Registration is an informal activity to record the participants’ names and addresses for future use and to<br />
distribute materials.<br />
Distribute a registration form (see sample in ‘Resource Materials’ at the end <strong>of</strong> the session) to each participant<br />
and request that participants fill them out and return them.<br />
A bag/file should be distributed to each participant at registration. The bag can containing any materials<br />
required during the training such as writing pads and pens, the training schedule, and documents required for<br />
the training sessions.<br />
Suggestions for<br />
the facilitator<br />
A simple attendance form can be used to record daily attendance<br />
at the training. This attendance form can be circulate at the<br />
beginning <strong>of</strong> each day or kept separately at the registration desk<br />
where the participants can sign it as they come in.<br />
Activity 1.2: Opening ceremony<br />
Time: 15 minutes<br />
The opening ceremony which includes remarks by relevant speakers and VIPs marks the <strong>of</strong>ficial launch <strong>of</strong> the<br />
training, it helps to set the tone for the session and can serve as a reminder <strong>of</strong> the broader issues which may<br />
not necessarily be touched upon in detail during the training.<br />
8
Day 1<br />
Suggestions for<br />
the facilitator<br />
Prepare a programme for the opening ceremony. Remember to<br />
be mindful <strong>of</strong> the protocol for the different speakers and VIPs.<br />
When inviting the speakers, acquaint them with the purpose <strong>of</strong><br />
the training and inform them <strong>of</strong> how long they are requested to<br />
speak.<br />
Session 1<br />
Activity 1.3: Mutual introductions<br />
Time: 15 minutes<br />
The facilitator asks participants, trainer(s) and resource person(s) to introduce themselves by stating their name,<br />
the country that they are working in, the organisation that they are affiliated with, and by giving a brief<br />
account <strong>of</strong> their expertise.<br />
Suggestions for<br />
the facilitator<br />
Introducing participants, trainer(s), and resource person(s) at<br />
the start <strong>of</strong> the training helps to create an environment <strong>of</strong> ease<br />
among all present. Make the introductions fun by using an<br />
icebreaker, which serves the dual purpose <strong>of</strong> making the session<br />
interesting and discovering the background <strong>of</strong> the participants.<br />
There are many possible icebreakers (e.g., West 1999).<br />
Activity 1.4: Participants’ expectation survey<br />
Time: 10 minutes<br />
The aim <strong>of</strong> the survey is to give the facilitator a better idea <strong>of</strong> the participants' expectations so that the course<br />
content can be fine-tuned to accommodate their needs (if possible).<br />
Step 1<br />
Step 2<br />
Distribute a blank meta card to each participant. Ask the participants to write down their<br />
expectations from the training on the meta card provided.<br />
Collect the completed meta cards. The facilitator goes through the meta cards and compiles a<br />
summary list <strong>of</strong> the expectations. The facilitator then communicates the participants expectations’ to<br />
the programme coordinator and to the resource persons so they can address the relevant issues in<br />
their sessions.<br />
Suggestions for<br />
the facilitator<br />
It is strongly recommended that the facilitator go through the<br />
meta cards to compile the list and become acquainted with the<br />
participants’ expectations from the training; the facilitator should<br />
then consider how to accommodate any need for changes to the<br />
content <strong>of</strong> the training.<br />
9
<strong>Flash</strong> <strong>Flood</strong> <strong>Risk</strong> <strong>Management</strong> – A <strong>Training</strong> <strong>of</strong> <strong>Trainers</strong> Manual<br />
Session 1<br />
Activity 1.5: General introduction to the training objectives and<br />
programme schedule<br />
Time: 10 minutes<br />
The facilitator makes a presentation:<br />
• Outlining the training objectives<br />
• Introducing the main topics/themes<br />
• Relating the expectations <strong>of</strong> the participants (as per their feedback on the meta cards) to the topics that will<br />
be covered in the training programme.<br />
• Introducing the programme schedule<br />
Suggestions for<br />
the facilitator<br />
Call attention to the programme schedule and briefly explain<br />
the content <strong>of</strong> the training and the way it is distributed over<br />
the days. When presenting the training objectives, make<br />
sure to correlate these with the expectations expressed by the<br />
participants. The comparison should give the participants an<br />
idea <strong>of</strong> the extent to which they already have a comprehensive,<br />
strategic overview <strong>of</strong> flood risk management and whether or not<br />
they have expectations outside the scope <strong>of</strong> the training. If some<br />
expectations are not covered in the objectives, make this clear. If<br />
the expectation is relevant but not explicitly covered, explain that<br />
it can be either discussed in private with the trainer or, if it is <strong>of</strong><br />
general interest to this particular class, it can be discussed during<br />
a related session.<br />
Activity 1.6: Agreement on group rules and norms<br />
Time: 10 minutes<br />
The facilitator discusses the rules and norms to be observed to ensure a good atmosphere for the training<br />
and inquires whether these are acceptable to the participants as is, or whether they need to be modified.<br />
The facilitator writes down the points raised on a flip chart or white board. These can be summarised on one<br />
sheet <strong>of</strong> paper and display on the wall throughout the training. Some typical ideas that might be included are<br />
listed below.<br />
• Raise hand to ask a question<br />
• One speaker at a time<br />
• Respect for gender and culture. Do not use gender, racial, religious, or culturally sensitive words, or<br />
language.<br />
• Respect starting and ending times<br />
• Attend the sessions on time<br />
• Inform when absent<br />
• Switch <strong>of</strong>f mobiles phones during the session<br />
• Deal with things that disturb participants first. No question or observation is weird<br />
• Responsible for your own learning<br />
• Responsible for your ‘yes’ and ‘no’<br />
• Keep cases realistic<br />
10
Day 1<br />
Suggestions for<br />
the facilitator<br />
Use the parking lot – find time to answer all questions<br />
During any given presentation the participants may raise issues<br />
that are relevant in the context <strong>of</strong> the session but which it is not<br />
possible to address or clarified at the moment due to time or<br />
resource constraints. Such issues can be ‘parked’ by writing<br />
them on the chart paper provided for this purpose. The ‘parking<br />
lot’ chart paper is displayed by the presenter’s desk or in<br />
another convenient location. The trainer can then discuss these<br />
topics either one-on-one with the individual or with a group by<br />
arranging a mutually agreed time either during lunchtime or tea<br />
break or at the end <strong>of</strong> the day.<br />
Session 1<br />
Activity 1.7: Other issues (housekeeping)<br />
Time: 10 minutes<br />
It is wise to keep aside some time to discuss any other issues that may need attention during the training.<br />
These issues may or may not be related to the technical aspects <strong>of</strong> the training. Letting participants know that<br />
any issues that are important to them will be looked after is reassuring and is a way <strong>of</strong> making participants<br />
feel comfortable and engaged. The facilitator may ask about time schedules, logistics, or any other issue. If<br />
a participant raises an issue, the facilitator should seek a solution by discussing with the group. The important<br />
thing is to assure participants that their needs will be taken into consideration. Items that may be <strong>of</strong> concern<br />
to the participants can include, for example:<br />
• Resource materials and data<br />
• Information regarding transportation from the place <strong>of</strong> residence to the training venue<br />
• Places for phone communication, internet access, etc.<br />
• Nearby market places for general shopping<br />
• Traffic and security regulations<br />
• Emergency contact person(s) and contact details<br />
After this discussion, the facilitator can continue with the next technical session.<br />
11
<strong>Flash</strong> <strong>Flood</strong> <strong>Risk</strong> <strong>Management</strong> – A <strong>Training</strong> <strong>of</strong> <strong>Trainers</strong> Manual<br />
Session 1 Resource Materials<br />
Session 1<br />
RM1.1: Sample registration form format<br />
<strong>Flash</strong> <strong>Flood</strong> <strong>Risk</strong> <strong>Management</strong> Workshop Registration Form<br />
Date (fill in)<br />
Name:<br />
Country<br />
Representing organisation:<br />
Position:<br />
Postal address:<br />
Fax:<br />
Contact telephone number:<br />
Email address:<br />
Sample attendance sheet format<br />
<strong>Flash</strong> <strong>Flood</strong> <strong>Risk</strong> <strong>Management</strong> Workshop Sign-Up Sheet<br />
Date: (fill in)<br />
Name <strong>of</strong> participant (please print)<br />
Signature<br />
RM 1.5: Objectives <strong>of</strong> the training<br />
The specific objectives <strong>of</strong> the <strong>Flash</strong> <strong>Flood</strong> <strong>Risk</strong> <strong>Management</strong> <strong>Training</strong> <strong>of</strong> <strong>Trainers</strong> (TOT) Workshop are:<br />
• to understand the nature <strong>of</strong> flash floods, their types, causes and the impacts they can have;<br />
• to better understand flash flood hazards, vulnerability and risk assessments, and management methods;<br />
• to understand what role local knowledge and gender perspectives can play in flash flood risk<br />
management;<br />
• to explore social hazard mapping techniques and processes and to learn to value community<br />
participation;<br />
• to learn about the full range <strong>of</strong> flood and risk management measures for different types <strong>of</strong> flash floods;<br />
• to explore different ways <strong>of</strong> transferring scientific information to local communities;<br />
• to provide information on the various modelling tools and understand how these can be used in an<br />
integrated approach to flash flood risk management;<br />
• to provide in-depth information on risk management measures that can be used before, during and after<br />
the flash flood; and<br />
• to provide the necessary tools and materials so that the participants can replicate this training on their<br />
own.<br />
12
Day 1<br />
Session 2 <strong>Flash</strong> <strong>Flood</strong> Hazards<br />
in the HKH Region<br />
Time: 90 minutes<br />
Objectives<br />
To acquaint the participants with the general characteristics <strong>of</strong> flash floods and introduce why flash floods<br />
occur in the Hindu Kush-Himalayan (HKH) region, including:<br />
XX<br />
Highlights <strong>of</strong> the geographical setting <strong>of</strong> the region<br />
XX<br />
Rainfall and temperature patterns <strong>of</strong> the region<br />
XX<br />
Physiography <strong>of</strong> the major river basins and their run<strong>of</strong>f patterns<br />
XX<br />
How flash floods and riverine floods can cause loss <strong>of</strong> life and property<br />
Session 2<br />
Activities<br />
Activity 2.1: Geographic setting <strong>of</strong> the region<br />
Time: 10 minutes<br />
Introduce the geographical setting <strong>of</strong> the HKH region, review which countries are covered, and touch on the<br />
major geological formations, landform types, slope, and relief.<br />
Activity 2.2: Regional rainfall and temperature patterns<br />
Time: 20 minutes<br />
Present a review <strong>of</strong> the rainfall and temperature patterns <strong>of</strong> the region; include the following information:<br />
• Maps <strong>of</strong> rainfall variability by season; summer vs. winter precipitation patterns<br />
• Explanation <strong>of</strong> the monsoon and westerly circulation changes and their geographical coverage and<br />
dominance<br />
• Microclimatic features and specifically the role that high intensity rainfall plays in causing flash floods in<br />
HKH region<br />
• Summer and winter temperature patterns and their variability<br />
• The relationship between altitude and temperature<br />
Activity 2.3: Physiographic features and run<strong>of</strong>f patterns <strong>of</strong> the major river<br />
basins<br />
Time: 15 minutes<br />
Review the following:<br />
• Major rivers and river basins <strong>of</strong> the HKH region<br />
• Monsoon and annual run<strong>of</strong>f patterns in the region<br />
• Seasonal variation in the run<strong>of</strong>f patterns <strong>of</strong> selected major rivers in the region<br />
13
<strong>Flash</strong> <strong>Flood</strong> <strong>Risk</strong> <strong>Management</strong> – A <strong>Training</strong> <strong>of</strong> <strong>Trainers</strong> Manual<br />
Activity 2.4: Major characteristics <strong>of</strong> flash floods in the HKH region<br />
Time: 45 minutes<br />
Step 1<br />
Introduce the following:<br />
• Major flood events in the region and loss <strong>of</strong> life and property<br />
• The difference between flash floods and riverine floods<br />
Open up a discussion on the difference between flash floods and riverine floods. Present the major<br />
differences between the two types <strong>of</strong> floods and compare the extent <strong>of</strong> losses that can be caused<br />
by each type.<br />
Session 2<br />
Step 2<br />
Present a short video on flash floods. Possible examples can include the extreme weather events<br />
<strong>of</strong> 1993, and/or the Bagmati flood or Koshi <strong>Flood</strong> that took place in Nepal in 2008. Discuss the<br />
nature <strong>of</strong> the flood and discuss the extent <strong>of</strong> the damage that it caused in terms <strong>of</strong> the loss <strong>of</strong> life<br />
and property.<br />
14
Day 1<br />
Session 2 Resource Materials<br />
RM 2.1: Geographical setting <strong>of</strong> the region<br />
The HKH region extends 3,500 km in length and covers all or part <strong>of</strong> eight countries, namely, Afghanistan,<br />
Bangladesh, Bhutan, China, India, Myanmar, Nepal, and Pakistan. The region encompasses some <strong>of</strong> the<br />
highest mountain chains in the world and the world›s two highest mountain peaks, Mt. Everest (8,850 m,<br />
Nepal) and K2 (8,611 m, Pakistan).<br />
The mountain chains <strong>of</strong> the HKH region are the youngest on earth and are still tectonically active. They are<br />
still undergoing uplift and consequently the region is characterised by steep slopes and a high rate <strong>of</strong> surface<br />
erosion. These ranges contain rock series from all the major geologic periods. The central Himalayan zone<br />
has predominantly crystalline and metamorphic rocks which date from the Tertiary Period (which started<br />
before 65 million years ago and ended 1.6 million years ago) whereas the Eastern Himalayas have more<br />
examples <strong>of</strong> Archaean basement gneiss which date to more than 2.5 billion years ago. The lower ranges,<br />
along the southern flank <strong>of</strong> the Himalayas, consist <strong>of</strong> a complex set <strong>of</strong> younger Tertiary sedimentary deposits<br />
including riverine deposits left behind by rivers originating in the Himalayas.<br />
Session 2<br />
RM 2.2: Rainfall and temperature in the HKH<br />
The climate in the Himalayas, as in the other parts <strong>of</strong> South Asia, is dominated by the Monsoon. The summer<br />
monsoon originates in the Bay <strong>of</strong> Bengal and the amount <strong>of</strong> monsoon precipitation it deposits decreases from<br />
east to west. The Monsoon season is much longer in the Eastern Himalayas (e.g., Assam), where it lasts for<br />
five months (June-October), than in the central Himalayas (Sikkim, Nepal, and Kumaon) where it lasts for four<br />
months (June-September). In the Western Himalayas (e.g., Kashmir) the Monsoon lasts for only two months<br />
(July-August) (Chalise and Khanal 2001); however, this area also receives significant precipitation from winter<br />
westerlies. Winter precipitation is greater in the western parts <strong>of</strong> the region and less in the eastern parts.<br />
Summer precipitation is greater on the windward side <strong>of</strong> the Himalayas owing to the orographic effect and<br />
the leeward side receives less rain. Annual precipitation decreases from southeast to northwest: from about<br />
800 mm at Markam and Songpan in western Sichuan to 400-500 mm at Lhasa, 200-300 mm at Tingri, and<br />
less than 100 mm at Ngari Prefecture (Mei’e et al. 1985).<br />
Temperatures in the HKH vary inversely with elevation at the rate <strong>of</strong> about 0.6°C per 100 m but, due to<br />
the rugged terrain, temperatures vary widely over short distances. Local temperatures also vary according<br />
to season, aspect, and slope (Zurick et al. 2006). Owing to the thin atmosphere above the Tibetan Plateau<br />
and ample and intense radiation, the surface temperature has a large diurnal variation, although its annual<br />
temperature range is relatively small. The diurnal variation <strong>of</strong> temperatures in the northern mountainous region<br />
<strong>of</strong> Pakistan and Afghanistan is also considerable, and the annual temperature range is large. In Chitral (1450<br />
masl), for example, in the course <strong>of</strong> a year temperatures can climb to as high as 42°C and can plunge to as<br />
low as -14.8°C (Shamshad 1988).<br />
High-intensity rainfall is a characteristic microclimatic feature <strong>of</strong> the region (Domroes 1979). Such highintensity<br />
rainfall has important implications for the flash floods known as intense rainfall floods (IRFs) which are<br />
common throughout the HKH.<br />
The Western Himalayas, Karakoram and Hindu Kush can receive large amounts <strong>of</strong> snow during the winter.<br />
This precipitation is caused by westerly disturbances from the Mediterranean. These intense snowfalls can<br />
affect livelihoods not only by causing avalanches, which <strong>of</strong>ten block transport routes, but also by causing<br />
flash floods when rapid snowmelt is triggered by fast warming in the spring.<br />
15
<strong>Flash</strong> <strong>Flood</strong> <strong>Risk</strong> <strong>Management</strong> – A <strong>Training</strong> <strong>of</strong> <strong>Trainers</strong> Manual<br />
RM 2.3: Major river basins and their run<strong>of</strong>f pattern<br />
Ten major rivers originate in the Himalayan range – the Amu Darya, Brahmaputra, Ganges, Indus, Irrawaddy,<br />
Mekong, Salween, Tarim, Yangtse, and Yellow Rivers.<br />
All <strong>of</strong> these rivers are an important source <strong>of</strong> run<strong>of</strong>f, and in all cases the run<strong>of</strong>f is significantly higher in<br />
the summer than in the winter (Figure 1). In spite <strong>of</strong> the fact that the river basins <strong>of</strong> these rivers are situated<br />
in widely different locations, their flow hydrographs generally peak during spring or summer, a fact that<br />
accentuates the importance <strong>of</strong> summer precipitation in run<strong>of</strong>f generation.<br />
Session 2<br />
Figure 1: Major river basins in the HKH and seasonal variation in the flow <strong>of</strong> selected rivers<br />
Jhelum<br />
Arun<br />
Brahamaputra<br />
e<br />
H<br />
uang H<br />
Huang<br />
He<br />
I n dus<br />
Hua<br />
n g He<br />
Sa<br />
Ga<br />
nges<br />
B<br />
rahmap ut<br />
ra<br />
lween<br />
Ya<br />
Irrawad dy<br />
n<br />
g<br />
tze<br />
Me kong<br />
Mekong<br />
Narayani<br />
Ganges<br />
Irrawaddy<br />
Source: ICIMOD archive<br />
16
Day 1<br />
RM 2.4: <strong>Flash</strong> floods in the HKH region and their major characteristics<br />
The frequency with which flash floods occur<br />
differs in different areas. It is now widely held<br />
that the joint influence <strong>of</strong> global climate change<br />
and regional environmental degradation may<br />
compound to increase the frequency and the<br />
magnitude <strong>of</strong> water-induced hazards (including<br />
flash floods) and that mountainous regions,<br />
such as the HKH, are more susceptible to these<br />
changes. The main characteristics <strong>of</strong> flash<br />
floods are summarised in Box 1.<br />
Figure 2 shows that the incidence <strong>of</strong> flash<br />
flood events has increased sharply since the<br />
1980s. With 1985 as a baseline for study,<br />
the greatest number <strong>of</strong> flash flood events occurred during 2005 and 2006.<br />
Box 1: Characteristics <strong>of</strong> flash floods<br />
• Sudden and rapid events that travel like waves<br />
• Sudden onset – little or no lead time<br />
• Can occur at any time <strong>of</strong> the year<br />
• <strong>Flood</strong>s are localised<br />
• No distinct flood path<br />
• <strong>Flood</strong> waters travel at high speed<br />
• <strong>Flood</strong> waters contain a high debris load<br />
Session 2<br />
Every year in the HKH region, both hundreds <strong>of</strong> lives and billions <strong>of</strong> dollars worth <strong>of</strong> property and investments<br />
are lost, scarce agricultural lands are destroyed due to landslides, debris flows, floods, and flash floods.<br />
Statistics show that the number <strong>of</strong> people killed per event is significantly higher in Asia than elsewhere and<br />
that the number is higher for flash floods than for all other water-induced disasters. In the last decade <strong>of</strong> the<br />
twentieth century, floods killed about 100,000 people and displaced or otherwise affected an additional<br />
one billion people. There are indications that the number <strong>of</strong> flood events (and the number <strong>of</strong> related deaths)<br />
is increasing (Jonkman 2005, cited in Shrestha and Shrestha 2008). In China, 152,000 people were killed<br />
Figure 2: <strong>Flash</strong> flood trend in HKH region (based on data recorded from 1828 to 2007)<br />
20<br />
15<br />
Frequency<br />
10<br />
5<br />
0<br />
1820 1840 1860 1880 1900 1920 1940 1960 1980 2000 2020<br />
Year<br />
Source: Shrestha and Shrestha (2008)<br />
17
<strong>Flash</strong> <strong>Flood</strong> <strong>Risk</strong> <strong>Management</strong> – A <strong>Training</strong> <strong>of</strong> <strong>Trainers</strong> Manual<br />
Table 1: <strong>Flash</strong> floods and riverine floods<br />
Session 2<br />
Features<br />
Causes<br />
Associated<br />
problems<br />
<strong>Flash</strong> floods<br />
Rapid water level rise above natural channels<br />
Reaches peak flow within minutes up to a few<br />
hours<br />
Rapid recession (within minutes to few hours)<br />
Often dissipate quickly<br />
Not necessarily related to base flow levels<br />
Short lag times<br />
Very high intensity rainstorms/ cloudbursts<br />
Rapid snow/glacial melt due to rapid increase in<br />
temperature<br />
Dam (both artificial and natural) breaks<br />
Often carry high sediment and debris loads<br />
Very high hydraulic force and erosive power<br />
Riverine floods<br />
Slow water level rise beyond natural<br />
channels<br />
Reaches peak flow within days to weeks<br />
Slow recession (within days to weeks)<br />
Mostly coinciding with high base flow levels<br />
Medium to long lag times<br />
Prolonged seasonal precipitation <strong>of</strong> low to<br />
high intensity<br />
Seasonal snow and glacial melt<br />
Inundation<br />
Frequency Occasionally, any time during the year Annually during rainy season<br />
Affected areas River plains and valleys<br />
Alluvial fans<br />
Mostly local extent<br />
River plains and valleys<br />
Local to regional extent<br />
Large areas can be affected<br />
Generally small to medium areas are affected<br />
Predictability Very difficult to forecast With appropriate technology and measures<br />
in place, forecasting is easily possible<br />
Potential<br />
mitigation<br />
measures<br />
Early warning systems<br />
Community preparedness and awareness<br />
Appropriate emergency measures<br />
Real-time flood forecasting<br />
Community preparedness and awareness<br />
Appropriate emergency measures<br />
Source: Xu et al. (2006)<br />
Figure 3: People killed and affected by floods: a) Types <strong>of</strong> water-related disasters; b) Number <strong>of</strong> people<br />
killed and affected by floods (disaggregated by continent); c) Number <strong>of</strong> people killed<br />
(disaggregated by flood type)<br />
200<br />
b.<br />
Killed<br />
Affected<br />
4,000<br />
3,500<br />
<strong>Flood</strong><br />
Landslide/avalanche<br />
Famine<br />
Water related epidemic<br />
Drought<br />
a.<br />
Persons<br />
150<br />
100<br />
50<br />
0<br />
200<br />
c.<br />
Africa Americas Asia Europe Oceania<br />
Killed Mortality (%)<br />
3,000<br />
2,500<br />
2,000<br />
1,500<br />
1,000<br />
500<br />
0<br />
4<br />
3.5<br />
Affected (thousands)<br />
150<br />
3<br />
Persons<br />
100<br />
2.5<br />
2<br />
1.5<br />
Mortality (%)<br />
50<br />
1<br />
0.5<br />
0<br />
Riverine flood <strong>Flash</strong> flood Other<br />
Source: Based on Jonkman (2005); ICIMOD (2007)<br />
0<br />
18
Day 1<br />
in flash floods during the period from 1950 to 1990, and accounted for about 67% <strong>of</strong> the total number <strong>of</strong><br />
flood related deaths during the same period (Zhuo and Wan 2005, cited in Shrestha and Shrestha 2008). In<br />
Nepal, landslides, floods, and avalanches are annually responsible for about 300 deaths and the destruction<br />
<strong>of</strong> important infrastructure <strong>of</strong> estimated worth US$ 9 million (DWIDP 2005, cited in Shrestha and Shrestha<br />
2008).<br />
<strong>Flash</strong> floods and riverine floods differ in many respects (see Table 1). The numbers <strong>of</strong> people killed or<br />
otherwise affected is higher for flash floods than for riverine floods (Figure 3) (Jonkman 2005). The region’s<br />
flash floods occur predominantly in the mountainous parts <strong>of</strong> South Asia, such as the greater Himalayan<br />
range, the Hindu Kush, the Karakorum, the Tien Shan, the Kun Lun, and the Pamir.<br />
Session 2<br />
19
<strong>Flash</strong> <strong>Flood</strong> <strong>Risk</strong> <strong>Management</strong> – A <strong>Training</strong> <strong>of</strong> <strong>Trainers</strong> Manual<br />
Session 3 Types, Causes, and<br />
Impacts <strong>of</strong> <strong>Flash</strong> <strong>Flood</strong>s<br />
Time: 60 minutes<br />
Objectives<br />
To understand the types, causes and impacts <strong>of</strong> flash floods, including:<br />
XX<br />
The different types <strong>of</strong> flash floods<br />
XX<br />
Identifying the causes <strong>of</strong> flash floods<br />
XX<br />
Understanding the impacts that flash floods can have from different perspectives<br />
Methodology<br />
This session uses group work to stimulate involvement and discussion. The participants are divided into groups<br />
where they discuss the assigned topic and record their findings. At the end <strong>of</strong> the allotted time each group<br />
shares their findings and the whole class participates in a group discussion.<br />
Session 3<br />
Activities<br />
Note to the<br />
trainer<br />
The interactive format <strong>of</strong> this session provides the trainer with<br />
an opportunity to find out how much the class knows about<br />
flash floods. It is therefore necessary to encourage everyone to<br />
actively participate in the discussion.<br />
Activity 3.1: Types <strong>of</strong> flash flood<br />
Time: 15 minutes<br />
Step 1 Depending on the number <strong>of</strong> participants, divide the class into 3-5 groups, each having 3-6<br />
participants.<br />
Step 2<br />
Step 3<br />
Step 4<br />
Distribute Handout 3.1 to each group.<br />
Ask the groups to discuss the types <strong>of</strong> flash floods that can occur in the region and ask them to list<br />
the different types on Handout 3.1.<br />
When the participants have had a chance to complete their handouts, engage them in a short<br />
question and answer session. Add to the participants’ understanding and correct common<br />
misconceptions. To make the definitions more vivid, show pictures <strong>of</strong> the various types <strong>of</strong> floods. It<br />
is important to intervene at this point because the groups need to have a clear understanding <strong>of</strong> the<br />
different types <strong>of</strong> flash floods before they go on the next activity which is about the causes.<br />
20
Day 1<br />
Activity 3.2: Identifying the causes <strong>of</strong> flash floods<br />
Time: 10 minutes<br />
Step 1<br />
Step 2<br />
Similar to Activity 3.1; this time, ask the groups to discuss the probable causes <strong>of</strong> flash floods.<br />
Continue with Handout 3.1, ask the groups to list the causes for each type <strong>of</strong> flash flood identified<br />
in the previous exercise.<br />
Activity 3.3: Group presentation on Activities 3.1 and 3.2<br />
Time: 15 minutes<br />
Step 1<br />
Step 2<br />
Ask each group to select a person to present the group’s findings on the types and causes <strong>of</strong> flash<br />
floods.<br />
Comments on the similarities and differences in the list <strong>of</strong> ‘causes’ that each group presents. Uses<br />
this as a starting point to present the major causes <strong>of</strong> flash floods.<br />
Step 3<br />
Ask the groups to return the completed Handout 3.1. Review the returned handouts and mark<br />
the missing types <strong>of</strong> flash floods and their causes as compared to the list found in the resource<br />
materials. Use this feedback to gauge the participants’ grasp <strong>of</strong> the subject matter. Make sure to<br />
notice if there are any new types and causes mentioned by the participants.<br />
Activity 3.4: Outcomes and impacts <strong>of</strong> flash floods<br />
Time: 20 minutes<br />
Session 3<br />
Step 1<br />
Step 2<br />
Step 3<br />
Continue with the same groups as were formed for Activity 3.2. Distribute Handout 3.4 to each<br />
group. Ask the participants to discuss the possible impacts <strong>of</strong> flash floods.<br />
Ask each group first to list the possible impacts <strong>of</strong> flash floods and then to complete the table by<br />
considering what type <strong>of</strong> impact each can have.<br />
Make sure that the participants are able to analyse the impacts from different perspectives. Discuss<br />
the types <strong>of</strong> impacts and review responses given in Handout 3.4.<br />
Note to the<br />
trainer<br />
The group exercise on the categorisation <strong>of</strong> flash flood impacts<br />
helps participants to understand the impacts from different<br />
perspectives. Guide the discussion by first highlighting what<br />
the impacts can be and then discuss each from different<br />
perspectives. For example, work through the example <strong>of</strong> a<br />
bridge damaged during a flash flood. In this case the physical<br />
loss <strong>of</strong> the structure is immediately evident and its effect on<br />
the transportation system is also quickly apparent. The loss<br />
<strong>of</strong> a bridge severely affects everyday life and disturbs the<br />
normal mobility pattern. Eventually, its devastating effects on<br />
the regional economy also become apparent. The economic<br />
consequences can be equally incapacitating. These can include,<br />
for example, impacts on tourism and travel through the area<br />
as alternative routes need to be taken. The point to emphasise<br />
is that impacts can be viewed from different perspectives e.g.,<br />
physical, economic, and social. Discuss how the impacts can be<br />
quantified.<br />
21
<strong>Flash</strong> <strong>Flood</strong> <strong>Risk</strong> <strong>Management</strong> – A <strong>Training</strong> <strong>of</strong> <strong>Trainers</strong> Manual<br />
Session 3 Handouts<br />
Handout 3.1: Types and causes <strong>of</strong> flash floods<br />
List the types <strong>of</strong> flash floods and give their probable causes.<br />
SN Type <strong>of</strong> <strong>Flash</strong> <strong>Flood</strong> Probable Causes<br />
Handout 3.4: Inventory <strong>of</strong> flash flood impacts by type<br />
Session 3<br />
List the possible losses or impacts caused by flash floods and place a tick mark in the appropriate column<br />
to indicate the type <strong>of</strong> impact that can be expected.<br />
SN List <strong>of</strong> possible losses or impacts caused by flash floods Type <strong>of</strong> impact<br />
Physical<br />
Social<br />
Direct<br />
Indirect<br />
Short term<br />
Long term<br />
Reversible<br />
Irreversible<br />
22
Day 1<br />
Session 3 Resource Materials<br />
RM 3.1: Types and causes <strong>of</strong> flash floods<br />
Based on the underlying processes causing flash floods, they can be categorised into three main types:<br />
intense rainfall floods, landslide dam outburst floods, and glacial lake outburst floods. In addition, flash floods<br />
can also be caused by bursting <strong>of</strong> artificial structures such as dams.<br />
The causes <strong>of</strong> flash floods can be broadly classified into two main groups; these are either meteorological<br />
(intense precipitation) or geo-environmental.<br />
Intense rainfall flash floods<br />
Intense rainfall is the most common cause <strong>of</strong> flash flooding in the HKH region. It is associated with three<br />
meteorological phenomena: cloudbursts, stationary monsoon troughs, and monsoon depressions.<br />
Cloudbursts. A cloudburst is an extreme form <strong>of</strong> precipitation, sometimes with hail and thunder, which<br />
normally lasts no longer than a few minutes but is capable <strong>of</strong> creating flood conditions. Cloudbursts occur<br />
when air masses are heated intensely and rise rapidly to form thunderclouds. When these clouds interact with<br />
the local topography, they <strong>of</strong>ten move upwards, especially if the atmospheric flow is perpendicular to the<br />
topographic features. Intense precipitation typically involves some connection to monsoon air masses, which<br />
originate in the tropics and are typically warm and heavily laden with moisture (Kelsch et al. 2001). A lack<br />
<strong>of</strong> wind al<strong>of</strong>t prevents the dissipation <strong>of</strong> thunderclouds and facilitates concentrated cloudbursts which typically<br />
deposit precipitation in a small localised area.<br />
Session 3<br />
Monsoon trough. Intense rainfall can also be caused by the prolonged stationary positioning <strong>of</strong> an intertropical<br />
convergence zone (ITCZ), commonly called a monsoon trough. An ITCZ is an elongated zone or low<br />
pressure system which typically sits along the mountain range. This type <strong>of</strong> meteorological phenomenon was<br />
responsible for record precipitation in the upper region <strong>of</strong> the Mahabharat Range in the central part <strong>of</strong> Nepal<br />
on 19-20 July 1993. On 20 July, Tistung station measured a rainfall <strong>of</strong> 540 mm in 24 hours, and the gauge<br />
recorded a maximum rainfall <strong>of</strong> 70 mm in one hour (Shrestha 2008).<br />
Monsoon depressions. Intense monsoon depressions seldom reach the mountain areas during the monsoon<br />
season. They are occasionally caused by strong westerly waves over northern Kashmir, which cause heavy<br />
to very heavy rainfall in the lower Kashmir and Jammu Valley, resulting in devastating flash floods. Westerly<br />
waves moving across Kashmir and the northern parts <strong>of</strong> Pakistan can strengthen the monsoon depression. In<br />
July 2005, this type <strong>of</strong> a depression moved into Punjab and Kashmir and caused heavy rainfall in the upper<br />
catchment <strong>of</strong> the Chenab River (Shrestha 2008). Since the mountain catchments are very steep, the river<br />
flooded quickly.<br />
Geo-environmental causes <strong>of</strong> flash floods<br />
Geo-environmental factors can also precipitate flash flooding. The main geo-environmental factors to causes<br />
flash floods are the outburst <strong>of</strong> a landslide dam and the outburst <strong>of</strong> a glacial lake.<br />
Outburst <strong>of</strong> landslide dams. The HKH region is prone to recurrent and <strong>of</strong>ten devastating landslides because<br />
the mountain slopes <strong>of</strong> the HKH are both steep and unstable. Excessive precipitation and earthquakes can<br />
cause the slopes to landslide. The landslides and debris flow can form temporary dams across river courses,<br />
impounding immense volumes <strong>of</strong> water. A landslide dam outburst flood (LDOF) can occur when these<br />
makeshift dams are overtopped or water breaks through.<br />
23
<strong>Flash</strong> <strong>Flood</strong> <strong>Risk</strong> <strong>Management</strong> – A <strong>Training</strong> <strong>of</strong> <strong>Trainers</strong> Manual<br />
As the reservoir level rises (due to river flow or otherwise) and overtops the dam crest the dam can suddenly<br />
erode and outburst. The dam can also be overtopped when a secondary landslide falls into the reservoir.<br />
Alternatively, since landslide dams are only makeshift, their own internal instabilities can trigger an outbreak<br />
even without overtopping. Landslide dam outburst floods scrape out riverbeds and banks causing heavy<br />
damage to the riparian areas and huge sedimentation in downstream areas.<br />
In general, high landslide dams form in steep, narrow, valleys because this is where landslide debris gathers<br />
(Costa and Schuster 1988). Commonly, large landslide dams are caused by complex landslides that start<br />
as slumps or slides and become rock or debris avalanches. Volcanic eruptions can also cause the formation<br />
<strong>of</strong> dams, but there are no such examples in the HKH region. Other mechanisms that can contribute to the<br />
formation <strong>of</strong> landslide dams are stream under-cutting and entrenchment.<br />
Outburst <strong>of</strong> glacial lakes. Glacial lakes form as glaciers recede, and their formation is directly related to<br />
climate variability. When glaciers recede they leave behind large voids that are filled with melt-water; these<br />
are moraine-dammed glacial lakes. Moraine dams are structurally weak and unstable; they undergo constant<br />
changes due to slope failures, slumping, and other such effects. When a moraine dam fails catastrophically<br />
the result is a glacial lake outburst flood (GLOF).<br />
Session 3<br />
Glacial lake outbursts are a main cause <strong>of</strong> flash floods in the HKH. Glacial lakes can burst due to internal<br />
instabilities in the natural moraine dam triggered by hydrostatic pressure, erosion, overtopping, or other<br />
internal structural failure. Glacial lakes can also burst due to external triggers such as rock or ice avalanches,<br />
earthquakes, and the like. A GLOF can result in the discharge <strong>of</strong> water and debris whose flow is several<br />
orders <strong>of</strong> magnitude greater than seasonal high flow. Bhutan, China, Nepal, and Pakistan have suffered a<br />
number <strong>of</strong> GLOFs in the past (Ives et al. 2010).<br />
Avalanches and earthquakes can also trigger GLOF events depending on the severity, magnitude, location,<br />
and other characteristics. Moraine dams can also collapse without the aid <strong>of</strong> an external trigger, such as<br />
when the dam slopes fail or when there is excessive seepage from the natural drainage network <strong>of</strong> the dam.<br />
Outbreak <strong>of</strong> artificial structures. The failure <strong>of</strong> artificial structures can also cause tremendous flash floods.<br />
As more and more river basins in the HKH are being exploited by people, flash floods due to the failure <strong>of</strong><br />
human-made hydraulic structures will likely increase. <strong>Flash</strong> floods can occur when there is the uncoordinated<br />
operation <strong>of</strong> a hydraulic structure. Moreover, when settlements are constructed on natural flood plains and<br />
water is re-channelled it can lead to conditions that can cause flash floods. Other causes <strong>of</strong> flash flooding are<br />
urban infrastructure development and deforestation (due to increasing urbanisation in mountain areas), and<br />
failure to maintain drainage systems.<br />
RM 3.2: Outcomes and impacts <strong>of</strong> flash floods<br />
<strong>Flash</strong> flood waters flow at high speed and carry large amounts <strong>of</strong> debris. These debris laden waters can<br />
cause the loss <strong>of</strong> life and can sweep away critical infrastructure that is the lifeline <strong>of</strong> mountain communities.<br />
Some <strong>of</strong> the destruction which is caused by flash floods is immediately apparent while some subtly<br />
undermines existing structures and the true damage is not seen until some later time. Some <strong>of</strong> the destruction<br />
is short term while some has long term detrimental effects on the environment and the socio-economic life <strong>of</strong><br />
communities. Typical flood losses are given in Figure 4.<br />
Socioeconomic<br />
Landslides and debris flows can have major socioeconomic impacts and can affect people, their homes,<br />
possessions, industrial establishments, and lifelines such as highways, railways, and communication systems.<br />
The indirect effects <strong>of</strong> flash floods are also many and can encompass aspects as diverse as reducing real<br />
estate values, causing the loss <strong>of</strong> industrial, agricultural, and forest productivity; and causing the loss <strong>of</strong> tourist<br />
revenues by damaging land or facilities or by interrupting transportation systems.<br />
24
Day 1<br />
Figure 4: Categorisation <strong>of</strong> flood losses<br />
<strong>Flood</strong> Losses<br />
Tangible direct losses<br />
Tangible indirect losses<br />
Intangible human<br />
and other losses<br />
Primary<br />
Damage to:<br />
• Buildings (e.g., houses)<br />
• Contents <strong>of</strong> buildings<br />
• Infrastructure<br />
(e.g., roads, bridges)<br />
• Crops and animals<br />
Loss <strong>of</strong> or disruption to:<br />
• Agricultural production<br />
• Industrial production<br />
• Communications (e.g., road, rail,<br />
and telecommunications)<br />
• Health care and education services<br />
• Utility supplies (e.g., electricity)<br />
• Loss <strong>of</strong> life<br />
• Physical injury<br />
• Loss <strong>of</strong> heritage or<br />
archaeological sites<br />
Secondary<br />
• Fire and fire damage<br />
• Contamination <strong>of</strong> land<br />
and reduced crop<br />
yields due to salt in<br />
seawater<br />
• Cut electricity supply,<br />
damaging susceptible<br />
machines and<br />
computer function<br />
• Lost value added in industry<br />
• Increased traffic congestion and<br />
costs<br />
• Disruption <strong>of</strong> flow <strong>of</strong> employees to<br />
work causing “knock-on” effects<br />
• Contamination <strong>of</strong> water supplies<br />
• Food and other shortages<br />
• Increased costs <strong>of</strong> emergency<br />
services<br />
• Loss <strong>of</strong> income<br />
• Increased household costs<br />
• Increased stress<br />
• Physical and<br />
psychological trauma<br />
• Increase in floodrelated<br />
suicides<br />
• Increase in waterborne<br />
diseases<br />
• Increase in ill health<br />
• Increase in post-flood<br />
visits to doctors<br />
• Hastened and/or<br />
increased mortality<br />
Session 3<br />
Tertiary<br />
• Enhanced rate <strong>of</strong><br />
property deterioration<br />
and decay<br />
• Long-term rot and<br />
damp<br />
• Weakened structures,<br />
making them more<br />
damage prone in<br />
subsequent floods<br />
• Some businesses bankrupt<br />
• Loss <strong>of</strong> exports<br />
• Reduced national gross domestic<br />
product<br />
• Homelessness<br />
• Loss <strong>of</strong> livelihoods<br />
• Total loss <strong>of</strong><br />
possessions (i.e.,<br />
uninsured)<br />
• Blighted families<br />
• Loss <strong>of</strong> community<br />
where communities are<br />
broken up<br />
Source: Parker (2000)<br />
25
<strong>Flash</strong> <strong>Flood</strong> <strong>Risk</strong> <strong>Management</strong> – A <strong>Training</strong> <strong>of</strong> <strong>Trainers</strong> Manual<br />
Environmental<br />
<strong>Flash</strong> floods in the HKH take a great toll on the natural environment. Mudflows can cover terraced lands with<br />
boulders and debris and can damage standing crops laying waste to agricultural fields. In the foothills and<br />
plains <strong>of</strong> the river valleys, floods <strong>of</strong>ten deposit coarse sediment, which not only damages valuable crops but<br />
also renders the land infertile. <strong>Flood</strong>s cause severe bank erosion and the loss <strong>of</strong> soil. Debris flows aggrade<br />
river beds, divert flows, and can cause riverine floods. When rivers change their course, the environmental<br />
setting is altered.<br />
Session 3<br />
26
Day 1<br />
Session 4 <strong>Flash</strong> <strong>Flood</strong> Hazard<br />
Analysis and Assessment<br />
Time: 90 minutes<br />
Objectives<br />
To understand flash flood hazards and to be able to understand:<br />
XX<br />
The concepts <strong>of</strong> risk and hazard<br />
XX<br />
The methods <strong>of</strong> hazard analysis and assessment<br />
Activities<br />
Activity 4.1: <strong>Flash</strong> flood risks and hazards<br />
Time: 30 minutes<br />
Step 1<br />
Step 2<br />
Step 3<br />
Engage the participants in a short interactive question and answerer session; ask the class how the<br />
concepts <strong>of</strong> risk and hazard apply to flash floods.<br />
Clarify the concepts and introduce the source-pathway-receptor-consequence conceptual model <strong>of</strong><br />
risk.<br />
Present the major steps involved in flash flood risk assessment and explain what information it is<br />
necessary to obtain from primary and secondary sources. Clarify that hydrological, meteorological,<br />
land use, and geographical information can be collected from secondary sources but that socioeconomic<br />
and geo-morphological data need to be collected from the field. Emphasise that field<br />
verification is important for all data.<br />
Note to the<br />
trainer<br />
Before beginning the next activity take a moment to put things<br />
into perspective. Explain that risk assessment is the most essential<br />
part <strong>of</strong> the flash flood risk management process. Clarify that<br />
analysis and assessment <strong>of</strong> hazard and vulnerability are the<br />
prerequisites for risk assessment and that the following activity<br />
and the following session are leading up to this.<br />
The analysis leading up to risk assessment is a multi-step process,<br />
where the steps are:<br />
• The collection <strong>of</strong> essential information on the flood prone<br />
area as needed; and can include geographical, geological,<br />
hydrometeorological, land-use, and land-cover data as well<br />
as historical information on past flood events<br />
• The actual hazard analysis and assessment<br />
• The vulnerability assessment<br />
• The risk assessment<br />
session 4<br />
27
<strong>Flash</strong> <strong>Flood</strong> <strong>Risk</strong> <strong>Management</strong> – A <strong>Training</strong> <strong>of</strong> <strong>Trainers</strong> Manual<br />
Activity 4.2: Methods <strong>of</strong> hazard analysis and assessment<br />
Time: 60 minutes<br />
Step 1<br />
Step 2<br />
Step 3<br />
Step 4<br />
Review the fact that analysis <strong>of</strong> hazard is based on information collected from different sources as<br />
discussed in Activity 4.1.<br />
Discuss the various methods <strong>of</strong> flash flood hazard analysis. Give a presentation that lists the<br />
methods and gives their major characteristics. Emphasise that a combination <strong>of</strong> social (communitybased)<br />
and technical methods gives the best results.<br />
Clarify the concept <strong>of</strong> hazard intensity and hazard probability level and discuss how they are<br />
determined. Discuss how probability levels are assigned both to flash flood that are cause by<br />
intense rainfall and to flash floods that are caused by other means.<br />
Present the hazard-level scale and explain how it is determined.<br />
session 4<br />
28
Day 1<br />
Session 4 Resource Materials<br />
RM 4.1: <strong>Flash</strong> flood risks and hazards<br />
<strong>Flash</strong> flood risk refers to the chance for loss <strong>of</strong> life and property due to flash floods. <strong>Flood</strong> risk, in simple terms,<br />
is a function <strong>of</strong> flood hazard and vulnerability (Box 2). <strong>Flash</strong> flood hazards are those potentially damaging<br />
flood events that cause losses. Vulnerability is the capacity (or lack <strong>of</strong> capacity) <strong>of</strong> people to anticipate,<br />
resist, or cope with the event. <strong>Flash</strong> flood risk<br />
can be better understood using the ‘sourcepathway-receptor-consequence’<br />
(S-P-R-C)<br />
conceptual model proposed by Gouldby and<br />
Samuals (2005). For risk to arise there must be<br />
hazard, which is the source or initiator event<br />
(e.g., cloudburst); the pathway is the conduit<br />
between the source and receptors (e.g., flood<br />
routes, overland flow, or landslide); and the<br />
receptors are the people and property that are<br />
affected. The consequence depends on the<br />
degree to which the receptors are exposed to<br />
the hazard (Figure 5).<br />
Box 2: <strong>Risk</strong> is a function <strong>of</strong>…<br />
• The characteristics <strong>of</strong> a hazard event<br />
• The vulnerability (exposure/sensitivity) <strong>of</strong> assets<br />
and livelihoods to potential hazards<br />
• The options available for risk management, and<br />
the capacity to access them<br />
The risk can be evaluated by considering <strong>of</strong><br />
the following components: the nature and<br />
probability <strong>of</strong> the hazard; the degree to which<br />
the receptors (number <strong>of</strong> people and amount<br />
<strong>of</strong> property) are exposed to the hazard; the<br />
susceptibility <strong>of</strong> the receptors to the hazards;<br />
and the value <strong>of</strong> the receptors.<br />
Steps in flash flood risk assessment<br />
The major steps taken to assess risk include the<br />
following:<br />
• Collecting information about the flood<br />
prone area. The information needed<br />
includes: determining which localities or<br />
communities are at risk; evaluating the<br />
geographic characteristics such as the<br />
length <strong>of</strong> the river sections; peculiarities<br />
<strong>of</strong> the area, population and population<br />
distribution; geology and geomorphology;<br />
hydrology and hydraulics information;<br />
hydrometeorology; land-use; historical<br />
information on flooding in the area and<br />
existing counter measures.<br />
• Assessing hazard or determining hazard<br />
level and intensity<br />
• Assessing vulnerability<br />
• Assessing risk<br />
Figure 5: Conceptual source-pathway-receptorconsequence<br />
(S-P-R-C) model<br />
Source<br />
e.g., intense rainfall, displacement wave,<br />
landslide blocking riverflow<br />
Pathways<br />
e.g., dam breach, inundation, overflow<br />
Receptors<br />
e.g., people, infrastructure,<br />
property, environment<br />
Consequence<br />
e.g., loss <strong>of</strong> life, stress, material damage,<br />
environmental degradation<br />
session 4<br />
29
<strong>Flash</strong> <strong>Flood</strong> <strong>Risk</strong> <strong>Management</strong> – A <strong>Training</strong> <strong>of</strong> <strong>Trainers</strong> Manual<br />
RM 4.2: Methods <strong>of</strong> hazard analysis and assessment<br />
The different scenarios <strong>of</strong> flash flood hazard can be analysed using various methods and tools and the<br />
findings can be presented in the form <strong>of</strong> hazard maps. Modern technology has advanced hazard mapping<br />
and the prediction <strong>of</strong> possible events considerably through techniques such as geological mapping and<br />
satellite imagery, high resolution mapping, and computer modelling. Geographic information system (GIS)<br />
mapping techniques, in particular, are revolutionising the process <strong>of</strong> preparing hazard maps. Computer-based<br />
modelling techniques and community-based hazard mapping techniques are the cornerstones <strong>of</strong> hazard<br />
analysis. Even more reliable results can be achieved when the two methods are combined and the results are<br />
substantiated through field verification.<br />
Hazard analysis is directed at understanding the intensity <strong>of</strong> the flood hazard, the strength <strong>of</strong> potential<br />
flash floods, and the scenarios for the catchment. The intensity <strong>of</strong> the hazard is determined by estimating<br />
the degree <strong>of</strong> the anticipated flooding. Generally, the degree <strong>of</strong> intensity is classified as high, moderate,<br />
moderately low, or low (Table 2).<br />
After estimation <strong>of</strong> the degree <strong>of</strong> the intensity <strong>of</strong> the potential hazard, the hazard probability level is assigned.<br />
The probability <strong>of</strong> flash flooding is based on the return period <strong>of</strong> the flood. If the return period is short, the<br />
probability <strong>of</strong> hazard is high and vice versa. It is relatively straightforward to assign a return period or<br />
frequency when the flooding is caused by rainfall. However, it is <strong>of</strong>ten difficult to assign a probability level<br />
to flash flood events such as LDOFs and GLOFs, as they occur infrequently and are seldom repeat events.<br />
In such cases, it is customary to use probability levels based on the characteristics <strong>of</strong> the lake, dam, or<br />
surrounding environment. The characteristics <strong>of</strong> the surroundings are determined qualitatively.<br />
As in the case <strong>of</strong> the degree <strong>of</strong> intensity, the four levels <strong>of</strong> hazard probability are high, moderate, moderately<br />
low, and low.<br />
session 4<br />
Assessing hazard consists <strong>of</strong> considering both the intensity <strong>of</strong> the potential hazard and its probability. Figure<br />
6 shows an example <strong>of</strong> a hazard-level scale. Both the hazard probability and the degree <strong>of</strong> hazard intensity<br />
have four levels (high, moderate, moderately low, low). The resulting 16-cell hazard-level scale identifies four<br />
hazard levels: very high, high, moderate, and low.<br />
Table 2: A simple way <strong>of</strong> assigning hazard intensity<br />
Hazard intensity<br />
Danger to<br />
population close to<br />
the stream<br />
Danger to population in<br />
settlement (about 500 m<br />
from the stream)<br />
Danger to population<br />
1 km away from the<br />
stream<br />
High yes yes yes yes<br />
Moderate yes yes yes no<br />
Moderately Low yes yes no no<br />
Low yes no no no<br />
Danger to population<br />
more than 1 km<br />
away from the stream<br />
Figure 6: Hazard-level scale<br />
Probability level<br />
Moderately<br />
Moderate<br />
low<br />
High<br />
Low<br />
Hazard level<br />
Hazard intensity<br />
High<br />
Moderate<br />
Moderately<br />
low<br />
Low<br />
Very high<br />
High<br />
Moderate<br />
Low<br />
30
Day 2<br />
Session/Activity<br />
Session 5: Vulnerability and <strong>Flash</strong> <strong>Flood</strong> <strong>Risk</strong> Assessment<br />
Activity time<br />
(minutes)<br />
Cumulative time<br />
<strong>of</strong> session<br />
5.1 Methods <strong>of</strong> vulnerability assessment 60 60<br />
5.2 <strong>Flash</strong> flood risk assessment 30 90<br />
Session 6: Local Knowledge on Disaster <strong>Management</strong><br />
6.1<br />
6.2<br />
6.3<br />
Concept <strong>of</strong> local knowledge and its role in disaster<br />
management<br />
How to identify and document local knowledge related to<br />
disaster management<br />
Advantages and limitations <strong>of</strong> local knowledge in disaster<br />
management<br />
35 35<br />
15 50<br />
15 65<br />
6.4 Methods <strong>of</strong> transferring scientific knowledge to the community 10 75<br />
Session 7: Community-Based <strong>Flash</strong> <strong>Flood</strong> <strong>Risk</strong> <strong>Management</strong><br />
7.1 Importance <strong>of</strong> community level flash flood risk management 10 10<br />
7.2<br />
Process <strong>of</strong> community participation in flash flood risk<br />
management<br />
20 30<br />
7.3 Structure, responsibilities, and empowerment <strong>of</strong> the CFFRMC 15 45<br />
7.4 Characteristics <strong>of</strong> good community governance 05 50<br />
7.5 Role <strong>of</strong> government in community flash flood risk management 10 60<br />
Session 8: Gender Perspectives in Disaster <strong>Management</strong><br />
8.1 Concept <strong>of</strong> gender and gender differences 10 10<br />
8.2 Gender and flash flood risk management 15 25<br />
8.3 Gender-sensitive flash flood risk management 20 45<br />
Session 9: Social Hazard Mapping and <strong>Risk</strong> Assessment<br />
9.1 Concept and importance <strong>of</strong> social hazard mapping 10 10<br />
9.2 Process <strong>of</strong> social hazard mapping 35 45<br />
9.3 Process <strong>of</strong> participatory GIS mapping (PGIS) <strong>of</strong> hazards 15 60
<strong>Training</strong> <strong>of</strong> <strong>Trainers</strong> and Resource Manual on Access and Benefit Sharing<br />
Session 5 Vulnerability and<br />
<strong>Flash</strong> <strong>Flood</strong> <strong>Risk</strong> Assessment<br />
Time: 90 minutes<br />
Objective<br />
To understand vulnerability and risk assessment by:<br />
XX<br />
Understanding the concept <strong>of</strong> vulnerability<br />
XX<br />
Becoming familiar with the methods <strong>of</strong> vulnerability assessment<br />
XX<br />
Learning about risk levels and risk assessment<br />
Activities<br />
Activity 5.1: Methods <strong>of</strong> vulnerability assessment<br />
Time: 60 minutes<br />
Step 1<br />
Step 2<br />
Step 3<br />
Step 4<br />
Step 5<br />
Step 6<br />
Step 7<br />
Step 8<br />
Engage the participants in a short interactive question and answer session asking ‘what is<br />
vulnerability?’ in the context <strong>of</strong> flash floods.<br />
Clarify the concept <strong>of</strong> vulnerability and the levels <strong>of</strong> vulnerability. Present the different schools <strong>of</strong><br />
thought on vulnerability analysis.<br />
Present both the physical and social aspects <strong>of</strong> vulnerability assessment and discuss the assessment<br />
methods.<br />
Clarify the concepts <strong>of</strong> susceptibility and exposure. Explain the process <strong>of</strong> deriving vulnerability<br />
levels.<br />
Clarify the concept <strong>of</strong> exposure and discuss how exposure indicators are derived and expressed,<br />
e.g., high, medium, and low.<br />
Discuss socioeconomic vulnerability. Highlight adaptive capacity and its indicators.<br />
Discuss how quantitative adaptive indicators are converted to qualitative categories.<br />
Explain how physical and socioeconomic adaptive indicators are combined to assess vulnerability<br />
levels.<br />
session 5<br />
Note to the<br />
trainer<br />
Analysis <strong>of</strong> vulnerability is the third step in risk assessment.<br />
Remind the participants that collecting the essential data and<br />
analysing hazard are the first and second steps and that these<br />
were covered in the previous sessions. Discuss the different<br />
schools <strong>of</strong> thoughts on vulnerability and mention that current<br />
scientific thought favours using a combination <strong>of</strong> biophysical<br />
and socioeconomic indicators to get the best overall estimate <strong>of</strong><br />
vulnerability.<br />
32
Day 2<br />
Activity 5.2: <strong>Flash</strong> flood risk assessment<br />
Time: 30 minutes<br />
The aim <strong>of</strong> this activity is to bring together the concepts presented in the previous sessions and to show how<br />
all <strong>of</strong> these contribute to the final assessment <strong>of</strong> risk.<br />
Step 1<br />
Before beginning with the formal presentation engage the class in a short question and answer<br />
session on ‘what is risk assessment’? Clarify the concept and clear up any misconceptions.<br />
Step 2 Review the four levels <strong>of</strong> hazard and the four levels <strong>of</strong> total vulnerability (RM 5.1 and Figure 7);<br />
review how these are graded (i.e., high, moderate, moderately low, and low).<br />
Note to the<br />
trainer<br />
<strong>Risk</strong> assessment involves quantification <strong>of</strong> risk through<br />
understanding hazard, vulnerabilities, and exposure patterns.<br />
Reiterate that it is essential both to understand these aspects and<br />
to know how to grade them in order to be able to plan and to<br />
conceive strategies for risk management.<br />
Step 3<br />
Present the method <strong>of</strong> determining risk levels for risk assessment.<br />
session 5<br />
33
<strong>Training</strong> <strong>of</strong> <strong>Trainers</strong> and Resource Manual on Access and Benefit Sharing<br />
Session 5 Resource Materials<br />
RM 5.1: Vulnerability and methods <strong>of</strong> assessment<br />
In the context <strong>of</strong> flash floods, vulnerability refers to the capacity (or lack <strong>of</strong> capacity) <strong>of</strong> people to resist or<br />
cope with flash flood events. The extent <strong>of</strong> vulnerability, is expressed in terms <strong>of</strong> the vulnerability index which<br />
has four levels i.e., high, moderate, moderately low, and low.<br />
There are three schools <strong>of</strong> thought on vulnerability analysis. The first focuses on exposure to biophysical<br />
hazards (Heyman et al. 1991; Alexander 1993; Messner and Meyer 2005). The second looks at the<br />
social context <strong>of</strong> hazards and relates social vulnerability to the coping responses <strong>of</strong> communities, including<br />
societal resistance and resilience to hazards (Blaikie et al. 1994; Watts and Bohle 1993; Messner and<br />
Meyer 2005). The third combines the two approaches and defines vulnerability as a hazard <strong>of</strong> place, which<br />
encompasses biophysical risk as well as social response and action (Cutter 1996; Weichselgartner 2001;<br />
Messner and Meyer 2005). The third school <strong>of</strong> thought has become increasingly significant in the scientific<br />
community in recent years.<br />
Vulnerability has two dimensions – physical and social. Physical vulnerability is a function <strong>of</strong> susceptibility and<br />
exposure.<br />
Susceptibility is the state <strong>of</strong> being easily influenced by flash flood hazards. The elements most susceptible to<br />
flash flood hazards are the elements most at risk to flash floods. The most susceptible i.e., settlements very<br />
close to flood plains have a high vulnerability level. Susceptibility can be expressed in terms <strong>of</strong> a vulnerability<br />
index, which can be expressed in either monetary or non-monetary units. The vulnerability index is based on<br />
qualitative categories since many elements (such as human lives, ecological species, and landscapes) are<br />
difficult to quantify.<br />
Exposure refers to the type, extent, and magnitude <strong>of</strong> susceptible elements likely to be affected when a flash<br />
flood occurs. The exposure indicator depends on the proximity <strong>of</strong> the susceptible element to the river, river<br />
morphology, geology <strong>of</strong> the location, elevation, return period <strong>of</strong> the flood, flow velocity, and so on. It is<br />
evaluated similarly to susceptibility and it is also expressed in qualitative categories.<br />
Figure 7: Classification <strong>of</strong> risk level<br />
session 5<br />
High<br />
Vulnerability level<br />
Moderate<br />
Moderately<br />
low<br />
Low<br />
<strong>Risk</strong> level<br />
Very high<br />
High<br />
High<br />
Hazard level<br />
Moderate<br />
Moderately<br />
low<br />
Moderate<br />
Moderately low<br />
Low<br />
Low<br />
34
Day 2<br />
In a physically vulnerable zone, the extent <strong>of</strong> socioeconomic vulnerability depends to a large extent on the<br />
society’s capacity to adapt. Adaptive capacity is both a social and economic in nature. Settlements along<br />
riverbanks are vulnerable to flash floods debris fans. Poverty as well as limited access and control over<br />
various resources contribute to vulnerability. Adaptive capacity can be expressed either quantitatively or<br />
qualitatively. A few quantitative indicators <strong>of</strong> adaptive capacity include accessibility, availability <strong>of</strong> health<br />
facilities, availability <strong>of</strong> communication facilities, and income level. Those indicators have to be converted to<br />
qualitative categories so that they can be combined with qualitative indicators to estimate the socioeconomic<br />
vulnerability <strong>of</strong> the area in question. The qualitative indicators are those that encompass different risk<br />
management measures such as warning systems, loss reduction measures, social awareness, and attitude.<br />
Physical and socioeconomic vulnerability are converted into qualitative categories and combined to obtain<br />
the overall total vulnerability, which can also be reported in qualitative categories (e.g., high, moderate,<br />
moderately low, low).<br />
RM 5.2: <strong>Flash</strong> flood risk assessment<br />
A risk-level scale is the product <strong>of</strong> hazard level assessment and an estimation <strong>of</strong> total vulnerability. Four levels<br />
<strong>of</strong> hazard and four levels <strong>of</strong> total vulnerability (high, moderate, moderately low, and low) are used to estimate<br />
the risk level.<br />
The scale is derived by making informed but subjective judgments, and in this regard it is similar to the<br />
hazard-level scale. Figure 7 shows the risk-levels: very high, high, moderate, moderately low, and low.<br />
session 5<br />
35
<strong>Flash</strong> <strong>Flood</strong> <strong>Risk</strong> <strong>Management</strong> – A <strong>Training</strong> <strong>of</strong> <strong>Trainers</strong> Manual<br />
Session 6 Local Knowledge on<br />
Disaster <strong>Management</strong><br />
Time: 75 minutes<br />
Objective<br />
To understand what local knowledge is and what role it can play in disaster management by<br />
XX<br />
Introducing the concept <strong>of</strong> local knowledge<br />
XX<br />
Learning the methods needed to identify and document local knowledge on disaster management<br />
XX<br />
Identifying the strengths and weaknesses <strong>of</strong> local knowledge on disaster management<br />
XX<br />
Learning how scientific knowledge can be transferred to the community level<br />
Activities<br />
Activity 6.1: Concept <strong>of</strong> local knowledge and its role in disaster<br />
management<br />
Time: 35 minutes<br />
Step 1<br />
Clarify the concept <strong>of</strong> local knowledge and then engage class in a short question and answer<br />
session where the participants are encouraged to compare and contrast ‘scientific knowledge’ with<br />
‘local knowledge’ in the context <strong>of</strong> disaster management.<br />
Clarify how the scientific knowledge approach is top down while<br />
local knowledge is bottom up. Local knowledge is subjective;<br />
it comprises the beliefs and values <strong>of</strong> people in a specific<br />
place and time. Scientific knowledge is objective and it valid<br />
regardless <strong>of</strong> the context.<br />
Note to the<br />
trainer<br />
What people know is influenced both by what they experience<br />
and by the beliefs, worldviews, and values <strong>of</strong> their community.<br />
Indigenous knowledge is part <strong>of</strong> local knowledge. Local<br />
knowledge is a complex adaptive response to internal and<br />
external changes. All people have local knowledge, but<br />
indigenous people who still live in close harmony with nature<br />
have a deep understanding that comes from fine-tuning their<br />
understanding about nature and adjusting their practices<br />
over time. Their knowledge has been created, recreated, and<br />
transferred from one generation to the next. Specific practices<br />
based on local knowledge can vary depending on the<br />
practitioner’s ethnicity, clan, gender, age, wealth, educational<br />
status, and personal experiences.<br />
session 6<br />
36
Day 2<br />
Step 2<br />
Show the short video on local knowledge and flood preparedness in the Eastern Terai <strong>of</strong> Nepal.<br />
Note to the<br />
trainer<br />
About the video<br />
The video shows how the people <strong>of</strong> the Eastern Terai <strong>of</strong><br />
Nepal use local knowledge in flash flood and riverine flood<br />
preparedness. It also shows how these people live surrounded<br />
by numerous different stresses. Practitioners working in the<br />
field <strong>of</strong> flash flood management need to be aware that while<br />
communities exist in a give environmental context that this needs<br />
to be considered against the backdrop <strong>of</strong> their own particular<br />
socio-cultural, economic and political situation. The hazards <strong>of</strong><br />
flash floods need to be seen as one <strong>of</strong> the many natural hazards<br />
and other stresses that the community faces.<br />
Step 3<br />
Distribute Handout 6.1 and ask the participants to write down what they understand by ‘local<br />
knowledge’?<br />
Based on the video presentation and on their own experience, ask the class to write the answer <strong>of</strong><br />
the following questions:<br />
• What areas are covered by the term ‘local knowledge’? How does it cover both environmental<br />
knowledge and social and cultural aspects?<br />
• Where is local knowledge located?<br />
• Who in the community has local knowledge?<br />
• How and when is local knowledge produced, transmitted and/or lost?<br />
Step 4<br />
Step 5<br />
Ask the participants what role they think local knowledge plays in flash flood management.<br />
Clarify the importance <strong>of</strong> local knowledge in disaster management. Specifically mention how local<br />
knowledge can be used in flash flood management.<br />
Activity 6.2: How to identify and document local knowledge related to<br />
disaster management<br />
Time: 15 minutes<br />
Step 1<br />
Step 2<br />
Step 3<br />
Discuss why it is important to document local knowledge.<br />
Discuss the four pillars <strong>of</strong> local knowledge on disaster preparedness.<br />
Discuss the process <strong>of</strong> documenting local knowledge.<br />
Note to the<br />
trainer<br />
Reiterate that local knowledge is context specific and that it is<br />
not easy to generalise it and apply it to other areas. Clarify that<br />
the purpose <strong>of</strong> documenting local knowledge is not to conserve<br />
it, but rather to learn from it in order to create new concepts,<br />
methods, or strategies for improved flash flood and disaster<br />
management. Local knowledge is documented in the hope <strong>of</strong><br />
being able to use indigenous methods to strengthen the coping<br />
mechanisms that communities use to deal with disasters.<br />
session 6<br />
37
<strong>Flash</strong> <strong>Flood</strong> <strong>Risk</strong> <strong>Management</strong> – A <strong>Training</strong> <strong>of</strong> <strong>Trainers</strong> Manual<br />
Activity 6.3: Advantages and limitations <strong>of</strong> local knowledge in disaster<br />
management<br />
Time: 15 minutes<br />
Step 1<br />
Step 2<br />
Step 3<br />
Engage the class in a short question and answer session asking them what they perceive to be the<br />
links between local knowledge and disaster management. Discuss what can be learned from local<br />
knowledge for disaster management.<br />
Discuss the advantages <strong>of</strong> using local knowledge in disaster preparedness and management.<br />
Discuss the limitations <strong>of</strong> using local knowledge alone in disaster preparedness and management.<br />
Note to the<br />
trainer<br />
When presenting the advantages and limitations <strong>of</strong> using local<br />
knowledge in disaster preparedness and management, try to<br />
link the discussion with the video presentation and compare<br />
and contrast local activities with external, top-down strategies <strong>of</strong><br />
disaster preparedness and management.<br />
Activity 6.4: Methods <strong>of</strong> transferring scientific information to the<br />
community<br />
Time: 10 minutes<br />
In addition to local knowledge, it is important to understand the extent to which the community knows about<br />
the various scientific methods and information that may be available on flash flood management.<br />
Step 1<br />
Step 2<br />
Step 3<br />
Step 4<br />
Discuss why it is important to transfer scientific knowledge to the local level. Explain what different<br />
means can be used to disseminate information and that it is important to keep in mind that not<br />
all means <strong>of</strong> communication are available or applicable to the same extent in different places or<br />
situations.<br />
Discuss with the participants what kind <strong>of</strong> information it is necessary to disseminate and why.<br />
Emphasise that it is necessary to choose an avenue <strong>of</strong> communication that local people can rely on.<br />
Describe how information creates awareness and leads to changes in behaviour at the local level.<br />
Describe the process <strong>of</strong> communicating scientific information to the local level and describe the<br />
different methods that can be used.<br />
session 6<br />
38
Day 2<br />
Session 6 Handouts<br />
Handout 6.1: What is local knowledge?<br />
What are the different types<br />
<strong>of</strong> local knowledge that are<br />
relevant for the implementation<br />
<strong>of</strong> disaster management<br />
activities?<br />
Where is local knowledge<br />
located?<br />
Who has local knowledge<br />
within the community?<br />
How is local knowledge<br />
produced, transmitted,<br />
disseminated and/or lost?<br />
How does this knowledge<br />
change and why?<br />
When is local knowledge<br />
produced, transmitted,<br />
disseminated, and/or lost?<br />
Key characteristics<br />
session 6<br />
39
<strong>Flash</strong> <strong>Flood</strong> <strong>Risk</strong> <strong>Management</strong> – A <strong>Training</strong> <strong>of</strong> <strong>Trainers</strong> Manual<br />
Session 6 Resource Materials<br />
RM 6.1: Local knowledge and its role in flash flood management<br />
What is local knowledge?<br />
The term ‘local knowledge’ is used here in its broadest sense; it refers to what the people living with risk know<br />
about natural hazards, what they believe, and how they cope with different risk situations. Peoples’ practices,<br />
their lifestyles, and what they believe, all influence their knowledge on natural hazards. Local knowledge<br />
is unique to a given culture and it holistically comprises all <strong>of</strong> the complex diversity <strong>of</strong> how that society<br />
understands both the visible and invisible. Local knowledge and practices are place specific and can and do<br />
evolve; they are complex adaptive responses to change. In many cases, communities have been living with<br />
natural hazards for generations and have been able to cope and to adapt in order to minimise, reduce, or<br />
avoid the negative effects that natural hazards can have on their livelihoods, properties, and lives.<br />
<strong>Flash</strong> flood management is a major challenge for both government and non-governmental organisations<br />
(NGOs) mainly because <strong>of</strong> the difficulties associated with accurate forecasting and the short lead-times for<br />
issuing warnings. When dealing with flood preparedness and management activities, most agencies tend to<br />
favour scientific and specialised knowledge, a great deal <strong>of</strong> which cannot be assimilated in local contexts<br />
and realities. On the other hand, local knowledge can provide information related to the local context, local<br />
environmental variability, and specificities; local perceptions <strong>of</strong> natural hazards; community-valued trade<strong>of</strong>fs<br />
with respect to risk in the context <strong>of</strong> multiple stresses; local information on who are the vulnerable groups<br />
and individuals. Local knowledge can contribute by giving local advice on safe locations for construction<br />
sites (buildings and roads) and by being used together with conventional knowledge for hazard mapping.<br />
Local knowledge can also be used to inform: early warning systems, surveys, and other inventories to verify<br />
information, as well as to help adapt communication strategies to local understanding and perceptions, and<br />
to integrate local values into the decision-making processes. The incorporation <strong>of</strong> local knowledge in disaster<br />
preparedness and management activities can be made cost-effective, efficient, and sustainable. In the HKH,<br />
local knowledge is even more pertinent than elsewhere because, since many communities are isolated and<br />
remote, local knowledge is <strong>of</strong>ten all that is available.<br />
Where can local knowledge be found?<br />
Local knowledge is everywhere: in people’s heads, their beliefs, cultural and religious ceremonies, practices,<br />
taboos, local rules, songs, and proverbs. Local knowledge resides at the individual and household level as<br />
well as at the collective level, gathered and transmitted by community stewards and other key social actors.<br />
We all have local knowledge, but it may differ by ethnicity, clan, gender, age, sex, socio-economic group,<br />
and educational level.<br />
When and how is local knowledge created and transformed?<br />
Local knowledge is dynamic; it is both created and lost over time. Unlike conventional or scientific<br />
knowledge, local knowledge depends more on memory, intuition, and the senses than on the intellect. Local<br />
knowledge is always gained through experience and is transferred from one generation to the next.<br />
session 6<br />
RM 6.2: Identifying and documenting local knowledge<br />
Local knowledge is not instantly available and cannot always be easily documented. To document local<br />
knowledge it is first necessary to spend some time with the community to understand everyday livelihood<br />
practices and to observe practices, events, and activities that are part <strong>of</strong> their local knowledge. Figure 8<br />
provides a simple framework describing how local knowledge on disaster preparedness is related to:<br />
40
Day 2<br />
Figure 8: The four pillars <strong>of</strong> local knowledge on disaster preparedness<br />
(1) Observation<br />
(2) Anticipation<br />
(3) Adaptation<br />
(4) Communication<br />
People’s experience <strong>of</strong><br />
the local surroundings<br />
People’s identification<br />
and monitoring<br />
<strong>of</strong> environmental<br />
indicators<br />
People’s access to<br />
assets and their<br />
ability to learn self<br />
organize re-organize<br />
innovate etc<br />
People’s ability to<br />
transfer knowledge<br />
among themselves<br />
and between<br />
generations<br />
History <strong>of</strong> natural hazards<br />
Examples: knowledge<br />
on the location, time,<br />
duration, frequency, intensity,<br />
predictability <strong>of</strong> previous<br />
hazards<br />
Early warning signals<br />
Examples: interpretational<br />
knowledge <strong>of</strong> changes<br />
in animal behaviours<br />
vegetation patterns<br />
knowledge <strong>of</strong> local weather<br />
forecast<br />
Human assets<br />
Examples: specific skills such<br />
as traditional carpenters and<br />
masons<br />
Oral and written<br />
communication<br />
Examples: local songs,<br />
poems, proverbs which help<br />
the younger generation and<br />
outsiders to learn about<br />
previous hazards, stories <strong>of</strong><br />
previous hazards encoded in<br />
the name <strong>of</strong> specific places<br />
Nature <strong>of</strong> natural hazards<br />
Examples: knowledge on the<br />
onset origin velocity <strong>of</strong> water<br />
flow; knowledge <strong>of</strong> different<br />
types <strong>of</strong> rain<br />
Time thresholds<br />
Examples: knowledge <strong>of</strong><br />
when it is time to buy and<br />
store food in advance,<br />
leave the house, move the<br />
cattle, and remove important<br />
belongings<br />
Sociocultural assets<br />
Examples: knowledge<br />
<strong>of</strong> different social groups<br />
depending on occupational,<br />
physical ability, ethnicity,<br />
gender, caste, class, and<br />
age characteristics<br />
Early warning systems<br />
Examples: use <strong>of</strong> visual<br />
signals such as mirrors, fire<br />
or audio signals such as<br />
drums; having dreams <strong>of</strong><br />
natural hazards in advance<br />
Evolution <strong>of</strong> social and<br />
physical vulnerabilities to<br />
natural hazards<br />
Example: life stories<br />
explaining the<br />
impoverishment processes<br />
<strong>of</strong> households following<br />
recurrent natural hazards<br />
and other stresses<br />
Escape route and safe<br />
places for humans and<br />
cattle<br />
Examples: knowledge <strong>of</strong> the<br />
safest and fastest routes<br />
Institutional assets<br />
Examples: knowledge<br />
generated by local<br />
institutions and cross-scale<br />
linkages<br />
Other practices<br />
Examples: taboos which<br />
prevent people from going<br />
to certain hazard prone<br />
areas, ceremonies, local art<br />
which helps the community<br />
to understand, remember<br />
past natural hazards, and<br />
relieve the anxiety related to<br />
the threat <strong>of</strong> future hazards<br />
Key actors and skills<br />
Examples: knowledge <strong>of</strong><br />
who knows what, who does<br />
what and when, who stays<br />
behind, who goes first<br />
Financial assets<br />
Examples: micro-finance<br />
arrangements such as credits<br />
and savings<br />
Natural assets<br />
Examples: natural resource<br />
management strategies<br />
such as intercropping and<br />
agr<strong>of</strong>orestry that conserve<br />
biodiversity and protect soil<br />
erosion and can contribute<br />
to reducing the impacts <strong>of</strong><br />
natural hazards<br />
Physical assets<br />
Examples: infrastructural<br />
safety arrangements such as<br />
boats housing, embankments<br />
Source: Dekens (2007)<br />
session 6<br />
41
<strong>Flash</strong> <strong>Flood</strong> <strong>Risk</strong> <strong>Management</strong> – A <strong>Training</strong> <strong>of</strong> <strong>Trainers</strong> Manual<br />
• people’s ability to observe their local surroundings;<br />
• people’s capacity to identify and monitor environmental indicators (<strong>of</strong> an upcoming flood);<br />
• people’s ability to develop adaptation strategies for recurrent floods;<br />
• people’s ability to communicate understanding <strong>of</strong> past and present floods.<br />
As a general procedure, practitioners working in the area <strong>of</strong> disaster management should remember to ask<br />
questions related to these four key dimensions to try to understand both what people know about natural<br />
hazards in their locality and what they do for disaster preparedness.<br />
In trying to identify and document local knowledge, one should always be open to observing local customs,<br />
events, and activities. Documenting local knowledge is a discovery process that takes place by observing<br />
people in their day-to-day lives in their own context; it should take place by observation and by using one’s<br />
own senses much more than by interrogating the community. It is important to observe how people categorise<br />
their observations and give meaning to them. The observer/researcher needs to be keenly aware that the<br />
act <strong>of</strong> discovery can be affected by the power relation that he or she has in the community. Research should<br />
be reflexive. The researcher needs to be able to put aside his own preconceptions when he observes and<br />
interprets what local people do. The researcher also needs to be able to question what he perceives to ensure<br />
that he is not filtering the information according to his own socio-cultural bias.<br />
Documentation not only helps to preserve local knowledge; it also helps to inform those wishing to work<br />
with communities to strengthen sustainable and equitable local coping mechanisms. Well documented local<br />
knowledge also helps to create new concepts, methods, or strategies for improved disaster management.<br />
RM 6.3: Advantages and limitations <strong>of</strong> local knowledge in disaster<br />
management<br />
Local knowledge and practices have several advantages when compared to most external, top-down<br />
strategies. When the local knowledge is not taken into consideration and used fully, it is highly likely that the<br />
following will result.<br />
• Community dependence on external help can be increased and unsustainable disaster management<br />
activities promoted.<br />
• When the situation is not considered holistically and when there is no pr<strong>of</strong>ound understanding and<br />
analysis <strong>of</strong> the vulnerability context, new vulnerabilities and disasters can be created.<br />
• Projects intended to benefit the entire community may not reach the most vulnerable and disadvantaged.<br />
• Valuable opportunities that could strengthen good local practices and attenuate unsustainable ones for<br />
creative and innovative solutions can be missed.<br />
• Misunderstandings, resentments, and lack <strong>of</strong> trust can develop between the community members and those<br />
trying to help them.<br />
• Inappropriate technologies, ideas, or communication strategies can be promoted owing to a<br />
misunderstanding <strong>of</strong> local contexts – the result <strong>of</strong> which is <strong>of</strong>ten a negative impact on the environment<br />
and/or the economy.<br />
• Community involvement and ownership may be lacking, and resistance to change may result.<br />
• Monitoring and other disaster management activities can be diminished or totally neglected.<br />
• Possible future relationships on development projects can be irreparably damaged or compromised.<br />
session 6<br />
The following are the major limitations or barriers to the use <strong>of</strong> local knowledge in disaster management and<br />
disaster preparedness.<br />
• Local knowledge may be perceived as unscientific and inferior to conventional knowledge.<br />
• People can be fatalistic and <strong>of</strong>ten live at risk because <strong>of</strong> lack <strong>of</strong> knowledge.<br />
• Local knowledge is difficult to identify, use, assess, validate, generalise, and replicate.<br />
• Local knowledge is <strong>of</strong>ten monopolised by dominant groups in the community.<br />
• Some local practices, beliefs, and adaptation strategies are unsustainable and/or not socially equitable.<br />
42
Day 2<br />
• As a result <strong>of</strong> rapid changes in society, local knowledge and practices are increasingly considered<br />
inappropriate, irrelevant, or inaccessible.<br />
• Local knowledge lacks credibility within the communities themselves, especially with the younger<br />
generations.<br />
• The focus on local knowledge may be a threat to national interests and political structures, especially in<br />
authoritarian regimes.<br />
• Some people worry that documentation <strong>of</strong> local knowledge can make it available to outsiders who can<br />
then use it to gain control over communities and their resources.<br />
RM 6.4: Methods and process <strong>of</strong> information dissemination<br />
Communication is a process whereby information is transmitted by a sender to a receiver via some medium.<br />
The receiver then decodes the message and gives the sender feedback. All forms <strong>of</strong> communication require<br />
a sender, a message, and an intended recipient; however, communication does not require the receiver to<br />
be present or aware <strong>of</strong> the sender’s intent to establish communication. Communication requires that all parties<br />
have an area <strong>of</strong> communicative commonality. It can take place through verbal means such as speech and<br />
tone <strong>of</strong> voice, or non-verbal means such as pictures, graphics, sound, and writing.<br />
In simple terms, the term ‘dissemination <strong>of</strong> information’ can be defined as the process <strong>of</strong> making information<br />
available. The dissemination <strong>of</strong> information is a one-way process. The disseminated information flows from the<br />
source to the target audience (the public). There may or may not be any feedback on the part <strong>of</strong> the public.<br />
It is usually initiated or organised by government, non-governmental organisations, and academic or private<br />
organisations. An organisation not only regulates the quality and quantity <strong>of</strong> information reaching the local<br />
level, but also disseminates it systematically to a select group <strong>of</strong> people.<br />
Communication continuum mode<br />
The main goal <strong>of</strong> transferring scientific information to local people is to make them aware <strong>of</strong> the various<br />
means <strong>of</strong> flash flood risk management. A more scientific approach can include using more precise ways <strong>of</strong><br />
estimating hazard levels, degrees <strong>of</strong> vulnerability, and risk levels as well as adding various other means <strong>of</strong><br />
disaster management (e.g., early warning systems, policy interventions, improving social resilience) to existing<br />
practices.<br />
People who have no access to other information usually depend on local knowledge, but this can change.<br />
The dissemination <strong>of</strong> scientific knowledge can lead communities to enhance their efforts. Exposure to scientific<br />
knowledge first raises people’s awareness. Next come understanding and acceptance, and then people can<br />
help bring about changes in how their community deals with disaster and flash flood risk management. Figure<br />
9 shows the key stages in the continuum <strong>of</strong> persuasive communication that leads to changes in behaviour. It is<br />
important to emphasise that those bringing scientific knowledge to communities that have not been previously<br />
exposed to it must be aware <strong>of</strong> the local knowledge systems and must work with the communities to design<br />
and implement effective communication.<br />
Figure 9: Stages <strong>of</strong> persuasive communication<br />
Communications continuum<br />
Awareness Understanding Acceptance<br />
Behavioural<br />
change<br />
session 6<br />
43
<strong>Flash</strong> <strong>Flood</strong> <strong>Risk</strong> <strong>Management</strong> – A <strong>Training</strong> <strong>of</strong> <strong>Trainers</strong> Manual<br />
Means <strong>of</strong> disseminating information<br />
There are many means <strong>of</strong> disseminating information to local people. However, it may be that not all are<br />
available or applicable to the same extent in all situations. The following are a few effective means <strong>of</strong><br />
disseminating information at the local level to consider.<br />
• Workshops at the local level<br />
• Community meetings and discussions<br />
• Local newspaper and radio programmes<br />
• Publication and distribution <strong>of</strong> reference materials<br />
• Publication and distribution <strong>of</strong> reports<br />
• Internet<br />
• Audio visual presentations<br />
• Demonstrations<br />
session 6<br />
44
Day 2<br />
Session 7 Community-Based <strong>Flash</strong> <strong>Flood</strong><br />
<strong>Risk</strong> <strong>Management</strong><br />
Time: 60 minutes<br />
Session 7<br />
Objective<br />
To appreciate the importance <strong>of</strong> community involvement, and to learn how to proceed in promoting<br />
community participation in flash flood risk management by:<br />
XX<br />
Appreciating the importance <strong>of</strong> community involvement in flash flood management<br />
XX<br />
Learning how the community can participate in flash flood management<br />
XX<br />
Involving the government in community flash flood risk management<br />
Activities<br />
Activity 7.1: Importance <strong>of</strong> community-level flash flood risk management<br />
Time: 10 minutes<br />
Step 1<br />
Step 2<br />
Step 3<br />
Step 4<br />
Define what a community is.<br />
Discuss the major features <strong>of</strong> community-based flash flood risk management and its importance.<br />
Discuss the need to involve communities in flash flood risk management.<br />
Explain the comparative advantages <strong>of</strong> community-based flash flood risk management and highlight<br />
the fact that it can be more sustainable, cheaper, easier to implement, and less detrimental to the<br />
environment than other approaches to flash flood risk management.<br />
Highlight the features <strong>of</strong> community-based approaches and discuss the advantages that they <strong>of</strong>fer.<br />
Activity 7.2: Process <strong>of</strong> community participation in flash flood risk<br />
management<br />
Time: 20 minutes<br />
Step 1<br />
Step 2<br />
Present and discuss the conceptual framework for community participation (see Figure 10 in<br />
RM 7.2). Clarify that the community not only manages the risk but also assesses the risk using local<br />
knowledge and experience.<br />
Discuss how to form a Community <strong>Flash</strong> <strong>Flood</strong> <strong>Risk</strong> <strong>Management</strong> Committee (CFFRMC) and<br />
remember to mention the importance <strong>of</strong> arranging community meetings and conducting needs<br />
assessments.<br />
Note to the<br />
trainer<br />
Discuss the following questions with the participants and make<br />
sure that they understand how these apply to their particular<br />
situations.<br />
Who calls the community meeting? How do you go about calling<br />
a meeting and where can it be held?<br />
• Communities have social organisations such as village<br />
councils, youth clubs, and mothers’ groups, which can serve<br />
45
<strong>Flash</strong> <strong>Flood</strong> <strong>Risk</strong> <strong>Management</strong>: A <strong>Training</strong> <strong>of</strong> <strong>Trainers</strong> Manual<br />
Session 7<br />
as centres for convening community meetings. It is important<br />
to remember that when the invitation to attend the meeting<br />
is extended by a person respected in the community or by a<br />
social worker, that the members <strong>of</strong> the community will see it<br />
as trustworthy.<br />
• The meeting venue can be a public place such as a<br />
community hall, village council hall, or other location that is<br />
convenient for the maximum number <strong>of</strong> villagers.<br />
Note to the<br />
trainer<br />
(continued)<br />
Who should be invited to the meeting?<br />
• When inviting community members to the meeting, remember<br />
to include people from all walks <strong>of</strong> life and from all segments<br />
<strong>of</strong> the society. Different people have different types <strong>of</strong><br />
knowledge and experience, so see to it that the meeting<br />
includes a good balance in terms <strong>of</strong> ethnicity, caste, and<br />
gender. Securing the contribution <strong>of</strong> all groups will best serve<br />
the goals <strong>of</strong> the committee.<br />
What initial information is required before the meeting?<br />
• To initiate the discussion with the community, collect<br />
information on past flash flood events and on the losses that<br />
the villagers may have incurred. Discuss what the community<br />
can do for flash flood risk management.<br />
• Assess the needs <strong>of</strong> the community with respect to education,<br />
awareness, training, weather forecasting, early warning, and<br />
demonstration for planning and flash flood risk management.<br />
The community can also assesses the risk <strong>of</strong> flash floods<br />
and prepare maps. (Note that the process <strong>of</strong> social hazard<br />
mapping is discussed in the forthcoming session).<br />
What can the community do?<br />
• Propose the ad hoc formation <strong>of</strong> a CFFRMC with broad<br />
participation and give the committee the responsibility for<br />
further planning and activities.<br />
Activity 7.3: Structure, responsibilities, and empowerment <strong>of</strong> the CFFRMC<br />
Time: 15 minutes<br />
Step 1<br />
Step 2<br />
Step 3<br />
Engage the participants in a short question and answer session on how the committee should<br />
be structured, how many sub-committees there should be, and so on. Discuss the advantages<br />
and disadvantages <strong>of</strong> having either too small or too large a committee with respect to general<br />
operations and decision making.<br />
Explain the structure <strong>of</strong> a typical CFFRMC. Clarify why an advisory committee is needed and how<br />
one can be formed. Remember to mention that based on the needs and on the recommendations <strong>of</strong><br />
the advisory committee, additional committees can be formed as needed.<br />
Present the roles and responsibilities <strong>of</strong> the CFFRMC and its sub-committees during all the phases<br />
<strong>of</strong> flash flood management, i.e., before, during, and after the flood event. Remember to point out<br />
that the committee is responsible for planning, implementing, and monitoring the various activities <strong>of</strong><br />
flash flood risk management that will help the community be better prepared for a flood disaster.<br />
46
Day 2<br />
Step 4<br />
Step 5<br />
Discuss the different ways that the CFFRMC can be empowered. Stress that institutional and<br />
financial empowerment are very important. The different sub-committees each have different<br />
responsibilities and a variety <strong>of</strong> skill types are required to staff them.<br />
Discuss the mechanisms that can be used for the financial empowerment <strong>of</strong> the committee<br />
Session 7<br />
Activity 7.4: Characteristics <strong>of</strong> good community governance<br />
Time: 5 minutes<br />
Step 1<br />
Step 2<br />
Discuss the importance <strong>of</strong> governance and enumerate the characteristics <strong>of</strong> good community<br />
governance.<br />
Discuss possible dispute resolution mechanisms. Note that a cell, department, or division can be<br />
formed within the CFFRMC to deal with dispute resolution. Point out that it is always best when<br />
internal mechanisms can be devised to resolve disputes, but that other mechanisms are available<br />
when this is not possible.<br />
Activity 7.5: Role <strong>of</strong> government in community flash flood risk<br />
management<br />
Time: 10 minutes<br />
Step 1<br />
Step 2<br />
Step 3<br />
Give a short presentation outlining why the government should be involved in community flash flood<br />
management.<br />
Discuss how the government can participate in community flash flood management, what sort <strong>of</strong><br />
activities it can be involved in, and how it can collaborate with the community.<br />
Explain how the government can be involved before, during, and after a flash flood.<br />
47
<strong>Flash</strong> <strong>Flood</strong> <strong>Risk</strong> <strong>Management</strong>: A <strong>Training</strong> <strong>of</strong> <strong>Trainers</strong> Manual<br />
Session 7 Resource Materials<br />
Session 7<br />
RM 7.1: The importance <strong>of</strong> community-level flash flood risk management<br />
A community is a group <strong>of</strong> multi-stakeholders in a particular geographical location who are exposed to<br />
common hazards including flash floods. The community is not a homogeneous unit but a dynamic mix <strong>of</strong><br />
different groups, interests, and attitudes.<br />
Community-based risk assessment (Table 3) is a<br />
simple method used to assess risk and to help<br />
design risk management plans. Community<br />
involvement is essential for the successful and<br />
effective management <strong>of</strong> risk because local<br />
people have a detailed knowledge <strong>of</strong> their<br />
village and the immediate vicinity and because<br />
they have a personal and vested interest<br />
in local affairs. Local people are not only<br />
interested and motivated to help, but also have<br />
the ability and the access to local resources<br />
to carry out the needed tasks. Centralised<br />
management and responses <strong>of</strong>ten fall short<br />
when it comes to assessing the needs <strong>of</strong> the<br />
most vulnerable. Community mobilisation is<br />
important, as individual households cannot<br />
perform all the necessary preparations<br />
Table 3: Features <strong>of</strong> a community based approach<br />
Feature Traditional Community based<br />
Concerned party Agency Community<br />
Main actors Programme staff Community<br />
residents<br />
Decision process Top-down Bottom-up<br />
Participation Selected/token Decided by the<br />
community<br />
Impact on Creates<br />
Empowering<br />
community dependency<br />
Programme Target specific Needs specific<br />
selection<br />
Gender aspect Dominated by<br />
elites<br />
Gender sensitive<br />
effectively by themselves. A participatory approach ensures that activities are coordinated with others<br />
and that responsibilities are shared. An organising committee should bring the whole community together<br />
under a single umbrella and try to make everyone aware <strong>of</strong> available resources and <strong>of</strong> ways to protect the<br />
community; it can help to enhance confidence, skills, and the capacity to cooperate in order to undertake risk<br />
management as a communal effort.<br />
RM 7.2: Process <strong>of</strong> community participation in flash flood risk<br />
management<br />
Community involvement is essential at every step, including risk identification, prioritisation, plan formulation,<br />
implementation, monitoring, and evaluation (ADPC/ECHO/UNESCAP 2004). Community-based risk<br />
assessment can be carried out using various participatory rural appraisal (PRA) tools that encourage<br />
community members to partake in the identification <strong>of</strong> flood hazards and in the preparation <strong>of</strong> risk maps<br />
based on their knowledge and experience <strong>of</strong> the local environment, resources, and socioeconomic practices.<br />
Figure 10 shows the conceptual framework for community participation.<br />
Formation <strong>of</strong> a community flash flood risk management committee (CFFRMC) is the first step towards collecting<br />
information on the magnitude <strong>of</strong> a possible flash flood event. The CFFRMC investigates what institutions<br />
already exist and what their roles, responsibilities, and formation procedures are. It also disseminates<br />
information and provides an opportunity to involve all stakeholders including women and other marginalised<br />
groups.<br />
It is important that the CFFRMC have a legal status. When the CFFRMC is registered, it has the legal status<br />
accorded to it by the government. The CFFRMC must have a constitution with clear objectives. In addition, its<br />
structure and responsibilities, funding sources, and functioning mechanism must be clearly laid out.<br />
48
Day 2<br />
Figure 10: Framework for community participation<br />
Problems identification and prioritisation through<br />
community participation<br />
Session 7<br />
Seeking solutions and need assessment through<br />
community participation<br />
Formulation <strong>of</strong> participatory planning<br />
Incorporate lessons learnt<br />
Participatory implementation<br />
Participatory evaluation<br />
Participatory monitoring<br />
Source: Based on ADPC (2003)<br />
Steps in forming a CFFRMC<br />
• Arrange a community meeting<br />
• Discuss flash flood risk with the community and draw their attention to their need to manage it<br />
• Establish an ad hoc committee <strong>of</strong> five to seven members, remembering to include people from all sectors<br />
<strong>of</strong> the community, with due concern to gender<br />
The main objective <strong>of</strong> this committee is to draw up a draft constitution and to facilitate the formation <strong>of</strong> the<br />
CFFRMC. The ad hoc committee should call for meetings to discuss the draft constitution, which should be<br />
amended to reflect the suggestions made in the mass meeting.<br />
RM 7.3: Structure, responsibilities, and empowerment <strong>of</strong> the CFFRMC<br />
A CFFRMC is a legal organisation that represents the community; it typically has 9 to 11 members who<br />
are elected from amongst a general assembly according to the procedures set forth in the constitution. The<br />
committee should ensure proper representation from different sections <strong>of</strong> society, particularly remembering to<br />
include women and disadvantaged groups. If the committee is too large, it can be difficult to notify all the<br />
members, to make decisions, and to reach consensus; while if it is too small, it may not be representative.<br />
The CFFRMC should consist <strong>of</strong> different teams or sub-committees (Figure 11) each headed by a team leader<br />
and assigned particular responsibilities. The central committee should delegate responsibility for effective<br />
team work. The advisory committee is an essential part <strong>of</strong> the CFFRMC. The advisory committee consists<br />
<strong>of</strong> representatives from concerned district-level government organisations, concerned members <strong>of</strong> local<br />
administrative units, and other members that represent the interests <strong>of</strong> the various stakeholders. It is usually<br />
chaired by the head <strong>of</strong> the local government body.<br />
49
<strong>Flash</strong> <strong>Flood</strong> <strong>Risk</strong> <strong>Management</strong>: A <strong>Training</strong> <strong>of</strong> <strong>Trainers</strong> Manual<br />
Figure 11: Typical Structure <strong>of</strong> a CFFRMC<br />
Session 7<br />
Chairperson<br />
Community flash flood risk<br />
management committee (CFFRMC)<br />
Advisory<br />
committee<br />
Early warning<br />
and<br />
communication<br />
team<br />
First aid<br />
and health<br />
team<br />
Evacuation<br />
and rescue<br />
team<br />
Shelter<br />
management and<br />
logistics<br />
team<br />
Relief and<br />
rehabilitation<br />
team<br />
Source: Based on ADPC (2003)<br />
The CFFRMC is responsible for overall risk management; it oversees activities before, during, and after the<br />
flash flood event. The major roles and responsibilities <strong>of</strong> a CFFRMC are to:<br />
• organise and mobilise the community to prepare for a possible disaster so that the loss <strong>of</strong> life and property<br />
can be minimised;<br />
• raise awareness and advocacy at a multi-stakeholder level;<br />
• train volunteers and community members on what to do before, during, and after a flash flood event;<br />
• maintain an emergency stockpile and ensure that it is equitably distributed in the aftermath <strong>of</strong> a flash flood<br />
event;<br />
• manage and monitor the distribution <strong>of</strong> shelter and relief supplies among people who have been affected;<br />
• monitor the allocation <strong>of</strong> relief to affected people so that equitable distribution is ensured;<br />
• lobby local governments to design sustainable development plans for those that are most vulnerable;<br />
• coordinate with various relief aid agencies;<br />
• design evacuation and contingency plans;<br />
• motivate the community to avoid construction and settlements in flood prone areas;<br />
• develop a local flood warning system based on local knowledge;<br />
• extend support to link scientific and local knowledge for early warning and preparedness;<br />
• promote flood-friendly agricultural practices and explore other means <strong>of</strong> post-flash flood income generation.<br />
Depending on the needs and on the advice <strong>of</strong> the advisory committee, various sub-committees can be formed<br />
as per the constitution <strong>of</strong> the CFFRMC. Some suggestions for major responsibilities that can be held by subcommittees<br />
are as follows.<br />
• Early warning, communication, and information: This team develops early warning systems and<br />
disseminates information to the community and the concerned agencies. It develops systems for<br />
documenting the response by different teams and for assessing community needs.<br />
50
Day 2<br />
• First-aid and health: The responsibilities <strong>of</strong> this team include mobilising and organising camps to treat<br />
injured people and raising community awareness about health, hygiene, and education in times <strong>of</strong> flash<br />
floods.<br />
• Evacuation and rescue: This team evacuates affected people and, when possible, also removes domestic<br />
animals and other material goods along with the people.<br />
• Shelter management and logistics: This team finds shelter for victims. Before a flood, it must establish and<br />
maintain stockpiles <strong>of</strong> materials (with community accountability) and develop logistical systems to distribute<br />
relief.<br />
• Relief and rehabilitation: This team ensures the necessary stock <strong>of</strong> relief goods with proper security and<br />
monitoring.<br />
Session 7<br />
The CFFRMC is a voluntary organisation and thus depends on volunteers. Each team should enrol a certain<br />
number <strong>of</strong> volunteers and to the extent possible, the team composition should reflect the local geography,<br />
gender, and social demography.<br />
It is essential that the CFFRMC be empowered both institutionally and financially to be able to react to crises<br />
quickly and carry out its work effectively. The functional bodies must be able to react to a flood rapidly<br />
and make rational decisions. Committee members, team leaders, and volunteers need to have appropriate<br />
expertise and a clear understanding <strong>of</strong> their roles and responsibilities. They may also need training or skill<br />
development in various areas such as: early warning, preparedness and risk reduction, measurement <strong>of</strong><br />
precipitation, water-level gauge recording, early warning systems, participatory hazard and vulnerability<br />
mapping, preparedness planning, community-based first aid, community-based disaster management,<br />
building mitigation structures, watershed management, and agriculture management.<br />
It is important for the CFFRMC to be financially viable. The committee must establish close contact with external<br />
agencies, including government agencies, to obtain funds. Some possible fundraising mechanisms that have<br />
worked well in the past include organising social and religious events, selling natural resources that belong to<br />
the community (such as community forest resources and products), and levying local taxes. When funds are<br />
collected for community benefit it is important to maintain proper accounting <strong>of</strong> both income and expenditures.<br />
RM 7.4: Characteristics <strong>of</strong> good community governance<br />
Governance provides an enabling environment whereby communities can provide services for the common<br />
good. The key characteristics <strong>of</strong> good governance are: assessment <strong>of</strong> needs, prioritisation, and equitable<br />
allocation <strong>of</strong> resources. The governance process must encourage cyclical planning that allows for learning<br />
and improvement over time. Good community governance for flash flood risk management can be fostered by<br />
keeping in mind a few basic guidelines.<br />
• Participation: A participatory approach that includes the whole community is important. Everyone in the<br />
community can participate by voicing their opinion on the need for the mitigation measures and possible<br />
solutions.<br />
• Communication: The effectiveness <strong>of</strong> a CFFRMC can be gauged by the extent to which it has been<br />
successful in communicating to the community the potential problem <strong>of</strong> flash floods, its causes, and<br />
appropriate solutions to minimise losses. The peaceful resolution <strong>of</strong> stakeholder disputes and grievances in<br />
the committee are vital.<br />
• Efficiency: It is achieved by minimising financial, political, social, and environmental costs.<br />
• Equity and inclusiveness: It is necessary and important to promote the empowerment <strong>of</strong> women and<br />
marginalised groups, and to make sure that these groups have the opportunity to be involved.<br />
• Responsiveness: The committee must be responsible and accountable to the community and it must include<br />
all stakeholders.<br />
• Transparency: Transparency <strong>of</strong> procedures indicates good governance.<br />
Different grievances and community complaints can be resolved through institutional mechanisms such<br />
as public cells which redress grievances under the CFFRMC. Cells help to resolve disputes, for example<br />
51
<strong>Flash</strong> <strong>Flood</strong> <strong>Risk</strong> <strong>Management</strong>: A <strong>Training</strong> <strong>of</strong> <strong>Trainers</strong> Manual<br />
regarding the allocation <strong>of</strong> shelter or the distribution <strong>of</strong> relief items. The secretary <strong>of</strong> the CFFRMC is<br />
responsible for logging appeals and researching the validity <strong>of</strong> grievances.<br />
Session 7<br />
RM 7.5: Role <strong>of</strong> government in community flash flood risk management<br />
The government can be involved in different phases <strong>of</strong> community flash flood risk management; some<br />
examples are given below (Table 4).<br />
Government involvement in the CFFRMC is essential (although government is involved to a varying extent<br />
across the HKH region), as the government has superior financial resources, institutional mechanisms, and<br />
technical capacity. Government involvement can help to improve community preparedness and participation.<br />
It can also help to secure the legal status <strong>of</strong> the CFFRMC.<br />
Table 4: Possible areas <strong>of</strong> government involvement in CFFRM<br />
Pre-flash flood preparedness During flash flood After flash flood<br />
Facilitate a meeting involving the CFFRMC, local<br />
government, and local NGOs before the monsoon to<br />
review the preceding year’s successes and failures in<br />
flash flood management and to update the arrangements<br />
Provide funds for capacity building <strong>of</strong> the CFFRMC,<br />
awareness-raising campaigns, construction <strong>of</strong> mitigation<br />
structures, and construction <strong>of</strong> safe havens on uplands<br />
Facilitate the strengthening <strong>of</strong> the functioning <strong>of</strong> the<br />
control room<br />
Assist in collecting grain and fuel to use during a crisis<br />
Provide technical assistance during construction <strong>of</strong><br />
structures for mitigation and capacity building and<br />
awareness-raising campaigns<br />
Mobilise qualified search and<br />
rescue teams such as army or<br />
police according to the severity <strong>of</strong><br />
the disaster<br />
Allocate health personnel and<br />
medicine<br />
Assist in proving basic necessities<br />
such as safe drinking water, food,<br />
and shelter<br />
Allocate security services to save<br />
property spared by the flash flood<br />
Contribute to the<br />
distribution <strong>of</strong><br />
relief items<br />
Assist in<br />
rehabilitation<br />
processes<br />
Make<br />
arrangements for<br />
financial support<br />
to the community<br />
Source: Shrestha et al. (2008)<br />
52
Day 2<br />
Session 8 Gender Perspectives in<br />
Disaster <strong>Management</strong><br />
Time: 45 minutes<br />
Objective<br />
To understand how the gender dimension and gender issues play a role in disaster and flash flood risk<br />
management by<br />
XX<br />
Learning the concept <strong>of</strong> ‘gender’ and appreciating gender differences<br />
XX<br />
Understanding gender issues in flash flood risk management<br />
XX<br />
Learning how gender-sensitive flash flood risk management works<br />
Session 8<br />
Activities<br />
Activity 8.1: Concept <strong>of</strong> gender and gender differences<br />
Time: 10 minutes<br />
Step 1<br />
Step 2<br />
Engage the class in a short question and answer session in which the participants are asked to<br />
voice their understanding <strong>of</strong> ‘gender’. Give a short presentation explaining how ‘gender’ differs<br />
from ‘sex’ and clarify the differences.<br />
Discuss how society differentiates between activities that are perceived as ‘man’s work’ and<br />
‘woman’s work’.<br />
Activity 8.2: Gender and flash flood risk management<br />
Time: 15 minutes<br />
Step 1<br />
Discuss how issues <strong>of</strong> gender are <strong>of</strong> concern in flash flood risk management.<br />
Note to the<br />
trainer<br />
The class may not be aware that access to and control over<br />
various resources can be gender specific. Clarify that gender as<br />
well as economic status, age, and physical fitness can all affect<br />
flood risk.<br />
Step 2<br />
Discuss how women are generally more affected both during and after a flash flood.<br />
Activity 8.3: Gender-sensitive flash flood risk management<br />
Time: 20 minutes<br />
Step 1<br />
Step 2<br />
Step 3<br />
Discuss the need for gender-sensitive flash flood risk management.<br />
Discuss the most significant problems that women face during a disaster.<br />
Discuss possible gender-sensitive approaches to flash flood risk management.<br />
53
<strong>Flash</strong> <strong>Flood</strong> <strong>Risk</strong> <strong>Management</strong> – A <strong>Training</strong> <strong>of</strong> <strong>Trainers</strong> Manual<br />
Session 8 Resource Materials<br />
Session 8<br />
RM 8.1: Concept <strong>of</strong> gender and gender differences<br />
‘Sex’ refers to the biological differences between<br />
men and women. These immutable differences have<br />
been made a major point <strong>of</strong> social difference in many<br />
cultures. ‘Gender’, on the other hand, refers to social<br />
constructs and perceptions on the role <strong>of</strong> women and<br />
men in society (Table 5). Different societies, cultures, and<br />
religions have different perceptions and assign different<br />
responsibilities to men and women in areas such as<br />
work, dress, custom, tradition, and religious observance.<br />
Table 5: Differences between sex and gender<br />
Sex<br />
Biological<br />
Born with<br />
Universal<br />
Cannot be changed<br />
Gender<br />
Socially constructed<br />
Not born with<br />
Place and cultural specific<br />
Can be changed<br />
In many cultures and societies women have limited access to various resources and they can be socially,<br />
culturally, and economically marginalised. The social construct <strong>of</strong> predefined gender biases creates unequal<br />
access to resources and opportunities. This is particularly noticeable at the household level where it is not<br />
uncommon to find that women have disproportionately poorer health and nutritional outcomes, lower levels<br />
<strong>of</strong> literacy and education, lower paid income-generating work, and higher morbidity and mortality rates<br />
relative to men. For the most part, the culture and society <strong>of</strong> the HKH region generally relegates women’s role<br />
to reproduction and household work; women are generally less exposed to the outside world and may be<br />
unaware <strong>of</strong> events in their surroundings beyond the household, including any impending natural hazards.<br />
RM 8.2: Gender and flash flood risk management<br />
Gender issues are vital to disaster risk management. Gender-biased attitudes and stereotypes can also<br />
complicate and prolong women’s recovery from disasters. This is unfortunate, since studies have shown<br />
that women are more likely than men to share ideas and resources, since they are more organised at the<br />
grassroots level (Mehta 2007).<br />
Women, the poor, and other socioeconomically and physically disadvantaged people have less access to<br />
resources and as a consequence they may be severely affected by disasters. Those who are illiterate cannot<br />
read early warning preparedness announcements and instructions and may only marginally participate in<br />
disaster preparedness activities. During most disasters the percentage <strong>of</strong> deaths is higher among women and<br />
children, partly because women lack briefing on early preparedness measures. Women are also at greater<br />
risk because they are typically smaller and physically weaker and have less endurance than men, and when<br />
they are pregnant or lactating they are more vulnerable. Women have the primary responsibility for the care<br />
<strong>of</strong> infants, small children, the sick, and the elderly, and their clothing may restrict their mobility; both <strong>of</strong> these<br />
factors may slow them down at the very moment when time is crucial, further hindering women’s survival<br />
during disasters. Many women die in disasters when they try to save their children and their property.<br />
Gender issues are seldom just women’s issues; they concern the family, the community, and the society<br />
and have financial and economic dimensions. It is important to build women’s capacity not only to save<br />
themselves, their children, and their property, but also to be active partners in mitigating flash flood risks.<br />
RM 8.3: Gender-sensitive flash flood risk management<br />
Women are typically absent from the fora where decisions are made, so when priorities are established,<br />
the interests <strong>of</strong> women are <strong>of</strong>ten poorly represented. In general, women are the most likely to be affected by<br />
floods, but their concerns are least likely to be addressed.<br />
54
Day 2<br />
The CFFRMC also plays a role in training women to deal with disease control, malnutrition, food shortages,<br />
land treatment, and crop production. Adopting a gender perspective would advocate that the roles <strong>of</strong> men<br />
and women be examined separately and that strategies for protection and mitigation be targeted specifically<br />
at men and women based on their roles.<br />
For the most part, women in the HKH region have lower literacy and educational levels than men; this<br />
has also contributed to their reduced access to post-disaster relief activities. Moreover, the lack <strong>of</strong> gender<br />
awareness in communications at the grassroots level means that women have had limited access to disasterrelated<br />
information. It is important to bring gender issues to the fore when addressing capacity building<br />
and empowerment initiatives. The knowledge and skills gained for general preparedness are also useful in<br />
emergencies.<br />
Women face specific problems during disasters. One recurring problem is the lack <strong>of</strong> privacy; in situations <strong>of</strong><br />
prolonged water logging, the simple activity <strong>of</strong> bathing and tending to personal hygiene in relative privacy<br />
is more problematic for women than it is for men. Women are also more restricted in their mobility than men,<br />
as they are usually the ones responsible for the care <strong>of</strong> young children and the elderly. Women and girls <strong>of</strong><br />
all ages are commonly harassed during disasters. Not only are the womenfolk commonly forgotten when<br />
information is disseminated, but they have the added burden <strong>of</strong> also being the ones tasked with collecting<br />
relief materials.<br />
Session 8<br />
Women, the poor, and the more underprivileged segments <strong>of</strong> society have specific issues when it comes to<br />
combating disaster, but they can also bring a unique perspective which can be invaluable in saving lives<br />
and property, especially at the family level. For this reason it is necessary to keep the following points in<br />
mind when conducting gender-based risk management, as women can introduce innovative mechanisms and<br />
techniques.<br />
• Remember to differentiate between different target groups and specific objectives and approaches for all<br />
intervention activities.<br />
• Involve women in pre- and post-disaster management.<br />
• When planning activities remember that women have particular needs with respect to security, hygiene,<br />
and related issues.<br />
• Ensure girls’ education after disaster.<br />
• Protect the specific health needs <strong>of</strong> women.<br />
• Help women become self-sufficient in terms <strong>of</strong> minimum income and financial security.<br />
• Ensure equitable aid distribution.<br />
• See that women can partake in the decision-making process by providing the capacity building and<br />
advocacy training that they need to be able to participate fully.<br />
55
<strong>Flash</strong> <strong>Flood</strong> <strong>Risk</strong> <strong>Management</strong> – A <strong>Training</strong> <strong>of</strong> <strong>Trainers</strong> Manual<br />
Session 9 Social Hazard Mapping and<br />
<strong>Risk</strong> Assessment<br />
Time: 1 hour<br />
Objective<br />
To appreciate the importance <strong>of</strong> social hazard mapping and to learn how to implement it by:<br />
XX<br />
Understanding the concept <strong>of</strong> social hazard mapping<br />
XX<br />
Learning how to conduct social hazard mapping with a local community<br />
XX<br />
Learning about participatory GIS mapping (PGIS)<br />
Activities<br />
Activity 9.1: Concept and importance <strong>of</strong> social hazard mapping<br />
Time: 10 minutes<br />
Session 9<br />
Step 1<br />
Step 2<br />
Introduce the concept <strong>of</strong> social hazard mapping and explain who prepares the maps and how.<br />
Discuss the processes <strong>of</strong> identifying potential stakeholders who will be involved in the social hazard<br />
mapping process. Highlight the fact that while it is important to involve social elites, key informants,<br />
and local leaders, it is equally important to involve community members from different castes and<br />
ethnic backgrounds and from all socio-cultural and economic groups, since each will be able to<br />
contribute a different type <strong>of</strong> knowledge and experience. Remember to emphasise gender issues<br />
and to stress the participation <strong>of</strong> women.<br />
Step 3<br />
Discuss how social hazard mapping can be disseminated to and used by communities and local<br />
authorities.<br />
Activity 9.2: Process <strong>of</strong> social hazard mapping<br />
Time: 35 minutes<br />
Step 1<br />
Introduce how social hazard mapping can be conducted in a community setting with local people<br />
who may be unfamiliar with maps in general (RM 9.2). Give practical advice. Make participants<br />
aware <strong>of</strong> possible pitfalls, and also include checklists that should be helpful in conducting on-site<br />
social hazard mapping.<br />
Step 2 Review the steps <strong>of</strong> social hazard mapping (detailed in RM 9.2):<br />
• Introductions and establishing rapport<br />
• Discussion <strong>of</strong> the map<br />
• Familiarising participants with map signs and symbols<br />
• Question and answer session<br />
• Marking the map<br />
• Preparing the legend<br />
• Emphasising community awareness<br />
56
Day 2<br />
Note to the<br />
trainer<br />
Clarify that one <strong>of</strong> the responsibilities <strong>of</strong> the CFFRMC is to<br />
collect the information that is needed to prepare a hazard map<br />
and to prepare the actual map. Alternatively, the CFFRMC<br />
can choose to assign the task <strong>of</strong> preparing the hazard map to<br />
another organisation. Regardless <strong>of</strong> who prepares the hazard<br />
map, the steps needed for the preparatory groundwork are the<br />
same. Some or all <strong>of</strong> the following tools and techniques can be<br />
used to collect all <strong>of</strong> the relevant information for the preparatory<br />
groundwork: participatory rural appraisal (PRA) methods such<br />
as observation, focus group discussions, in-depth interviews, key<br />
informant surveys, checklists, and review <strong>of</strong> previous documents<br />
and papers to collect information previously recorded about the<br />
community. (If the CFFRMC is not preparing the hazard map,<br />
then the group doing so should consult the CFFRMC for any<br />
additional information it can provide.)<br />
Activity 9.3: Process <strong>of</strong> participatory GIS mapping (PGIS) <strong>of</strong> hazards<br />
Time: 15 minutes<br />
Step 1<br />
Explain what participatory GIS-based community hazard mapping is. Mention how GIS and<br />
remote sensing databases can be linked with the community-based exercise <strong>of</strong> hazard mapping.<br />
Social hazard mapping, in its most elementary form (as for example in Activity 9.2), uses only<br />
community-based knowledge and information. A greater degree <strong>of</strong> accuracy and sophistication can<br />
be achieved by using the PGIS method, which integrates community knowledge with spatial data.<br />
Session 9<br />
Step 2<br />
Step 3<br />
Review the methodology <strong>of</strong> PGIS. Clarify that PGIS involves two steps. The first step is to collect<br />
information from the community as already outlined in Activity 9.2. The second step is to integrate<br />
the information collected by the community with the spatial data layers to prepare the social hazard<br />
map.<br />
The information which is collected from the community can be analysed and integrated with the<br />
GIS/remote sensing based data directly in the field or it can be processed in the <strong>of</strong>fice. In either<br />
case, the end result is the flash flood hazard map.<br />
57
<strong>Flash</strong> <strong>Flood</strong> <strong>Risk</strong> <strong>Management</strong> – A <strong>Training</strong> <strong>of</strong> <strong>Trainers</strong> Manual<br />
Session 9 Resource Materials<br />
Session 9<br />
RM 9.1: Concept and importance <strong>of</strong> social hazard mapping<br />
A social hazard map is a map <strong>of</strong> the local flash flood hazards; it is prepared based on local knowledge<br />
and other available information. It can be prepared either by the CFFRMC or any other organisation in<br />
consultation with CFFRMC and the local communities (Boxes 3 and 4). It consists <strong>of</strong> information on the<br />
range <strong>of</strong> possible damage and disaster prevention activities. The activity <strong>of</strong> social hazard mapping helps<br />
the community become aware <strong>of</strong> the extent <strong>of</strong> the<br />
damage that possible flash floods can inflict, the<br />
possible hazard scenario, possible evacuation routes,<br />
sites, and so on; in general, it encourages discussion<br />
in the community for heightened awareness and better<br />
flash flood risk management (Box 5).<br />
RM 9.2: Process <strong>of</strong> social hazard<br />
mapping<br />
Social flood hazard maps reflect the location and<br />
the condition <strong>of</strong> a given area. A flood hazard map<br />
uses symbols to indicate the location <strong>of</strong> houses,<br />
assets, services delivery organisations, infrastructure<br />
(roads, schools, hospitals, and bazaars), and other<br />
community landmarks. It is a tool that the CFFRMC<br />
uses to encourage the participatory process <strong>of</strong><br />
collecting baseline data and information; the data<br />
that are collected are plotted on a map to help the<br />
planning team analyse the strengths (resources/<br />
opportunities available) and risks (exposures and<br />
vulnerabilities) in the area in question (cluster, district,<br />
ward). It also helps in the identification <strong>of</strong> vulnerable<br />
Box 3: Social hazard mapping – key<br />
considerations<br />
Social hazard mapping is carried out by the community<br />
itself. It is usually coordinated by the CFFRMC and done<br />
in consultation with community members and a variety<br />
<strong>of</strong> stakeholders. It is also possible for outsiders to the<br />
community to prepare social hazard maps, but they<br />
should be aware <strong>of</strong> a number <strong>of</strong> potential pitfalls, such<br />
as the difficulty <strong>of</strong> identifying the correct people to liaise<br />
with, language challenges, and barriers in access to<br />
the community and in selecting participants. Sometimes<br />
outsiders do not know the local language and cannot<br />
communicate with the local facilitator. It is important<br />
to have a good facilitator who is also a key informant<br />
and who is capable <strong>of</strong> establishing a rapport with the<br />
community before conducting the exercise.<br />
It is important to keep the channels <strong>of</strong> communications<br />
open with the local authorities; to report to them on the<br />
activities being conducted; and to obtain permission, if<br />
needed, before beginning.<br />
Box 4: Planning ahead for field work<br />
Social hazard mapping is a group activity. A little planning<br />
ahead can help to make the exercise a good success. When<br />
working in the field make sure that the following drawing<br />
materials are available: drawing pens <strong>of</strong> different colour,<br />
markers, pencils, erasers, A1 size plain paper, scales,<br />
measuring tape, etc. In addition to the drawing materials<br />
make sure that maps <strong>of</strong> the area are also available; these<br />
can be, for example, topographic maps, aerial photographs<br />
or high resolution satellite images (e.g., QuickBbird,<br />
IKONOS). Note that it is best when the maps are printed on<br />
A1 or A0 size paper.<br />
Box 5: Uses <strong>of</strong> flood hazard maps<br />
By local people<br />
• To consider proper land use planning<br />
• To learn about flood history<br />
• To organise for preparedness and evacuation<br />
• To help prepare emergency evacuation plans<br />
• To help identify communication channels<br />
• To identify safe routes and places<br />
By CFFRMC/local administrative authority<br />
• To review land use planning/ urban planning<br />
• To update disaster preparedness activities<br />
• To review evacuation routes and sites<br />
• To update specific assistance plans<br />
• To promote education and awareness activities<br />
• To update information<br />
• To disseminate updated information<br />
58
Day 2<br />
groups such as people with disabilities or those<br />
with special needs, who will need special<br />
consideration during emergency rescue and<br />
relief operations. Since the map includes all<br />
possible local resources, it can be <strong>of</strong> great<br />
help when rescue workers and others are<br />
searching for assistance in locating measures<br />
that can lessen the magnitude <strong>of</strong> loss, the<br />
safest path for evacuation, and safe places for<br />
temporary settlements.<br />
Steps in social hazard mapping<br />
Step 1: When conducting social hazard<br />
mapping in a community setting, remember<br />
to first greet the participants and put them at<br />
ease by clarifying the objectives <strong>of</strong> the work.<br />
Introduce each <strong>of</strong> your team members and ask<br />
the local participants to introduce themselves.<br />
Try to establish a good rapport between the<br />
outsider group and its mediator and the local<br />
facilitator and community members.<br />
Step 2: The second step is the discussion <strong>of</strong><br />
the map. Before the session begins, hang the<br />
map on a wall or position it appropriately so<br />
that it will be visible to all the participants.<br />
Regardless <strong>of</strong> the type <strong>of</strong> map, whether it is a<br />
topographic map, an aerial photo, or a remote<br />
sensing satellite image, introduce it to the local<br />
participants by pointing out some familiar<br />
Box 6: Scale <strong>of</strong> the map<br />
The scale <strong>of</strong> the map should be on the order <strong>of</strong><br />
1:10,000 to 1:15,000 to allow for easy identification<br />
<strong>of</strong> individual houses and evacuation routes, and for the<br />
participants to easily gauge the extent <strong>of</strong> a possible<br />
inundation. Explain that on a 1:10,000 scale map,<br />
1 cm on the map corresponds to 100 m on the ground.<br />
It is essential to get across the concept <strong>of</strong> scale since this<br />
is fundamental to preparing and reading maps. Once<br />
the participants have a good handle on the concept <strong>of</strong><br />
scale they will then easily be able to locate landmarks<br />
and be able to sketch information such as how far their<br />
houses and property are from the expected hazard<br />
area.<br />
Box 7: Using colour and symbols<br />
Discuss how different hazard zones can be indicated<br />
by marking them in different colours. Go over the colour<br />
conventions and the standard symbols used in mapping.<br />
By convention, red is usually used to mark the most<br />
high risk and critical areas. Agricultural land is typically<br />
depicted in yellow, forests in green, rivers and lakes in<br />
blue, and barren land in gray. Areas <strong>of</strong> risk can all be<br />
depicted in the same colour but with different intensity<br />
depending on the level <strong>of</strong> risk.<br />
landmarks. Explain how the map was produced and go into some detail about the orientation, the direction,<br />
and the scale (see Box 6). Point out reference points that will be familiar to them such as the settlement,<br />
agricultural land, the roads, the river, and other well-known community infrastructure. Clarify how to read the<br />
map and remember to explain the scale <strong>of</strong> the map in relation to the ground scale.<br />
Session 9<br />
Step 3: Remind the participants <strong>of</strong> the need to familiarise local people with the different symbols, colours,<br />
icons, and other conventional signs used on maps to depict landmarks such as rivers, roads, settlements,<br />
schools, hospitals, irrigation canals, agricultural land, forest, and so on (see Box 7). It is important to do this<br />
before proceeding with the preparation <strong>of</strong> the social hazard map.<br />
Step 4: Engage the local participants in a short question and answer session on what they think is the most<br />
essential information to include on a social hazard map and why.<br />
Step 5: Ask the participants to identify and mark features such as the boundaries <strong>of</strong> the community,<br />
neighbouring settlements, various flood risk zones, highland and lowland areas, safe areas, and other points<br />
<strong>of</strong> reference (Box 8). When starting with a base map, verify and update features that are already identifiable<br />
on the map. When a new map needs to be created, proceed as follows.<br />
• Draw the main objects such as the river and its tributaries, any canals and lakes, and the location <strong>of</strong> rain<br />
gauges.<br />
• Draw settlements, houses, and infrastructure (e.g., roads).<br />
• Indicate the different uses <strong>of</strong> land such as forests, pasture areas, open areas, and landslide areas.<br />
• Indicate the location <strong>of</strong> communication infrastructure, telecom towers, electricity towers, transmission lines,<br />
and so on.<br />
59
<strong>Flash</strong> <strong>Flood</strong> <strong>Risk</strong> <strong>Management</strong> – A <strong>Training</strong> <strong>of</strong> <strong>Trainers</strong> Manual<br />
• Mark the location <strong>of</strong> areas that are routinely flood<br />
prone, areas that have experienced inundation<br />
at some time in the past, and area that are<br />
considered to be safe.<br />
• Mark areas that are particularly flood prone.<br />
• Mark the maximum height <strong>of</strong> past flood levels.<br />
• Identify and map high, medium, and low risk flood<br />
zones by marking them with different colours.<br />
• Identify the location <strong>of</strong> vulnerable communities,<br />
areas, and people.<br />
• Mark internal and external safe areas.<br />
• Map safe evacuation routes.<br />
• Mark the location <strong>of</strong> safe evacuation sites, the<br />
control room, public security points, health care<br />
centres, and so on.<br />
Box 8: Information to include on the hazard<br />
map<br />
• Inundated area, depth<br />
• <strong>Flood</strong> concentration period<br />
• Area to be evacuated<br />
• Location <strong>of</strong> evacuation sites and routes<br />
• Control room<br />
• Dangerous spots<br />
• Past flood record<br />
• Predicted extent <strong>of</strong> flood and damage<br />
• Location <strong>of</strong> houses, settlement and infrastructure<br />
• Public safety and security: police, hospital<br />
• Explanation and direction use in the map<br />
Step 6: Ask the participants to prepare a legend<br />
detailing all <strong>of</strong> the features that they have indicated.<br />
The legend should be clear and easily understandable by local people.<br />
Session 9<br />
Step 7: After collectively preparing the hazard map, it is important to reiterate that everyone in the community<br />
should be made aware <strong>of</strong> it so that they all can be prepared for the eventuality <strong>of</strong> a possible flash flood and<br />
be aware <strong>of</strong> contingency plans.<br />
Some tips for preparing a social flood hazard map<br />
• As in standard mapping practice, the top <strong>of</strong> the piece <strong>of</strong> paper on which the map is drawn indicates<br />
north. The boundaries <strong>of</strong> wards and villages are marked. It is advisable to provide a legend and a scale<br />
for the map.<br />
• Record the location <strong>of</strong> every cluster <strong>of</strong> households, <strong>of</strong> the markets, and <strong>of</strong> the public buildings.<br />
• Record the location <strong>of</strong> structures such as canals, weirs, roads, airports, bridges, the path <strong>of</strong> the river,<br />
highlands, and lowlands. The location <strong>of</strong> vulnerable areas should noted and indicated on the map using<br />
special symbols.<br />
• Record the location <strong>of</strong> evacuation routes, safe havens, and the locations that can be used as staging<br />
areas for emergency volunteers. Record the location <strong>of</strong> infrastructure and indicate whether it is available<br />
for use in emergence situations. Record the location <strong>of</strong> vulnerable areas, safe structural constructions,<br />
hazard prone houses and infrastructure, and the locations <strong>of</strong> the most vulnerable people.<br />
• Public safety and security: indicate the location <strong>of</strong> civil defence installations, communications centres,<br />
emergency management centres, fire stations, hospitals and other medical facilities, mass emergency<br />
shelters, police stations and other installations that are available for public security, for stockpiling, and for<br />
the use <strong>of</strong> community emergency organisations.<br />
• Utilities: Clearly mark communication lines and antenna complexes.<br />
• Agriculture: indicate the location <strong>of</strong> food storage and processing facilities, irrigation systems,<br />
impoundments and reservoirs, levees, and dikes.<br />
A comprehensive risk analysis for flash floods needs to be conducted in advance in order to be able to plan<br />
for all eventualities. The analysis begins by estimating the possible intensity and magnitude <strong>of</strong> the event and<br />
gauging the extent <strong>of</strong> the impact that it can have on vulnerable human lives and livestock; the analysis then<br />
proceeds by seeing what plans can be made for emergency shelter sites, evacuation routes, and emergency<br />
water sources. The risk analysis also involves making plans to train volunteers and response personnel and to<br />
disseminate information to locals about what to do in case <strong>of</strong> an emergency. Rapid onset disasters such as<br />
flash floods do not allow enough time to collect secondary information. It is very important that the CFFRMC<br />
collect such information well in advance <strong>of</strong> the onset <strong>of</strong> the flash flood.<br />
60
Day 2<br />
RM 9.3: Process <strong>of</strong> participatory GIS mapping (PGIS) <strong>of</strong> hazards<br />
The community mapping exercise strongly links to participatory mapping and participatory GIS (PGIS)<br />
mapping (Figure 12). Participatory rural appraisal (PRA) is an important method <strong>of</strong> acquiring information<br />
on a local system within a short period <strong>of</strong> time. PRA is used to explore local or indigenous knowledge held<br />
communities by adopting informal interactions with them in their own setting. PGIS is an advanced method <strong>of</strong><br />
preparing community based hazard maps by integrating both community-based knowledge and information<br />
with digitised spatial databases <strong>of</strong> the area in order to produce the most informative maps possible.<br />
As defined by the Mapping for Change International Conference on Participatory Spatial Information<br />
<strong>Management</strong> and Communication, held in Nairobi, Kenya, in September 2005 (see http://pgis2005.cta.int),<br />
PGIS combines a whole range <strong>of</strong> geo-spatial information management tools and methods including: sketch<br />
maps, participatory three-dimensional models (P3DM), aerial photographs, satellite images, global positioning<br />
systems (GPS) data, and geographic information systems (GIS) data. These various tools are then used to bring<br />
together the spatial knowledge that local people have and to display it in the form <strong>of</strong> virtual or physical, two- or<br />
three-dimensional maps that are then used as interactive vehicles for spatial learning, as the basis for<br />
discussions, information exchange, analysis, decision making, and advocacy.<br />
PGIS practice is geared towards community empowerment through the measured, demand-driven, userfriendly,<br />
and integrated application <strong>of</strong> geo-spatial technologies. GIS-based maps and spatial analysis<br />
becomes a major conduit in the process. A good practice is to embed PGIS into the decision-making<br />
processes; since PGIS is flexible it adapts to different socio-cultural and bio-physical environments, it makes<br />
use <strong>of</strong> multidisciplinary facilitation and skills, and it builds mainly on visual language. The practice integrates<br />
several tools and methods and at the core uses a combination <strong>of</strong> both ‘expert’ skills and socially differentiated<br />
local knowledge. It promotes interactive participation <strong>of</strong> stakeholders in generating and managing spatial<br />
Session 9<br />
Figure 12: Participatory Community Hazard Mapping process<br />
Data acquisition<br />
(GIS and RS)<br />
Processing RS data<br />
Preparation <strong>of</strong><br />
community exercise<br />
Identification <strong>of</strong><br />
specific feature by<br />
community<br />
Post processing and<br />
spatial analysis<br />
Output designing<br />
and production<br />
61
<strong>Flash</strong> <strong>Flood</strong> <strong>Risk</strong> <strong>Management</strong> – A <strong>Training</strong> <strong>of</strong> <strong>Trainers</strong> Manual<br />
information and it uses information about specific landscapes to facilitate broadly-based decision-making<br />
processes that support effective communication and community advocacy (Rambaldi et al. 2006).<br />
The participatory mapping method consists <strong>of</strong> two major steps: first, topographic maps, aerial photographs<br />
and satellite images are acquired and presented to the community as a ‘blank’ map to facilitate discussion<br />
and the identification <strong>of</strong> specific features. Second, the data derived through PRA methods are integrated<br />
using GIS and enhanced through additional spatial analysis. Participatory GIS is an emergent practice which<br />
is the result <strong>of</strong> a spontaneous merger <strong>of</strong> participatory learning and action (PLA) methods with geographic<br />
information technologies.<br />
GIS has been widely used for the assessment <strong>of</strong> risk and the management <strong>of</strong> natural hazards by integrating<br />
it to manipulate information from different sources. It can be used to delineate the different flood risk zones in<br />
such a way that the information acquired can be communicated better and therefore more readily understood<br />
for decision making.<br />
Session 9<br />
62
Day 3<br />
Session/Activity<br />
Activity time<br />
(minutes)<br />
Cumulative time<br />
<strong>of</strong> session<br />
Session 10: Non-Structural Measures for <strong>Flash</strong> <strong>Flood</strong> <strong>Risk</strong> <strong>Management</strong><br />
10.1<br />
Measures for flash flood risk management and the importance<br />
<strong>of</strong> non-structural measures<br />
15 15<br />
10.2 Strategies for flash flood risk acceptance 10 25<br />
10.3 Strategies for flash flood risk reduction 35 60<br />
Session 11: Modelling Tools for <strong>Flash</strong> <strong>Flood</strong> <strong>Management</strong><br />
11.1 Modelling flash flood scenarios 20 20<br />
11.2 Hazard-specific modelling tools 40 60<br />
Session 12: Integrated <strong>Flash</strong> <strong>Flood</strong> and Watershed <strong>Management</strong><br />
12.1 Integrated flash flood management (IFFM) 45 45<br />
12.2 Concept and components <strong>of</strong> watershed management 15 60<br />
12.3 Watershed management measures 30 90<br />
Session 13: Hazard-Specific <strong>Flash</strong> <strong>Flood</strong> <strong>Management</strong>: Intense Rainfall <strong>Flood</strong>s<br />
13.1 Rainfall measurement and catchment rainfall 10 10<br />
13.2 Run<strong>of</strong>f and factors that affect it 10 20<br />
15.3 Discharge and methods <strong>of</strong> measuring it 10 30<br />
15.4<br />
<strong>Flood</strong> routing and calculating hydrographs at different<br />
locations<br />
15 45<br />
15.5 <strong>Flood</strong> frequency and return period 15 60<br />
Session 14: Hazard-Specific <strong>Flash</strong> <strong>Flood</strong> <strong>Management</strong>: Landslide Dam Outburst <strong>Flood</strong>s<br />
14.1 Types <strong>of</strong> landslides and factors that trigger landslides 15 15<br />
14.2<br />
Process <strong>of</strong> landslide damming and factors that can cause<br />
landslide dams<br />
15 30<br />
14.3 Case studies <strong>of</strong> landslide dam outburst floods 05 35<br />
14.4<br />
Measures that can reduce the risk <strong>of</strong> landslide dam outburst<br />
floods<br />
25 60
<strong>Flash</strong> <strong>Flood</strong> <strong>Risk</strong> <strong>Management</strong> – A <strong>Training</strong> <strong>of</strong> <strong>Trainers</strong> Manual<br />
Session 10 Non-Structural Measures for<br />
<strong>Flash</strong> <strong>Flood</strong> <strong>Risk</strong> <strong>Management</strong><br />
Time: 60 minutes<br />
Objectives<br />
To introduce the various non-structural measures available for flash flood risk management, including:<br />
XX<br />
Types <strong>of</strong> flash flood risk management<br />
XX<br />
The importance <strong>of</strong> non-structural measures<br />
XX<br />
<strong>Risk</strong> acceptance methods<br />
XX<br />
<strong>Risk</strong> reduction methods<br />
Activities<br />
Activity 10.1: Measures for flash flood risk management and the<br />
importance <strong>of</strong> non-structural measures<br />
Time: 15 minutes<br />
Step 1<br />
Step 2<br />
Highlight the different flash flood risk management measures that can be used. Give a PowerPoint<br />
presentation explaining the different structural and non-structural measures that are available.<br />
Explain that a community can use both small-scale structural measures and non-structural measures.<br />
Emphasise that a combination <strong>of</strong> the two is the best way <strong>of</strong> achieving a good result.<br />
Explain that there are three phases to disaster risk management: pre-flood, during the flood, and<br />
post-flood.<br />
session 10<br />
Step 3<br />
Explain that while a combination <strong>of</strong> structural and non-structural measures is best, a community with<br />
limited resources can achieve the greatest margin <strong>of</strong> safety by concentrating efforts on non-structural<br />
measures.<br />
Activity 10.2: Strategies for flash flood risk acceptance<br />
Time: 10 minutes<br />
Step 1<br />
Step 2<br />
Clarify what ‘risk acceptance’ means.<br />
Introduce the three key risk acceptance strategies. Discuss how risk acceptance strategies are<br />
implemented in different areas and mention in each case who responds and how they respond<br />
during emergencies.<br />
Note to the<br />
trainer<br />
Mention that emergency planning is based on government policy<br />
and on the existing institutional arrangements for flash flood<br />
and disaster risk management. Emergency planning usually has<br />
national, sub-national, and local level components complete with<br />
operational plans that assign roles and responsibilities.<br />
64
Day 3<br />
Activity 10.3: Strategies for flash flood risk reduction<br />
Time: 35 minutes<br />
Step 1<br />
Step 2<br />
Step 3<br />
Step 4<br />
Differentiate between the two types <strong>of</strong> strategies that can be used to reduce the risks associated<br />
with a flash flood: strategies aimed at prevention and strategies aimed at mitigation.<br />
Present the various preventive strategies for flash flood management.<br />
Clarify the concept <strong>of</strong> watershed. Discuss the social and natural components <strong>of</strong> watersheds;<br />
note that a watershed can consist <strong>of</strong> agricultural lands, forests, rangelands, barren lands, and/<br />
or floodplains. Draw attention to the fact that better agricultural practices, some rearranging <strong>of</strong> the<br />
agricultural calendar, reforestation, and regulation <strong>of</strong> grazing are some <strong>of</strong> the measures that can be<br />
used to prevent flash floods. The watershed approach will be discussed in Session 12.<br />
Open up a short question and answer session on possible mitigation strategies. Sum up the<br />
participants’ feedback and present the entire range <strong>of</strong> possible mitigation strategies.<br />
Note to the<br />
trainer<br />
When you discuss mitigation strategies, encourage the<br />
participants to share their knowledge and experience in<br />
reducing the intensity, frequency, and impact <strong>of</strong> flash floods<br />
in their regions. Present the strategies <strong>of</strong> discharge reduction,<br />
monitoring, warning, forecasting, and response system.<br />
It is important to mention that warnings, forecasts, and the<br />
methods used to communicate them to local communities should<br />
be easy to understand. Warnings should be issued in the local<br />
languages and dialects <strong>of</strong> the major linguistic groups who live in<br />
the flood affected area.<br />
Step 5<br />
Step 6<br />
Discuss the need for hydrometeorological monitoring, analysis, and forecasting. Explain how a<br />
forecasting system works.<br />
Discuss how warnings are disseminated. Discuss efficient ways <strong>of</strong> disseminating information (see<br />
Box 9 in RM 10.3).<br />
session 10<br />
Step 7<br />
Step 8<br />
Discuss how flash flood affected communities and individuals can access financial support. Some<br />
financial instruments available to cash-strapped flood victims are tax waivers, low interest loans (or<br />
waiver <strong>of</strong> loan interest), and compensation for maintaining structural interventions. Financial support<br />
can also be available sector-wise, such as from forest users’ or farmers’ groups.<br />
Discuss how different groups respond to flash floods. Finally, discuss some <strong>of</strong> the challenges to flash<br />
flood risk management (see Box 10 in RM 10.3).<br />
65
<strong>Flash</strong> <strong>Flood</strong> <strong>Risk</strong> <strong>Management</strong> – A <strong>Training</strong> <strong>of</strong> <strong>Trainers</strong> Manual<br />
Session 10 Resource Materials<br />
RM 10.1: Measures for flash flood risk management and the importance<br />
<strong>of</strong> non-structural measures<br />
<strong>Flash</strong> flood risk management includes both structural and non-structural measures. Structural measures tend<br />
to deal with the hydraulic and hydrological implications <strong>of</strong> flooding. Structural measures can include, river<br />
training, building embankments, constructing reservoirs and dams and other works aimed at controlling the<br />
flow <strong>of</strong> water to reduce the flood hazard. Non-structural measures work by using a different set <strong>of</strong> strategies,<br />
such as risk tolerance, risk prevention, and risk mitigation. The range <strong>of</strong> possibilities for these encompasses<br />
a wide diversity <strong>of</strong> measures such as: land use planning, devising and enforcing construction and structure<br />
management codes, soil management, land acquisition policies, insurance, sensitising the population through<br />
perception and awareness campaigns, disseminating information, as well as putting in place systems for<br />
emergency and post-disaster preparedness. A combination <strong>of</strong> structural and non-structural measures yields the<br />
best results. Strategies for flash flood risk management are given in Table 6.<br />
Non-structural measures<br />
Non-structural measures are very important when dealing with settled areas. Compared to structural<br />
measures, non-structural measures tend to be more sustainable because they include the active involvement<br />
<strong>of</strong> the community. National and regional policies tend to favour non-structural alternatives since these are<br />
low cost and have fewer environmental side effects; expensive structural measures with potentially serious<br />
environmental repercussions are considered as only a last resort.<br />
There are two categories <strong>of</strong> non-structural measures: risk acceptance and risk reduction measures.<br />
session 10<br />
Table 6: Structural and non-structural measures for flash flood risk management<br />
Structural measures<br />
Catchment-wide interventions (agriculture, forestry, and<br />
water control activities)<br />
River training interventions<br />
Other flood control interventions (passive control,<br />
water retention basins and river corridor enhancement,<br />
rehabilitation and restoration)<br />
Non-structural measures<br />
<strong>Risk</strong> Acceptance<br />
Tolerance<br />
Strategies<br />
Toleration<br />
Emergency response system<br />
Insurance<br />
<strong>Risk</strong> Reduction<br />
Watershed management<br />
Prevention<br />
Strategies<br />
Delimitation <strong>of</strong> flood areas and securing flood plains<br />
Implementation <strong>of</strong> flood areas regulation<br />
Application <strong>of</strong> financial measures<br />
Reduction <strong>of</strong> discharge through natural retention<br />
Mitigation<br />
Strategies<br />
Emergency action based on monitoring, warning, and<br />
response systems (MWRS)<br />
Public information and education<br />
Source: Colombo et al. (2002)<br />
66
Day 3<br />
RM 10.2: Various strategies for flash flood risk acceptance<br />
Acceptable risk, as defined in the United Nations International Strategy for Disaster Reduction, is the level <strong>of</strong><br />
loss that a society or community considers acceptable within the given existing social, economic, political,<br />
cultural, technical, and environmental conditions (UNISDR 2009). There are three main types <strong>of</strong> risk<br />
acceptance strategies: toleration, emergency response systems, and insurance.<br />
Toleration<br />
Toleration <strong>of</strong> risk implies that a competent authority (local, regional, or national) accepts that flash floods can<br />
occur. In this case, it is very likely that the competent authority will accept the results <strong>of</strong> the risk assessment and<br />
not promote any activities to reduce the risk.<br />
Emergency response systems<br />
All emergency plans (regional, district, local) should be based on a national emergency plan so that<br />
emergency operations within a particular country will be carried out according to the same doctrine <strong>of</strong> civil<br />
protection and in a concerted manner. In general, the various public authorities implicated in the emergency<br />
plan will play roles related to their day-to-day responsibilities. They must prepare themselves according to the<br />
mission statement established in the emergency plan. To this end, each competent authority (regional, district,<br />
local) should have its own emergency plan, accompanied by an operations manual.<br />
Insurance<br />
Insurance against flash flood damage should be an integral part <strong>of</strong> risk acceptance. However, many countries<br />
in the HKH region still do not have this practice because <strong>of</strong> the high costs involved. Insurance companies<br />
have various policies that cover risk. Insurance policies that apply only at the local level are far too expensive<br />
both for the insurance companies and for the private and public subscribers.<br />
RM 10.3: Various strategies for flash flood risk reduction<br />
<strong>Risk</strong> reduction is one <strong>of</strong> the main goals in flash flood management. It can be dealt with in two ways: through<br />
prevention strategies and through mitigation strategies.<br />
Prevention strategies<br />
Watershed management. (See also Session 12.) Watershed management has both structural and nonstructural<br />
components. Watershed management is cross-cutting and closely related both to the socio-economic<br />
status <strong>of</strong> the community and its development. Watershed management takes into consideration a number<br />
<strong>of</strong> basic principles related to run<strong>of</strong>f and erosion including soil, topography, land cover and use, farming<br />
practices, and floodplain zoning. This topic is covered in more detail later in the section on watershed<br />
management and the integrated flash flood management approach.<br />
session 10<br />
Financial measures. Financial support can be provided after a flash flood occurs in order to aid communities<br />
in dealing with the aftermath <strong>of</strong> the disaster. Usually this aid is administered through national or regional<br />
agencies. Financial measures can be<br />
• an economic contribution or the waiver <strong>of</strong> a financial burden such as: taxes, loan interest, or the<br />
liquidation <strong>of</strong> a loan;<br />
• financial support to individuals and local communities for planning, constructing, and maintaining structural<br />
interventions that can be shared among national, provincial, and local administrative levels, with the total<br />
amount divided among them (the share <strong>of</strong> the burden generally increasing progressively from local to<br />
provincial to national level);<br />
• support to maintain and regulate hydraulic works <strong>of</strong> public interest (where the support is given to those<br />
who maintain it);<br />
67
<strong>Flash</strong> <strong>Flood</strong> <strong>Risk</strong> <strong>Management</strong> – A <strong>Training</strong> <strong>of</strong> <strong>Trainers</strong> Manual<br />
• subsidies targeted at reducing flash flood risks for the protection <strong>of</strong> forests, pastures, rangelands, and<br />
water bodies, including subsidies to community forestry user groups or to targeted farmers to encourage<br />
environmentally friendly farming practices.<br />
Mitigation strategies<br />
Mitigation strategies can reduce the intensity, frequency, and impacts <strong>of</strong> flash floods. These strategies can<br />
include the following.<br />
Reducing discharge through natural retention. Various measures can be adopted to promote the natural<br />
retention <strong>of</strong> water.<br />
• Suitable areas for water retention need to be identified based on a land-use plan. If these areas fall<br />
within farmers’ private properties, the farmers must be compensated for the loss they incur due to reduced<br />
farming revenues;<br />
• Passive flood control measures (as advised by hydraulic engineering experts) can be incorporated into<br />
regional development programmes and construction plans so that retention basins can be identified and<br />
used for flash flood mitigation;<br />
• Natural retention areas need to be identified and improved.<br />
Monitoring, warning, and response systems (MWRSs). MWRSs can contribute to the mitigation <strong>of</strong> flash<br />
floods and can be a very effective non-structural measures (IDNDR 1997; UNISDR 2005). MWRSs include<br />
systems for data collection, monitoring, and transmission; forecasting; warning; dissemination; disaster<br />
management; and response. When any <strong>of</strong> these components fails to function, the effectiveness <strong>of</strong> the whole<br />
system can be hampered.<br />
session 10<br />
• Data collection, monitoring, and other associated systems. Collection and monitoring <strong>of</strong><br />
hydrometeorological data, such as rainfall, temperature, and stream flow, is essential since these data are<br />
used in simulations and forecasting that help planners prepare for future scenarios and choose between<br />
possible alternatives. Ground-based observation networks and satellite-based precipitation estimations are<br />
both good sources <strong>of</strong> data. Ground-based networks are a tried and true means <strong>of</strong> collecting rainfall and<br />
other meteorological data. Where ground-based observation networks are not available, satellite-based<br />
estimates <strong>of</strong> precipitation may be the only source <strong>of</strong> rainfall data. Combined satellite and ground-based<br />
rainfall estimates provide the best input for flash flood forecasting and early warning systems.<br />
It is important that data be transmitted efficiently from the site to the centre where the data are analysed.<br />
The centre can then issue forecasts and warning messages to end users in a timely manner. A wide range<br />
<strong>of</strong> data transmission systems are available; these can include, for example, automated gauge readers that<br />
use VHF radio or telegraph to transmit data digitally to the centre.<br />
• Forecasting systems. A forecasting system consists <strong>of</strong> models (e.g., hydrological, hydraulic) that<br />
can predict potential flash flood events; these models are used to closely follow the evolution <strong>of</strong> key<br />
parameters that could trigger a flood event. Forecasting can be very accurate, but if the computation time<br />
is too long they are not relvant. <strong>Flash</strong> floods, as their name implies, are rapid processes and typically the<br />
lead time is very short. Since time is <strong>of</strong> the essence, it is sometimes preferable to forego elaborate (and<br />
time consuming) forecasting models in favour <strong>of</strong> simpler models, such as flash flood guidance tables,<br />
which can give immediate results.<br />
• Warning systems. It is <strong>of</strong>ten difficult for the general public to grasp the meaning <strong>of</strong> quantitative flash flood<br />
forecasts; for general dissemination, qualitative warnings are much more useful (Box 9). An example <strong>of</strong><br />
such a qualitative warning is the flash flood guidance; this is the volume <strong>of</strong> rainfall during a given time<br />
(e.g., 1 to 6 hours) over a given small catchment area. Even the general public can easily interpret this<br />
number knowing that rainfall in excess <strong>of</strong> the flash flood guidance number is considered a flash flood<br />
threat.<br />
• Dissemination systems. <strong>Flood</strong> forecasting and warning information needs to be disseminated effectively. In<br />
the majority <strong>of</strong> cases, even good forecasts fail to prevent damage and loss <strong>of</strong> life because they are poorly<br />
68
disseminated. The South Asian tsunami<br />
<strong>of</strong> December 2004 is a classic example.<br />
The forecasts and warnings need to be<br />
communicated to the disaster management<br />
agencies in a timely and understandable<br />
manner. These agencies can then<br />
issue warnings to the different disaster<br />
management units down to the lowest level<br />
using the appropriate media (e.g., radio,<br />
television). The warning should be clear<br />
and concise so that they can easily be<br />
understood by communities. Those issuing<br />
the warnings should make sure to use<br />
language that will not cause unnecessary<br />
panic. The warnings can be issued in the<br />
form written text and can also contain useful<br />
diagrams and maps as needed.<br />
• Disaster management systems. Even<br />
Box 9: How effective is the warning system?<br />
The effectiveness <strong>of</strong> warnings hinges on many factors,<br />
including:<br />
• The quality <strong>of</strong> the data, how they are shared, and the<br />
methods used to communicate the information<br />
• The extent <strong>of</strong> political commitment: to what extent are<br />
warnings part <strong>of</strong> the overall government plan and how<br />
well are they coordinated?<br />
• The efficacy <strong>of</strong> the communication and dissemination<br />
system<br />
Warnings are much more effective if the population has<br />
been previously advised (through community awareness and<br />
education sessions) on how to interpret them and how to<br />
respond to them.<br />
when forecasts and warnings are issued<br />
in a timely manner, flash floods can still cause damage. A disaster management system should be well<br />
prepared for such events. The system should alert key action groups, which are part <strong>of</strong> the response<br />
system.<br />
• Response systems. A response system consists <strong>of</strong> intervention by groups such as:<br />
––<br />
police and fire brigade;<br />
––<br />
civil protection authorities (e.g., to disseminate targeted information);<br />
––<br />
volunteer groups (e.g., to assist the injured, to allocate resources);<br />
––<br />
military (e.g., to prepare sandbags, to construct temporary structures);<br />
––<br />
media (to disseminate information).<br />
Local communities should be sufficiently aware in advance <strong>of</strong> the hazards to which they are exposed so that<br />
they can understand the advisory warnings. The responsible authorities at different levels should prepare and<br />
issue the hazard warning. International bodies can provide the means for sharing and exchanging data and<br />
relevant knowledge to ensure the development and operational capabilities <strong>of</strong> national authorities.<br />
Challenges<br />
The main challenges for flash flood risk management are listed in Box 10.<br />
session 10<br />
Box 10: Challenges to flash flood risk management<br />
Poverty: Poverty challenges sustainable livelihoods and affects resource extraction patterns and environmental conservation.<br />
Climate change: The various impacts <strong>of</strong> climate change, such as increased frequency <strong>of</strong> GLOF events and changes in<br />
agricultural cropping patterns, are a challenge to the security and resilience <strong>of</strong> flood prone communities.<br />
Poor hydrometeorological data and information: Lack <strong>of</strong> reliable information hinders the ability to forecast extreme events,<br />
intensity, and magnitude <strong>of</strong> rainfall and run<strong>of</strong>f.<br />
Transboundary nature <strong>of</strong> rivers: Insufficient data sharing, differing institutional structures, lack <strong>of</strong> collaborative political will,<br />
and differing management priorities <strong>of</strong> countries sharing a river put people on both sides at risk.<br />
Differential access and control over resources: Some groups (e.g., women, children, the elderly, and the disabled) have<br />
unequal access to resources, information, and decision making; this makes them particularly vulnerable during disasters.<br />
Policy and institutional gap: Many levels <strong>of</strong> government lack policies for flash flood risk management, institutional<br />
mechanisms to deal with flood disasters, and/or coordination among stakeholders.<br />
69
<strong>Flash</strong> <strong>Flood</strong> <strong>Risk</strong> <strong>Management</strong> – A <strong>Training</strong> <strong>of</strong> <strong>Trainers</strong> Manual<br />
Session 11 Modelling Tools for<br />
<strong>Flash</strong> <strong>Flood</strong> <strong>Management</strong><br />
Time: 60 minutes<br />
Objectives<br />
To introduce modelling tools for flash flood management, including:<br />
XX<br />
Tools that can be used to understand different flash flood scenarios<br />
XX<br />
Hazard-specific modelling tools<br />
Activities<br />
Activity 11.1: Modelling flash flood scenarios<br />
Time: 20 minutes<br />
Engage the class in a short question and answer session to see how familiar they are with the various types <strong>of</strong><br />
s<strong>of</strong>tware and modelling tools that are available for flash flood modelling.<br />
Give a quick introduction to the two types <strong>of</strong> flash flood models, i.e., rainfall-run<strong>of</strong>f models and run<strong>of</strong>f routing<br />
(to the catchment) outlet models.<br />
Activity 11.2: Hazard-specific modelling tools<br />
Time: 40 minutes<br />
Step 1<br />
Step 2<br />
Step 3<br />
Discuss satellite rainfall estimation and how it is helpful in hydrological modelling.<br />
Discuss computer s<strong>of</strong>tware models that can be used to understand the various intense flash flood<br />
scenarios.<br />
Discuss the computer s<strong>of</strong>tware models used to simulate dam failures.<br />
session 11<br />
70
Day 3<br />
Session 11 Resource Materials<br />
RM 11.1: Modelling flash flood scenarios<br />
There are two basic components to modelling flash flood scenarios. The first component is to convert rainfall<br />
into run-<strong>of</strong>f and the second is to determine how that run-<strong>of</strong>f will route to the catchment outlet.<br />
Rainfall run<strong>of</strong>f model<br />
Rainfall run<strong>of</strong>f models simulate the behaviour <strong>of</strong> watersheds, channels, and other water-control structures.<br />
They can help to predict run<strong>of</strong>f volumes, peak flows, and the timing <strong>of</strong> flows by simulating the behaviour <strong>of</strong><br />
watersheds, channels, and reservoirs.<br />
<strong>Flood</strong> routing model<br />
<strong>Flood</strong> routing models compute the progressive time and shape <strong>of</strong> flood waves at successive points along a<br />
river. <strong>Flood</strong> routing is also called storage routing or stream-flow routing. <strong>Flood</strong> routing models are numerical<br />
methods used to estimate the movement <strong>of</strong> flood waves along a channel reach. They are based on knowing<br />
the discharge hydrograph at the upstream end and on knowing the hydraulic characteristics <strong>of</strong> the reach; they<br />
typically assume that there is no perturbation coming from the downstream.<br />
RM 11.2: Hazard specific modelling tools for flash flood management<br />
Satellite rainfall estimation<br />
Precipitation is a crucial part <strong>of</strong> the hydrological cycle. The spatial and temporal variations <strong>of</strong> precipitation<br />
are enormous. An accurate global coverage <strong>of</strong> rainfall records is necessary to improve weather and climate<br />
predictions. Rain gauge data are available only from stations that are on land (where they are located mainly<br />
in densely populated areas), and little <strong>of</strong>fshore information exists.<br />
Rainfall can be estimated remotely, either from ground-based weather radars or from space-based satellites.<br />
The use <strong>of</strong> satellite-based rainfall estimates in the HKH region will enable a more thorough, accurate, and<br />
timely analysis <strong>of</strong> weather and climate-related phenomenon by providing accurate rainfall estimates. The use<br />
<strong>of</strong> satellite data can help to improve the analysis <strong>of</strong> precipitation which is currently interpolated solely from<br />
sparse rain gauge data. Satellite data can also be useful in agricultural and hydrological applications such as<br />
crop monitoring and stream flow modelling. Mitigation measures for weather-related disasters can always use<br />
more accurate and timely information in the decision-making process.<br />
Why satellite rainfall estimation?<br />
It has been a constant challenge to represent the spatial distribution and quantity <strong>of</strong> precipitation at the small<br />
scale throughout the region since only a sparse rain gauge network has been available. When rain gauge<br />
data are not available or sufficient, satellite data can be used to derive quantitative estimates <strong>of</strong> precipitation<br />
that are then fed into hydrological models which can forecast discharge. This is one way to overcome the<br />
problem <strong>of</strong> data scarcity in the HKH region.<br />
session 11<br />
Computer-based modelling tools and their capabilities<br />
Geographic information systems (GIS). A GIS captures, stores, analyses, manages, and presents data<br />
that are linked to location. In the simplest terms, GIS is the merging <strong>of</strong> cartography, statistical analysis, and<br />
database technology. GIS systems are used in many disciplines, such as geography, hydrology, climatology,<br />
71
<strong>Flash</strong> <strong>Flood</strong> <strong>Risk</strong> <strong>Management</strong> – A <strong>Training</strong> <strong>of</strong> <strong>Trainers</strong> Manual<br />
land surveying, utility management, natural resource management, photogrammetry, urban planning,<br />
emergency management, navigation, and most importantly, flash flood modelling and mapping, hazard<br />
mapping, and flash flood risk management.<br />
HEC-GeoHMS. HEC-GeoHMS was developed by the United States Army Corps <strong>of</strong> Engineers’ Hydrologic<br />
Engineering Center (USACE/HEC) as a geo-spatial hydrology toolkit for engineers and hydrologists with<br />
limited GIS experience. The program allows users to visualise spatial information, document watershed<br />
characteristics, perform spatial analysis, delineate sub-basins and streams, construct inputs to hydrologic<br />
models, and it also assists them with report preparation. It creates hydrological inputs that can be used<br />
directly with the Hydrologic Modelling System, HEC-HMS.<br />
HEC-GeoRAS. HEC-GeoRAS is an extension to be used with Arc View GIS (a general purpose geographic<br />
information system s<strong>of</strong>tware program developed and copyrighted by the Environmental Systems Research<br />
Institute, Inc., (ESRI) Redlands, California. HEC-GeoRAS processes geospatial data for use with USACE/<br />
HEC’s River Analysis system (HEC-RAS, see below). The extension allows users to create HEC-RAS import<br />
files that contain geometric attribute data from existing digital terrain models (DTMs) and to process results<br />
obtained from HEC-GeoRAS.<br />
HEC-HMS. HEC-HMS was developed by USACE/HEC and is capable <strong>of</strong> simulating the precipitation-run<strong>of</strong>f<br />
in dendritic watershed systems. It was designed to be applied in a wide range <strong>of</strong> geographic areas and<br />
to solve the widest possible range <strong>of</strong> problems, from large river basin water supplies and flood hydrology<br />
to small urban or natural watershed run<strong>of</strong>f. Hydrographs produced by this program are used directly or in<br />
conjunction with other s<strong>of</strong>tware for studies <strong>of</strong> water availability, urban drainage, flow forecasting, future<br />
urbanisation impact, reservoir spillway design, flood damage reduction, floodplain regulation, and systems<br />
operations.<br />
The program is a generalised modelling system that is capable <strong>of</strong> representing many different watersheds.<br />
A model <strong>of</strong> the watershed is constructed by separating the hydrologic cycle into manageable pieces and<br />
constructing boundaries around the watershed <strong>of</strong> interest. Any mass or energy flux in the cycle is simulated<br />
by a mathematical model. In most cases, the user can choose between several available models for each<br />
flux. Each mathematical model included in the program is tailored to a given set <strong>of</strong> environmental conditions.<br />
Choosing the correct model requires having both prior knowledge <strong>of</strong> the watershed and knowing what the<br />
goals <strong>of</strong> the hydrologic study are, as well as engineering judgment. The program features a completely<br />
integrated work environment including a database, data entry utilities, computation engine, and tools for<br />
reporting results. A graphical user interface allows the user seamless movement between the different parts <strong>of</strong><br />
the program. Program functionality and appearance are the same across all supported platforms.<br />
session 11<br />
NWS Breach. The NWS Breach program was developed, in 1988, by Pr<strong>of</strong>essor DL Fread, Senior<br />
Hydrologist with the Hydrologic Research Laboratory, United States National Weather Service. This program<br />
mathematically models the breaching <strong>of</strong> an earthen dam either by overtopping or by a piping failure. The<br />
program predicts the dam-breach characteristics, such as size, shape, and time <strong>of</strong> formation, and graphs the<br />
breach outflow hydrograph.<br />
BOSS DAMBRK. BOSS DAMBRK is an enhanced version <strong>of</strong> the NWS DAMBRK model. This s<strong>of</strong>tware can<br />
be used to analyse dam and bridge failures, storage effects, and floodplain overbank flow and flood wave<br />
attenuation. It is used for one-dimensional hydrodynamic flood routing, dam safety analysis, and reservoir<br />
spillway analysis. The program can take into account reservoir inflow, breach formation, spillway and turbine<br />
flow, downstream tail water elevations, valley storage, frictional resistance and lateral inflows and outflows.<br />
It estimates flood wave travel time, time to flood stage, time to peak elevation, and the corresponding water<br />
surface elevations.<br />
HEC-RAS. HEC-RAS was developed by USACE/HEC and is capable <strong>of</strong> performing one-dimensional steady<br />
and unsteady flow water surface pr<strong>of</strong>ile calculations.<br />
72
Day 3<br />
Geospatial Stream Flow Model (GeoSFM). GeoSFM is a semi-distributed hydrological model for wide-area<br />
hydrology analysis. It uses globally available terrain, soil and land cover data, and satellite derived estimates<br />
<strong>of</strong> daily rainfall. The model outputs include stream flow and flood hazard maps.<br />
session 11<br />
73
<strong>Flash</strong> <strong>Flood</strong> <strong>Risk</strong> <strong>Management</strong> – A <strong>Training</strong> <strong>of</strong> <strong>Trainers</strong> Manual<br />
Session 12 Integrated <strong>Flash</strong> <strong>Flood</strong> and<br />
Watershed <strong>Management</strong><br />
Time: 90 minutes<br />
Objectives<br />
To introduce the concepts <strong>of</strong> integrated flash flood and watershed management, including:<br />
XX<br />
An integrated approach to flash flood management<br />
XX<br />
The major components <strong>of</strong> watershed management<br />
XX<br />
Watershed management measures<br />
Activities<br />
Activity 12.1: Integrated flash flood management (IFFM)<br />
Time: 45 minutes<br />
Step 1<br />
Step 2<br />
Step 3<br />
Step 4<br />
Discuss the traditional approaches to flash flood management.<br />
Discuss the shifting paradigm in flood management.<br />
Discuss the concept and objectives <strong>of</strong> IFFM.<br />
Discuss the key elements <strong>of</strong> IFFM in the context <strong>of</strong> integrated water resource management (see Box<br />
11 in RM 12.1)<br />
Engage the class in a quick question and answer session to help<br />
you assess how much they have understood about IFFM and<br />
what it aims to achieve.<br />
Note to the<br />
trainer<br />
Reiterate that IFFM aims to:<br />
• support sustainable development by balancing development<br />
needs and flood risk;<br />
• support livelihood security and reduce vulnerability by<br />
ensuring that different activities <strong>of</strong> poverty alleviation are<br />
incorporated into the planning;<br />
• use environmental preservation as a means <strong>of</strong> flood<br />
prevention;<br />
• reduce the number <strong>of</strong> lives lost.<br />
session 12<br />
Also reiterate that IFFM is an attempt to integrate:<br />
• land and water management;<br />
• upstream and downstream concerns;<br />
• structural and non-structural measures;<br />
• short-term and long-term strategies;<br />
• local- and basin-level measures;<br />
• top-down and bottom-up decision making;<br />
• development needs with ecological and economic concerns;<br />
• institutions with different functions.<br />
74
Day 3<br />
Activity 12.2: Concept and components <strong>of</strong> watershed management<br />
Time: 15 minutes<br />
Step 1<br />
Step 2<br />
Step 3<br />
Define what a watershed is. Show the map <strong>of</strong> a water basin and point out the major rivers, the<br />
minor rivers, and the contour lines. Alternatively, clarify the concept <strong>of</strong> a watershed by drawing a<br />
map on the board. Remember to include major rivers, minor rivers, and contour lines. On either<br />
map, draw a line around the basin boundary and indicate the different watersheds and sub<br />
watersheds. Explain that a major water basin can have several watersheds.<br />
Present the major components <strong>of</strong> a watershed.<br />
Present the benefits <strong>of</strong> watershed management:<br />
• Improved water availability<br />
• Improved water quality<br />
• Reduced risks <strong>of</strong> natural disasters<br />
• Higher crop yields<br />
• Increased biomass cover<br />
• Improved soil quality<br />
• Increased possibilities for income generating activities<br />
• Improved habitats for flora and fauna and, therefore, improved biodiversity<br />
Activity 12.3: Watershed management measures<br />
Time: 30 minutes<br />
Step 1<br />
Step 2<br />
Step 3<br />
Step 4<br />
Step 5<br />
Present the major watershed management measures, such as land-use management, agricultural<br />
remodelling, watercourse maintenance, and bioengineering.<br />
Discuss the major activities <strong>of</strong> land-use management and how they apply in different land types<br />
(e.g., agricultural land, forests, pastureland, and settlements).<br />
Discuss the various methods <strong>of</strong> agricultural remodelling such as multiple cropping and modified<br />
cropping patterns. Inform participants that information on the extent and timing <strong>of</strong> floods in a given<br />
area can be collected using various participatory rural appraisal (PRA) tools. The information<br />
gathered can be used to generate an agricultural ‘calendar’. With this information in hand, farmers<br />
can be advised on how to time their cultivation calendar so as to avoid the major flood periods.<br />
They can also be advised on what other suitable crops can be planted in the flood-free period.<br />
Discuss watercourse maintenance and floodplain management that includes flood hazard mapping<br />
with zoning areas on both sides <strong>of</strong> rivers. Mention that it shows the different zones with various<br />
levels <strong>of</strong> flood hazard to support management intervention: watercourse maintenance can also be<br />
done using social hazard mapping technique with the support <strong>of</strong> GIS.<br />
Explain the role <strong>of</strong> bioengineering in helping to stabilise and protect slopes and minimise run<strong>of</strong>f.<br />
Discuss how trees, grass, shrubs, and other vegetation can be used alone or in combination with<br />
small-scale structural measures.<br />
Note to the<br />
trainer<br />
Local people usually know most <strong>of</strong> the watershed management<br />
measures since these are based on local knowledge and common<br />
practices. Some <strong>of</strong> this knowledge and these practices can be<br />
shared with and replicated in other places if they are sustainable.<br />
In addition to local knowledge, simple scientific techniques such<br />
as bioengineering, techniques <strong>of</strong> jute netting, and small structural<br />
measures can be implemented. Watershed management should<br />
consist <strong>of</strong> both structural and non-structural measures.<br />
session 12<br />
75
<strong>Flash</strong> <strong>Flood</strong> <strong>Risk</strong> <strong>Management</strong> – A <strong>Training</strong> <strong>of</strong> <strong>Trainers</strong> Manual<br />
Session 12 Resource Materials<br />
RM 12.1: Integrated flash flood management<br />
Even though floods provide important ecosystem services, they have traditionally been viewed as negative<br />
phenomena and their positive attributes have been largely ignored. Accordingly, flood management has<br />
largely been problem driven, with most activities implemented after a severe flood. Different structural, nonstructural,<br />
physical, and institutional interventions are possible at different phases, i.e., before, during, and<br />
after the disaster. <strong>Flood</strong> management <strong>of</strong>ten conflicts with activities <strong>of</strong> other sectors, such as construction,<br />
agriculture, and water resource management. Traditional approaches to flood management have focused<br />
mainly on reducing run<strong>of</strong>f by controlling water at the source, storing run<strong>of</strong>f, enhancing the capacity <strong>of</strong> the<br />
river, putting adequate separation between the river and the population, emergency management, and flood<br />
recovery. The emphasis has been on control rather than on management. <strong>Flood</strong> control measures have usually<br />
been planned in isolation from other development, they have commonly been reactive rather than proactive,<br />
they have focused on structural measures, sought solutions from mono-disciplines, and integrated flood<br />
management policies have been neglected (for details see WMO 2009).<br />
Climate change projections suggest that in future there will be an increase in the frequency and magnitude <strong>of</strong><br />
flash floods, and that there will be a wider distribution <strong>of</strong> flood events. A new concept <strong>of</strong> flood management<br />
emphasises the need to find ways <strong>of</strong> making life sustainable even in flash flood prone areas and floodplains,<br />
even when there is considerable risk to life and property. The IFFM approach integrates water resource<br />
management, land-use management, and hazard management; it changes the flood management paradigm<br />
from defensive to pro-active, from ad-hoc to integrated flood management. It focus on managing and living<br />
with floods, balancing floods for sustainable development, and approaching the decision-making process<br />
differently by learning to manage risk (WMO 2009).<br />
According to the Global Water Partnership (GWP), integrated water resources management (IWRM) is a<br />
process that promotes the coordinated development and management <strong>of</strong> water, land, and related resources<br />
to maximise the resultant economic and social welfare equitably without compromising the sustainability <strong>of</strong><br />
vital ecosystems (Global Water Partnership Technical Advisory Committee 2000, cited in WMO 2009).<br />
Sustainable and effective management <strong>of</strong> water resources demands a holistic approach, linking social and<br />
economic development with the protection <strong>of</strong> natural ecosystems and appropriate management links between<br />
land and water uses.<br />
Integrated flash flood management (IFFM) promotes an integrated approach (Box 11); it advocates the<br />
integrated development <strong>of</strong> land and water resources in a river basin within the context <strong>of</strong> IWRM, and it aims<br />
at maximising the benefits <strong>of</strong> using floodplains and minimising loss <strong>of</strong> life from flooding. Furthermore, it focuses<br />
on environmental conservation and sustainable<br />
development.<br />
session 12<br />
IFFM has four major components: water<br />
resources management, water quality<br />
management, hazard management, and<br />
land use management (Figure 13). Integrated<br />
flash flood management recognises the river<br />
basin as a dynamic system in which there<br />
are many interactions and fluxes between<br />
land and water bodies. In IFFM the starting<br />
point is a vision <strong>of</strong> what the river basin should<br />
be. Incorporating a sustainable livelihood<br />
Box 11: Major elements <strong>of</strong> IFFM<br />
• Managing risk<br />
• Seeing floods are part <strong>of</strong> the water cycle<br />
• Taking a multi-hazard approach; flash floods<br />
give rise to ancillary hazards<br />
• Using the river basin as a planning unit<br />
• Looking at all aspects - interdisciplinary<br />
• A participatory approach involving the whole<br />
community<br />
76
Day 3<br />
perspective means looking for<br />
ways <strong>of</strong> identifying opportunities<br />
to enhance the performance <strong>of</strong><br />
the system as a whole. IFFM<br />
does not only reduce the losses<br />
from floods but also maximises<br />
the efficient use <strong>of</strong> floodplains –<br />
particularly where land resources<br />
are limited. While reducing<br />
loss <strong>of</strong> life should remain the<br />
top priority, the objective <strong>of</strong><br />
flood loss reduction should be<br />
secondary to the overall goal <strong>of</strong><br />
optimising the use <strong>of</strong> floodplains.<br />
Increases in flood losses can be<br />
consistent with an increase in<br />
the efficient use <strong>of</strong> floodplains,<br />
in particular, and the basin as a<br />
whole, in general (Brilly 2001).<br />
Figure 13: Integrated <strong>Flash</strong> <strong>Flood</strong> <strong>Management</strong> Model<br />
Water quality<br />
management<br />
Water<br />
resources<br />
management<br />
Land use<br />
management<br />
Hazard<br />
management<br />
An integrated flash flood<br />
management scheme involves integrated strategies for both structural and non-structural measures and for<br />
living with floods, as well as both short- and long-term, and local- and basin-level measures. It aims to balance<br />
development with a focus on environmental conservation. It includes several aspects <strong>of</strong> flood management<br />
such as, scientific and engineering, social, environmental, economic, legal and institutional.<br />
Key elements <strong>of</strong> IFFM, following from flood management in the context <strong>of</strong> IWRM<br />
Managing the water cycle as a whole. <strong>Flood</strong> management plans need to be integrated with drought<br />
management plans in order to make effective use <strong>of</strong> floodwaters and to maximise the positive aspects <strong>of</strong><br />
floods. <strong>Flood</strong> and drought management should also be linked with groundwater management, as the role that<br />
floodplains play in recharging groundwater cannot be neglected; and with urban flood management and<br />
urban water management, particularly drinking water supply, sewerage, and wastewater and surface run<strong>of</strong>f<br />
disposal.<br />
Integrate land and water management. The water quantity, water quality, and the process <strong>of</strong> erosion and<br />
deposition within a river basin are all linked. The type and density <strong>of</strong> the vegetative cover and the area’s landuse<br />
characteristics are all important in understanding how the catchment responds to rainfall. Thus, integrated<br />
planning <strong>of</strong> land and water, both upstream and downstream, is essential and is advocated in IFFM.<br />
Manage risk and uncertainty. People <strong>of</strong>ten choose to live in flood prone areas where risk to property<br />
and life is high, such as floodplains, because these areas provide livelihood opportunities and resources.<br />
Therefore, policy should consider risk at the individual, household, and community levels, and in the context<br />
<strong>of</strong> livelihoods, poverty alleviation, and socioeconomic development. Importantly, flood risk is associated<br />
with uncertainties, especially regarding hydrometeorological processes. Social, economic, and political<br />
uncertainties also affect the choice <strong>of</strong> management strategies.<br />
Ensure a participatory approach. IFFM should be based on a participatory approach; it needs to be open,<br />
transparent, inclusive, and communicative, and the decision making needs to be decentralised. A bottomup<br />
approach is <strong>of</strong>ten considered the best; however, an extreme bottom-up approach can entail a risk <strong>of</strong><br />
fragmentation rather than integration. On the other hand, top-down approaches can require greater effort and<br />
can undermine the intentions <strong>of</strong> the responsible local institutions. It is important to use an appropriate mix to<br />
benefit from the strengths <strong>of</strong> both approaches.<br />
session 12<br />
77
<strong>Flash</strong> <strong>Flood</strong> <strong>Risk</strong> <strong>Management</strong> – A <strong>Training</strong> <strong>of</strong> <strong>Trainers</strong> Manual<br />
Institutional synergy. Institutions all have their own geographical and functional boundaries, but for an optimal<br />
outcome it is necessary to fold all diverse views and opinions into the decision-making process. The activities<br />
<strong>of</strong> local, regional, and national development agencies, including private agencies working in agriculture,<br />
urban and watershed development, mining, poverty alleviation, environmental conservation, and forestry,<br />
should be coordinated at the appropriate levels. The challenge is to promote cooperation and coordination<br />
across functional and administrative boundaries.<br />
Adopt the best mix <strong>of</strong> strategies. The<br />
optimal strategy for a given area<br />
will depend on the hydrological and<br />
hydraulic characteristics <strong>of</strong> the river<br />
system and the watershed. Three linked<br />
factors determine which strategy or<br />
combination <strong>of</strong> strategies is likely to be<br />
appropriate in a particular river basin: the<br />
climate, the basin characteristics, and the<br />
socioeconomic conditions <strong>of</strong> the region.<br />
Quite different strategies are likely to be<br />
appropriate in different situations and<br />
different countries. The strategies <strong>of</strong>ten<br />
involve a combination <strong>of</strong> complementary<br />
options in a layered approach<br />
(Table 7). IFFM discards isolated<br />
perspectives. Successful IFFM entails<br />
looking at the situation as a whole,<br />
comparing the available options, and<br />
selecting the strategy or combination<br />
<strong>of</strong> strategies, both structural and nonstructural,<br />
that is most appropriate to the<br />
particular situation.<br />
Table 7: Strategies and options for flood management<br />
Strategy<br />
Reducing flooding<br />
Reducing<br />
Susceptibility to<br />
damage<br />
Mitigating the<br />
impacts <strong>of</strong> flooding<br />
Preserving the natural<br />
resources <strong>of</strong> flood<br />
plain<br />
Source: WMO (2009)<br />
Options<br />
Dams and reservoirs<br />
Dike, levees and flood embankments<br />
High flow diversion<br />
Catchment management<br />
<strong>Flood</strong>plain regulation<br />
Development and redevelopment policies<br />
Design and location <strong>of</strong> facilities<br />
Housing and building codes<br />
<strong>Flood</strong> pro<strong>of</strong>ing<br />
<strong>Flood</strong> forecasting and warning<br />
Disaster preparedness<br />
Past flood recovery<br />
<strong>Flood</strong> insurance<br />
<strong>Flood</strong> plain zoning and regulation<br />
Integrated hazard management approaches. Communities are exposed to various natural and human-made<br />
hazards and risks. IFFM should be integrated into a wider risk management system. Since hazards such as<br />
landslides or GLOFs upstream have the potential to generate or modify the flood risk downstream, a holistic<br />
approach is essential. This type <strong>of</strong> approach can lead to structured information exchange and the formation<br />
<strong>of</strong> effective organisational relationships. The advantage <strong>of</strong> a holistic approach is that it brings together many<br />
different disciplines to speak with a single voice. This is beneficial in dealing with communities because<br />
effective early warnings for all forms <strong>of</strong> natural hazards are best accepted if they emanate from a single,<br />
<strong>of</strong>ficially designated authority with a legally assigned responsibility.<br />
session 12<br />
RM 12.2: Concept and components <strong>of</strong> watershed management<br />
Simply put, a watershed is a land area from which a river receives its water supply. Small rivers have small<br />
catchment areas; large river systems cover a large area consisting <strong>of</strong> several small rivers. The components<br />
<strong>of</strong> a watershed are social (e.g., population, settlements), environmental (e.g., agricultural lands, forests,<br />
water, rangelands), and physical (e.g., slopes, ridges, valleys). People use the environmental components or<br />
resources to meet their livelihood and other needs. The sustainable use <strong>of</strong> these resources is very important to<br />
control run<strong>of</strong>f and erosion and to help manage the flash floods. The community also manages the floods using<br />
non-structural measures.<br />
Watershed management is a holistic approach to natural resource management in which communities try to<br />
maintain watersheds and improve soil fertility and biomass coverage since these provide key resources for<br />
78
Day 3<br />
their livelihoods. Watershed management has three phases: the identification <strong>of</strong> users and the preparation <strong>of</strong><br />
a watershed management plan; putting the plan into practice; and long-term implementation <strong>of</strong> the plan.<br />
RM 12.3: Measures <strong>of</strong> watershed management<br />
Watershed management is basically the proper use<br />
<strong>of</strong> land. It involves the use <strong>of</strong> both structural and<br />
non-structural measures for controlling run<strong>of</strong>f and<br />
erosion. Land-use management (Box 12), modification<br />
<strong>of</strong> cropping, watercourse maintenance, and<br />
bioengineering are primary management interventions<br />
for which community participation is very important.<br />
Land use management<br />
Box 12: Some land-use<br />
management measures<br />
• Terracing, terrace improvement<br />
• Avoiding cultivation on slopes >25%<br />
• Reforestation<br />
• Grazing regulation<br />
• Trail management<br />
Land use management consists <strong>of</strong> two major activities to<br />
reduce flash flood risk: management <strong>of</strong> settlements, and management <strong>of</strong> agricultural land and forests.<br />
The development <strong>of</strong> settlements in a flood zone must be restricted or follow rules for special housing design.<br />
Such settlements near flood zones not only put people at risk, they also alter the natural flow <strong>of</strong> water which<br />
increases the overall risk to the whole area.<br />
Different factors such as population growth and poverty have compelled people to convert forests and pasture<br />
lands into farmlands. Overgrazing <strong>of</strong> pasture lands adversely affects soil stability and plant cover. Moreover,<br />
it leads to a decrease in the interception and infiltration <strong>of</strong> rainwater, both <strong>of</strong> which enhance surface run<strong>of</strong>f.<br />
Thus, proper land use management activities such as terracing, reforestation, pasture regulation, trail<br />
management, and avoiding cultivation on steep slopes are important.<br />
Land use control has much in common with floodplain management. Land use regulations are designed to<br />
reduce danger to life, property, and development when flash floods occur. Some land-use regulations include<br />
reducing the population density in flash flood prone areas (to reduce the number <strong>of</strong> potential casualties),<br />
preventing development (especially the construction <strong>of</strong> houses in the high risk areas), and maintaining natural<br />
water courses.<br />
Cropping modifications<br />
<strong>Flood</strong>s can damage crops at any stage <strong>of</strong> their development, from the seedling stage to just prior to<br />
harvesting. Strategies for minimising the adverse effects <strong>of</strong> recurrent floods on agriculture include multiple<br />
cropping and restructuring <strong>of</strong> the cropping pattern (Swaminathan 1980). An example <strong>of</strong> multiple cropping<br />
in low-lying areas is the cropping <strong>of</strong> medium-tall Ahu rice with deep-water rice as insurance so that if the Ahu<br />
rice is damaged there will be some production from the deep-water rice. Restructuring <strong>of</strong> the cropping pattern<br />
builds on the idea that the safest way to assure crop production in flood prone areas is to grow more crops<br />
during the flood-free period.<br />
Watercourse maintenance<br />
Maintenance and restoration interventions in natural and artificial watercourses are necessary to assure that<br />
these waterways <strong>of</strong>fer maximum discharge capacity during strong flood events. Watercourses <strong>of</strong>ten change<br />
their paths, but human activities such as quarrying river materials (sand, stone, water itself) can intensify this<br />
meandering process. It is wise to leave watercourses in their natural state. General maintenance measures for<br />
watercourse areas include the following.<br />
• Delineate a buffer zone in the floodplain and restrict settlement and agricultural activities in this area.<br />
• Develop the floodplain as an ecological corridor.<br />
session 12<br />
79
<strong>Flash</strong> <strong>Flood</strong> <strong>Risk</strong> <strong>Management</strong> – A <strong>Training</strong> <strong>of</strong> <strong>Trainers</strong> Manual<br />
• Do not interfere with the natural course <strong>of</strong> water.<br />
• Maintain watercourse reaches that are still in their natural state.<br />
• Protect specific habitats.<br />
• Undertake structural interventions to improve ecological functions. Activate old branches and create<br />
biotopes where necessary to comply with the ideal conditions established by environmental models.<br />
• Undertake flood damage prevention measures.<br />
• Take measures to counter harmful local influences that could be detrimental to the whole system, such as<br />
erosion and sedimentation.<br />
• Maintain natural depressions that act as natural retention areas during floods.<br />
Bioengineering<br />
Bioengineering is the integration <strong>of</strong> vegetative methods with simple engineering practices. It can be very<br />
effective for watershed management using local resources (Bhatta et al. 1999). For example, bioengineering<br />
can be used to stabilise mountain slopes. Commonly practiced bioengineering techniques that can be<br />
used to stabilise slopes and to help minimise run<strong>of</strong>f include: planting trees, shrubs, and grasses (Li 1999;<br />
Wagley 1999). These can be planted on degraded slopes, either alone or in combination where together<br />
a dense network <strong>of</strong> roots in the soil and a canopy overhead helps to protect the slope from erosion, which<br />
in turn prevents landslides that can dam rivers. The type <strong>of</strong> vegetation that should be planted depends on the<br />
purpose, site condition, and availability <strong>of</strong> resources.<br />
Bioengineering measures include the following.<br />
• Planting woody vegetation along the contours to trap soil particles and debris moving down the slope.<br />
• Seeding grass, trees, and shrubs directly on site, either alone or in combination. Seeds can be broadcast<br />
to cover large areas in a short time at low cost. This method can be used on steep, rocky, and unstable<br />
slopes where seedlings and cuttings cannot be planted directly.<br />
• Planting bamboo or broom grass (rooted culm cuttings, rhisomes, or wild seedlings) to stabilise slopes.<br />
• Wattling. Bundles <strong>of</strong> live branches with buds are put into trenches along contours and are covered with a<br />
thin layer <strong>of</strong> soil. When the branches put out roots and shoots, a strong vegetative barrier is formed that is<br />
effective in retaining the soil and stopping its movement down the slope.<br />
• Creating brushwood check dams <strong>of</strong> bamboo and wood to stabilise gullies on slopes.<br />
• Vegetated riprap. Side slopes <strong>of</strong> gullies and gully beds can be protected by constructing dry stone walls<br />
and sowing or planting grass in the gaps between the stones to reinforce the toe walls and gully beds.<br />
• Constructing loose stone and gabion check dams to stabilise slopes. After the construction <strong>of</strong> the check<br />
dam, seedlings <strong>of</strong> trees, shrubs, and grasses are planted either separately or in combination on the gully<br />
heads, side slopes, and gully beds, and in and around the structure for reinforcement.<br />
• Using jute netting to protect grass slips or seedlings planted on slopes during their early growing period.<br />
Later, once the plants are established and the netting is no longer needed, the jute decomposes into the<br />
soil.<br />
Watersheds consist <strong>of</strong> both upstream and downstream components. For sustainable development and risk<br />
management, an integrated watershed management approach is essential. An integrated approach can<br />
introduce stall feeding to help reduce overgrazing <strong>of</strong> pasture, for example, and/or introduce biogas or solar<br />
power for household activities to reduce dependence on natural resources. Good governance, transparency,<br />
and unity in a community are fundamental requirements <strong>of</strong> proper watershed management.<br />
session 12<br />
80
Day 3<br />
Session 13 Hazard-Specific <strong>Flash</strong> <strong>Flood</strong><br />
<strong>Management</strong>: Intense Rainfall <strong>Flood</strong>s<br />
Time: 60 minutes<br />
Session 13<br />
Objectives<br />
To introduce the characteristics <strong>of</strong> intense rainfall floods and to introduce forecasting as a tool for flash flood<br />
risk management, including<br />
XX<br />
The methods used to measure rainfall and to estimate catchment rainfall<br />
XX<br />
The correlation between rainfall and run<strong>of</strong>f and the factors that affect catchment run<strong>of</strong>f<br />
XX<br />
Discharge and the methods used to measure discharge<br />
XX<br />
<strong>Flood</strong> routing and the methods used to determine hydrographs<br />
XX<br />
<strong>Flood</strong> frequency and return period<br />
Activities<br />
Activity 13.1: Rainfall measurement and catchment rainfall<br />
Time: 10 minutes<br />
Step 1<br />
Step 2<br />
Step 3<br />
Step 4<br />
Present and discuss the various types <strong>of</strong> precipitation (e.g., rain, snow, hail). Explain how rainfall is<br />
measured and recorded.<br />
Distinguish between ‘total rainfall’ and rainfall intensity. Discuss how knowing the intensity <strong>of</strong> the<br />
rainfall over a short period is more important for predicting flash floods than knowing the total<br />
rainfall over a longer period.<br />
Discuss how data from a rain gauge can be used to estimate rainfall at the catchment level using<br />
methods such as the arithmetic average, the Theissen polygon method, and the isohyetal method.<br />
Discuss the importance <strong>of</strong> rainfall measurements for flash flood forecasting and preparedness.<br />
Activity 13.2: Run<strong>of</strong>f and factors that affect it<br />
Time: 10 minutes<br />
Define run<strong>of</strong>f and peak run<strong>of</strong>f rates and discuss the factors that affect run<strong>of</strong>f. Discuss how rainfall and run<strong>of</strong>f<br />
are related.<br />
Activity 13.3: Discharge and methods <strong>of</strong> measuring it<br />
Time: 15 minutes<br />
Define discharge and explain how it is measured. Explain what a rating curve is.<br />
81
<strong>Flash</strong> <strong>Flood</strong> <strong>Risk</strong> <strong>Management</strong>: A <strong>Training</strong> <strong>of</strong> <strong>Trainers</strong> Manual<br />
Session 13<br />
Activity 13.4: <strong>Flood</strong> routing and calculating hydrographs at different<br />
locations<br />
Time: 15 minutes<br />
Step 1<br />
Discuss the concept <strong>of</strong> flood routing and differentiate between hydrologic and hydraulic routing.<br />
Explain why flood routing is important for flash flood management.<br />
Step 2<br />
Discuss the various types <strong>of</strong> routing methods. Assign a simple exercise on flood routing where the<br />
participants have to calculate flow values at different times and locations. (See Box 13 in RM 13.4<br />
for the exercise.)<br />
Activity 13.5: <strong>Flood</strong> frequency and return period<br />
Time: 10 minutes<br />
Step 1<br />
Step 2<br />
Define flood frequency and return period, and discuss the method used to determine return periods.<br />
Discuss why return period is an important parameter for flash flood management.<br />
82
Day 3<br />
Session 13 Resource Materials<br />
RM 13.1: Rainfall measurement and catchment rainfall<br />
Rainfall measurement<br />
Rainfall is a main source <strong>of</strong> water supply; other forms <strong>of</strong> precipitation include snow, hail, sleet, mist, dew,<br />
and fog. It is important to measure rainfall in order to be able to forecast and prepare for flash floods. In<br />
the case <strong>of</strong> riverine floods, the total amount <strong>of</strong> rainfall during a period <strong>of</strong> time is important. The total amount<br />
<strong>of</strong> precipitation can be measured using simple rain gauges. However, for flash floods, the total amount is<br />
less important than the intensity <strong>of</strong> the rainfall, since high-intensity rainfall for even for a short period <strong>of</strong> time<br />
can cause a flash flood. The intensity <strong>of</strong> rainfall cannot easily be determined by manual rain gauges. More<br />
appropriate are recording-type rain gauges that give a continuous record <strong>of</strong> rainfall which can be resolved<br />
into desired time intervals; examples <strong>of</strong> these are tipping bucket or siphon-type gauges.<br />
Session 13<br />
A rain gauge gives a point measurement at a particular location, but intense rainfall can be also spatially<br />
variable, particularly in mountain areas. A dense network <strong>of</strong> rain gauges is needed to obtain a reliable<br />
spatial survey <strong>of</strong> rainfall in a catchment. If it is not possible to deploy a large number <strong>of</strong> gauges then, it is<br />
important to identify the key locations in the catchment that can provide the most crucial information for flash<br />
flood risk management.<br />
Catchment rainfall<br />
For flash flood risk management measures such as forecasting or modelling, point data from rain gauges<br />
alone are not sufficient. The data must be transformed into spatial data or area-averaged data for the<br />
catchment. Several methods can be used to calculate area averages. The simplest is to calculate the<br />
arithmetic average <strong>of</strong> rainfall in each rain gauge; however, this method cannot capture spatial variability and<br />
is seldom used.<br />
A simple method is the Theissen polygon method, which uses an average based on the assumption that a<br />
gauge best represents the rainfall in the area nearest to it. The resulting polygons represent the areas closest<br />
to each gauge. The average rainfall derived from the Theissen polygon method is remarkably similar to the<br />
arithmetic average in this case, but generally these two methods give different results.<br />
A more accurate method for calculating catchment rainfall is the isohyetal method. In this method, isohyets or<br />
lines <strong>of</strong> equal rainfall are drawn in the same way that contour lines are drawn on an elevation map. There<br />
are various computer s<strong>of</strong>tware models available that use sophisticated algorithms to generate isohyets. Some<br />
incorporate terrain characteristics in generating the map. Raster maps <strong>of</strong> rainfall distribution over an area<br />
can also be generated. Raster maps represent continuous rainfall fields over the area <strong>of</strong> interest. As needed,<br />
average rainfall at different spatial scales can be calculated from the raster maps.<br />
RM 13.2: Run<strong>of</strong>f and factors that affect it<br />
Run<strong>of</strong>f<br />
The rainfall in a catchment is stored either on the surface or as moisture in the soil; part <strong>of</strong> it is lost by<br />
evaporation and part by transpiration. Only some <strong>of</strong> the rainfall, known as excess rainfall or effective rainfall,<br />
contributes to run<strong>of</strong>f from the catchment. In order to estimate the size <strong>of</strong> the flood that can be generated by a<br />
given amount <strong>of</strong> rainfall, the run<strong>of</strong>f must be calculated.<br />
83
<strong>Flash</strong> <strong>Flood</strong> <strong>Risk</strong> <strong>Management</strong>: A <strong>Training</strong> <strong>of</strong> <strong>Trainers</strong> Manual<br />
Session 13<br />
Table 8: Factors affecting catchment run<strong>of</strong>f<br />
Climate<br />
Forms <strong>of</strong> precipitation (e.g., rain, snow, hail)<br />
Types <strong>of</strong> precipitation (e.g., intensity, duration,<br />
aerial distribution)<br />
Interception (depends on vegetation species,<br />
composition, age and density <strong>of</strong> stands,<br />
season, storm size, and others)<br />
Evaporation (depends on temperature, wind,<br />
atmospheric pressure, nature and shape <strong>of</strong><br />
catchment, and others)<br />
Transpiration (e.g., temperature, solar<br />
radiation, wind, humidity, soil moisture, type<br />
<strong>of</strong> vegetation)<br />
Physiographic<br />
Basin characteristics<br />
Geometric factors (size, shape,<br />
slope, orientation, elevation, stream<br />
density)<br />
Physical factors (land use and cover,<br />
surface infiltration condition, soil<br />
type, geological conditions such as<br />
permeability, topographic conditions<br />
such as lakes, swamps and artificial<br />
drainage)<br />
Channel characteristics<br />
Carrying capacity (size<br />
and shape <strong>of</strong> cross<br />
section, slope, roughness,<br />
length, tributaries)<br />
Storage capacity<br />
(backwater effects)<br />
Source: Chow (1984)<br />
Run<strong>of</strong>f from a catchment is affected by climatic factors and physiographic factors. Climatic factors vary with<br />
the seasons. Physiographic factors can be further classified as either basin or channel characteristics (Table 8).<br />
Several complicated computer models are available that can compute run<strong>of</strong>f and flood magnitude based on<br />
rainfall and other data. ICIMOD has developed a manual on rainfall-run<strong>of</strong>f modelling using the HEC-HMS<br />
3.1.0 model developed by the United States Army Corps <strong>of</strong> Engineers’ Hydrologic Engineering Center<br />
(USACE/HEC 2011).<br />
RM 13.3: Discharge and methods <strong>of</strong> measuring it<br />
Discharge<br />
The quantity <strong>of</strong> water flowing though a channel (natural or artificial) is known as discharge, sometimes<br />
it is also referred to as stream-flow. In the metric system, discharge is measured in m 3 /sec system and is<br />
sometimes denoted as cumecs. In the English system, discharge is typically measured in ft 3 /sec, sometimes<br />
denoted as cusecs. The discharge and the nature <strong>of</strong> the channel (e.g., cross-section area, slope, roughness <strong>of</strong><br />
the channel) determines the extent <strong>of</strong> flooding in a given location. The graph showing discharge as a function<br />
<strong>of</strong> time is called a discharge hydrograph or stream flow hydrograph. The hydrograph can be an annual<br />
hydrograph or an event hydrograph. Annual hydrographs plot annual average discharge fluctuations over the<br />
course <strong>of</strong> a year while event or storm hydrographs show the peak discharges that occur during a particular<br />
storm event.<br />
Measurement <strong>of</strong> discharge<br />
Discharge can be measured in many ways. The following are a few <strong>of</strong> the more common methods.<br />
Velocity area method. This is the most commonly used method. The cross-section <strong>of</strong> the river is divided into<br />
several vertical sections and the velocity <strong>of</strong> the water flow is measured at a fixed depth in each section. A<br />
current meter is used to measure the velocity <strong>of</strong> the water. Generally, the velocity is measured at 20% and<br />
80% <strong>of</strong> the river’s depth (d) (referred to as 0.2d and 0.8d, respectively). The velocity can be measured<br />
from a cable car, or if the depth is low, a wading technique can be used. The average <strong>of</strong> the two velocity<br />
measurements gives the average velocity <strong>of</strong> that section. The velocity <strong>of</strong> each section is multiplied by the area<br />
<strong>of</strong> the section, and the products for each section are summed to derive the discharge <strong>of</strong> the entire crosssection.<br />
n<br />
Q = ∑ A i<br />
x V i<br />
i=1<br />
84
Day 3<br />
where<br />
Q = discharge<br />
A = area <strong>of</strong> section i<br />
V = velocity <strong>of</strong> section i<br />
Float method. The velocity can also be calculated by a simpler method if the depth is shallow and high<br />
accuracy is not required. Two markers are fixed on the stream bank at the same distance upstream and<br />
downstream from the cross-section where the discharge measurement is being conducted. The distance<br />
between the markers is measured and the cross-sectional area <strong>of</strong> the stream at the point <strong>of</strong> interest is<br />
measured. A floating object such as a cork or wooden block is released at the centre <strong>of</strong> the stream. The times<br />
at which the float crosses the first and the second marker are noted.<br />
Session 13<br />
The velocity <strong>of</strong> the river is given by:<br />
V =<br />
d<br />
T2 – T 1<br />
where T 1<br />
and T 2<br />
are the times recorded at markers 1 and 2, respectively, and d is the distance between the<br />
two markers.<br />
Such float measurements are conducted several times and the mean velocity, V m<br />
is calculated. The discharge<br />
at the cross-section <strong>of</strong> interest is given by:<br />
Q = A x V m<br />
where A is the cross-sectional area <strong>of</strong> the stream.<br />
Dilution method. This method is particularly appropriate for mountain streams where due to the gradients,<br />
the turbulence is high and measurements by the current meter method are not possible. A tracer <strong>of</strong> known<br />
concentration is put in the water at the upstream end <strong>of</strong> the specified reach and its concentration is monitored<br />
in the downstream reach. The distance should be adequate to ensure thorough mixing <strong>of</strong> the tracer in the<br />
water and there should not be an inlet, outflow, or stagnant water zone within the reach. The tracer can be<br />
common salt or a fluorescent dye, which is not readily absorbed either by the bed materials <strong>of</strong> the stream<br />
or the suspended sediment. The tracer can be injected into the stream instantaneously or in a continuous<br />
manner at a constant rate. For continuous injection a special apparatus called a Mariotte bottle is used. The<br />
concentration at the downstream end is determined by collecting a water sample and analysing it using<br />
appropriate techniques. If a salt tracer is used, a conductivity meter is used to derive the concentration, while<br />
for a dye tracer, a fluorimeter is used. The discharge Q is calculated by using following equation:<br />
C 1<br />
– C 2<br />
Q = q x<br />
C2 – C 0<br />
where q is the injection rate <strong>of</strong> the tracer and C 1<br />
, C 2<br />
, and C 0<br />
are the concentrations <strong>of</strong> the tracer during<br />
injection, at the downstream end (sampling point), and in the background concentration <strong>of</strong> the stream water,<br />
respectively.<br />
Slope area method. This method is particularly suitable for post-flood investigations; it is used to estimate<br />
the peak discharge <strong>of</strong> a flash flood after the flood has passed. This is an indirect method <strong>of</strong> obtaining<br />
discharge in streams; the velocity is not measured, but instead it is calculated using the Manning uniform flow<br />
equation. To compute the velocity, the area, the wetted perimeter, the channel slope, and the roughness <strong>of</strong> the<br />
reach where the discharge is to be determined must be known. The area, the perimeter, and the slope are<br />
measured and the roughness coefficient is estimated as accurately as possible. The Manning equation is:<br />
1<br />
V =<br />
n<br />
x R<br />
2<br />
3<br />
x S<br />
1<br />
2<br />
85
<strong>Flash</strong> <strong>Flood</strong> <strong>Risk</strong> <strong>Management</strong>: A <strong>Training</strong> <strong>of</strong> <strong>Trainers</strong> Manual<br />
Figure 14: Slope area method<br />
Session 13<br />
<strong>Flood</strong> level<br />
Day Three<br />
Flow area = A<br />
Wetted perimeter = P<br />
Nature <strong>of</strong> the bed = n<br />
Slope = S<br />
Source: Shrestha (2008)<br />
where n is the Manning coefficient, R is the hydraulic radius, and S is the longitudinal slope (see Figure 14).<br />
The steps for estimating discharge using the slope area method are as follows:<br />
Step 1: Select as straight a section <strong>of</strong> the river with as uniform a slope, cross-section, and roughness as<br />
possible.<br />
Step 2: Conduct a detailed survey <strong>of</strong> the river reach, and estimate its Manning roughness coefficient, n. The<br />
Manning coefficients are given in Table 9. The highest flood mark should also be recorded.<br />
Step 3: Calculate the flow area A and determine the wetted perimeter P using the survey data. The<br />
longitudinal slope also needs to be taken into account. The hydraulic radius, R is calculated using R = A/P.<br />
The values obtained are used to calculate the flow velocity during the flash flood using the Manning equation.<br />
Then the discharge, Q, is calculated using Q = A x V.<br />
RM 13.4: <strong>Flood</strong> routing and calculating hydrographs at different locations<br />
<strong>Flood</strong> routing<br />
<strong>Flood</strong> routing is a procedure used to determine the time and magnitude <strong>of</strong> flow at a given point on a water<br />
course; it uses known or assumed flood parameters at one or more points upstream. The methods used to<br />
calculate the parameters are described above. <strong>Flood</strong> routing can provide information such as the impact <strong>of</strong><br />
the flood at the locations <strong>of</strong> communities and settlements downstream <strong>of</strong> the catchment outlet. It is a highly<br />
technical procedure and various computer s<strong>of</strong>tware programs are available to calculate this complicated<br />
flood routing.<br />
86
Day 3<br />
There are two types <strong>of</strong> routing, hydrologic and hydraulic routing. Both <strong>of</strong> these methods use some form <strong>of</strong> the<br />
continuity equation.<br />
Hydrologic routing. Hydrologic routing methods combine the continuity equation with some relationship<br />
between storage, outflow, and inflow. These relationships are usually assumed, empirical, or analytical in<br />
nature. An example <strong>of</strong> such a relationship might be a stage-discharge relationship.<br />
Session 13<br />
Hydraulic routing. Hydraulic routing methods use the continuity equation in combination with other physical<br />
relationships that describe the physics <strong>of</strong> the movement <strong>of</strong> the water. The momentum equation is the one most<br />
commonly used. In hydraulic routing analysis, it is intended that the dynamics <strong>of</strong> the water or flood wave<br />
movement is more accurately described.<br />
Table 9: Values <strong>of</strong> the Manning coefficient<br />
Manning Typical appearance Manning Typical appearance<br />
n value<br />
n value<br />
Source: USGS (no date)<br />
87
<strong>Flash</strong> <strong>Flood</strong> <strong>Risk</strong> <strong>Management</strong>: A <strong>Training</strong> <strong>of</strong> <strong>Trainers</strong> Manual<br />
Routing methods<br />
Session 13<br />
The basic principle <strong>of</strong> flood routing is the continuity <strong>of</strong> flow as expressed by the continuity equation. Several<br />
methods can be used to calculate flood routing, these include: modified plus, kinematic wave, Muskingum,<br />
Muskingum-Cunge, and dynamic (Chow et al. 1988). The following discussion is limited to the Muskingum<br />
method, a commonly used hydrological flood routing method that models the storage volume <strong>of</strong> flooding in a<br />
stream channel by a combination <strong>of</strong> wedge and prism storage.<br />
In the Muskingum method, K and X are determined graphically from the hydrograph, while in the Musking-<br />
Cunge method they can be determined using the following equations:<br />
∆X<br />
1 Qmax<br />
K = and X = (1 − )<br />
C k 2<br />
BS C x<br />
where C k<br />
is celerity and B is the width <strong>of</strong> the water surface.<br />
0<br />
k ∆<br />
The exercise in Box 13 makes the method much clearer. It shows the calculation <strong>of</strong> peak discharge at 6 km<br />
distance from the origin. The calculation can be carried out in a similar way for the remaining hydrographs at<br />
12 and 18 km distance.<br />
RM 13.5: <strong>Flood</strong> frequency and return period<br />
<strong>Flood</strong> frequency<br />
<strong>Flood</strong>s are recurring phenomena. The chance <strong>of</strong> a flood happening at a given location can be calculated<br />
using a probability function. One <strong>of</strong> the simplest probability functions used to determine flood intensity is the<br />
return period (T). It is a statistical estimate indicating the average recurrence interval based on data collected<br />
over an extended period <strong>of</strong> time. The return period is an important parameter required for risk analysis. Return<br />
period can be determined using the following equation:<br />
T =<br />
n + 1<br />
m<br />
where n is the number <strong>of</strong> years on record, and m is the rank <strong>of</strong> the flood being considered (in terms <strong>of</strong> the<br />
flood size in m³/sec).<br />
The return period is important in relating extreme discharge to average discharge. The return period has<br />
an inverse relationship with the probability (P) that the event will be exceeded in any year. For example, a<br />
10-year flood has 0.1 or 10% chance <strong>of</strong> being exceeded in any year while a 50-year flood has 0.02 (2%)<br />
chance <strong>of</strong> being exceeded in any year. The term ‘return period’ is actually a misnomer. It does not necessarily<br />
mean that the design storm <strong>of</strong> a 10-year return period will return every 10 years. It could, in fact, never occur,<br />
or occur twice in a single year. It is still considered a 10-year storm.<br />
The study <strong>of</strong> return period is useful for risk analysis (such as the natural, inherent, or hydrological risk <strong>of</strong><br />
failure). For structural design expectations, the return period is useful in calculating the risk to the structure with<br />
respect to a given storm return period given the expected design life. The equation for assessing this risk can<br />
be expressed as:<br />
_ 1 n<br />
n<br />
R = 1−<br />
(1−<br />
) = 1−<br />
(1−<br />
P ( X ≥ xT<br />
))<br />
T<br />
1<br />
where = P ( X ≥ x T<br />
) expresses the probability <strong>of</strong> the occurrence for the hydrological event in question, and<br />
T<br />
n is the expected life <strong>of</strong> the structure in years.<br />
88
Day 3<br />
Box 13: Exercise on flood routing<br />
Example:<br />
The hydrograph at the upstream end <strong>of</strong> a river is given in the following table (Shrestha 2008). The reach<br />
<strong>of</strong> interest is 18 km long. Using a sub-reach length Dx <strong>of</strong> 6 km, determine the hydrograph at the end <strong>of</strong><br />
the reach using the Muskingum-Cunge method. Assume C k<br />
= 2 m/sec, B = 25.3 m, S o<br />
= 0.001 m, and<br />
there is no lateral flow.<br />
Session 13<br />
Time (hour) 0 1 2 3 4 5 6 7 8 9 10 11 12<br />
Flow (m 3 /sec) 10 12 18 28.5 50 78 107 134.5 147 150 146 129 105<br />
Time (hour) 13 14 15 16 17 18 19 20 21 22 23 24<br />
Flow (m 3 /sec) 78 59 45 33 24 17 12 10 10 10 10 10<br />
Solution:<br />
Step 1: Determine K<br />
∆x<br />
6,000<br />
K = = = 3,000 sec<br />
2<br />
c k<br />
Step 2: Determine X<br />
1 Q<br />
X = (1 −<br />
2 BS C<br />
max<br />
∆X<br />
0 k<br />
)<br />
=<br />
1<br />
2<br />
(1 −<br />
150<br />
( 25.3) (0.001) (2) (6000)<br />
)<br />
= 0.253<br />
Step 3: Determine, C 1<br />
, C 2<br />
, and C 3<br />
∆t<br />
− 2KX<br />
3600 − ( 2)( 3000)( 0.253)<br />
C1 =<br />
=<br />
= 0. 26<br />
2K<br />
(1 − X ) + ∆t<br />
( 2)( 3000)( 1 − 0.253) + 3600<br />
C<br />
C<br />
∆t<br />
+ 2KX<br />
2K<br />
(1−<br />
X ) + ∆t<br />
3600 + ( 2)( 3000)( 0.253)<br />
( 2)( 3000)( 1−<br />
0.253) + 3600<br />
2<br />
=<br />
=<br />
=<br />
2K<br />
(1 − X ) − ∆t<br />
2K<br />
(1 − X ) + ∆t<br />
( 2)( 3000)( 1 − 0.253) − 3600<br />
( 2)( 3000)( 1 − 0.253) + 3600<br />
3<br />
=<br />
=<br />
=<br />
0.633<br />
0.109<br />
Here Dt is 1 hour= 3,600 sec. If we want our hydrograph to show a 2-hour interval, then we must take<br />
Dt = 7,200 sec, and so on.<br />
Step 4: Calculate discharge at 6, 12, and 18 km distances.<br />
The initial flow at 0 hours is taken as 10 m 3 /sec at all three locations.<br />
km<br />
The initial flow at 6 km at 0 hours ( Q 6 0<br />
) is 10 m 3 /sec.<br />
The flow at 1 hour at 6 km distance is given by<br />
6km<br />
=<br />
0km<br />
+<br />
0km<br />
+<br />
6km<br />
Q<br />
1<br />
C1Q0<br />
C2Q1<br />
C3Q0<br />
= ( 0.26)( 10) + ( 0.6333)( 12) + ( 0.109)( 10) = 11.3 m 3 /sec<br />
Similarly, the flow at 2 hours at 6 km distance is given by<br />
6km<br />
=<br />
0 km<br />
+<br />
0km<br />
+<br />
6km<br />
=<br />
Q<br />
2<br />
C1<br />
Q<br />
1<br />
C2Q<br />
1<br />
C3Q<br />
1<br />
( 0.26)( 12) + ( 0.633)( 18.0) + ( 0.109)( 18) = 15.7 m 3 /sec<br />
The calculations can be carried out in a similar manner for the remaining part <strong>of</strong> the hydrograph at 6 km<br />
distance for the remaining times.<br />
The flow at 1 hour at 12 km distance is given by<br />
12 km<br />
6km<br />
6km<br />
12 km<br />
Q<br />
( 0.26)( 10) (<br />
1 = C Q0<br />
+ C Q<br />
1 + C Q0<br />
=<br />
+ 0.633)( 10.9) + ( 0.109)( 10) = 10.8 m 3 /sec<br />
1<br />
For further details, see Shrestha (2008).<br />
2<br />
3<br />
89
<strong>Flash</strong> <strong>Flood</strong> <strong>Risk</strong> <strong>Management</strong> – A <strong>Training</strong> <strong>of</strong> <strong>Trainers</strong> Manual<br />
Session 14 Hazard-Specific <strong>Flash</strong><br />
<strong>Flood</strong> <strong>Management</strong>: Landslide Dam<br />
Outburst <strong>Flood</strong>s<br />
Time: 60 minutes<br />
Session 14<br />
Objective<br />
To introduce landslide dam outburst floods (LDOFs) and the measures that can be used to minimise the risks<br />
they pose, including:<br />
XX<br />
Types <strong>of</strong> landslides and the factors that trigger them<br />
XX<br />
Landslide dams and the factors that cause them<br />
XX<br />
How landslide dams fail<br />
XX<br />
Measures that can be used to reduce the risk <strong>of</strong> LDOF<br />
Activities<br />
Activity 14.1: Types <strong>of</strong> landslides and factors that trigger landslides<br />
Time: 15 minutes<br />
Step 1<br />
Step 2<br />
Step 3<br />
Introduce the different types <strong>of</strong> landslides (e.g., fall, topple, slide, spread, and flow).<br />
Discuss what can cause landslides and their triggering factors.<br />
Discuss the causes and effects <strong>of</strong> the different types <strong>of</strong> landslides that can dam rivers.<br />
Activity 14.2: Process <strong>of</strong> landslide damming and factors that can cause<br />
landslide dams<br />
Time: 15 minutes<br />
Step 1<br />
Step 2<br />
Present and explain the process <strong>of</strong> landslide damming. Highlight the characteristics <strong>of</strong> possible<br />
places where landslides can dam a river.<br />
Discuss the factors that can cause a landslide to dam a river. Discuss the different possible<br />
compositions <strong>of</strong> landslide dams and how their composition affects their longevity. Discuss how<br />
landslide dams fail.<br />
Activity 14.3: Case studies <strong>of</strong> landslide dam outburst floods<br />
Time: 5 minutes<br />
Present and discuss landslide dam outburst floods and present the case studies described in RM 14.3. Discuss<br />
the causes <strong>of</strong> landslide dam outbursts.<br />
90
Day 3<br />
Activity 14.4: Measures that can reduce the risk <strong>of</strong> landslide dam outburst<br />
floods<br />
Time: 25 minutes<br />
Present and discuss control measures that can be used to minimise the risk <strong>of</strong> LDOFs. Focus on the following<br />
issues.<br />
Step 1<br />
Landslide hazard assessment. Discuss the methods that can be used to identify places where<br />
hazards can occur such as landslide hazard mapping using GIS. Effective assessments focus on the<br />
places where a landslide is most likely to cause the greatest damage (e.g., narrow river valleys).<br />
Step 2<br />
Step 3<br />
Estimating downstream flooding. Discuss how the magnitude <strong>of</strong> a potential flood caused by a<br />
landslide dam outburst can be estimated in order to implement the appropriate mitigation measures<br />
downstream. (See example in RM 14.4.)<br />
Estimation <strong>of</strong> past floods. Discuss how the extent <strong>of</strong> past floods can be estimated and how this<br />
estimation can be used as the basis for assessing possible future hazard and risk. Review some<br />
flood estimation methods, such as methods to estimate velocity, depth, width, and discharge. (See<br />
examples in RM 14.4.)<br />
Session 14<br />
Step 4<br />
Step 5<br />
Land use regulations. Discuss land use practices particularly in flood prone and landslide prone<br />
areas. Engage the class in a short question and answer session, asking the participants to suggest<br />
some land use regulations that can help to minimise the risk <strong>of</strong> landslide dams.<br />
Early warning systems. Explain how early warning systems can be effective in mitigating the<br />
harmful effects <strong>of</strong> outburst floods, particularly in saving lives and property.<br />
91
<strong>Flash</strong> <strong>Flood</strong> <strong>Risk</strong> <strong>Management</strong> – A <strong>Training</strong> <strong>of</strong> <strong>Trainers</strong> Manual<br />
Session 14 Resource Materials<br />
RM 14.1: Types <strong>of</strong> landslides and factors that can trigger landslides<br />
Landslides usually occur as secondary effects <strong>of</strong> heavy storms, earthquakes, and volcanic eruptions (Box 14).<br />
Landslides can consist <strong>of</strong> either one <strong>of</strong> two classes <strong>of</strong> material: bedrock or soil (earth and organic matter<br />
debris). Landslide are classified by the type <strong>of</strong> movement that causes them, as shown in Figure 15.<br />
Session 14<br />
Falls. A fall is a mass <strong>of</strong> rock or other material that moves downward by falling or cascading through the air.<br />
In this category, large individual boulders can cause significant damage. Depending on the type <strong>of</strong> material<br />
involved, this type <strong>of</strong> landslide can be a rock fall, earth fall, or debris fall.<br />
Topple. A topple occurs when overturning forces cause rocks to rotate out <strong>of</strong> their original position. A topple<br />
may not involve much movement, and does not necessarily trigger a rock fall or rock slide.<br />
Slides. Slides result from shear failure (slippage) along one or several surfaces; the slide material may remain<br />
intact or break up. The two major types are rotational and translational slides. Rotational slides occur on<br />
slopes <strong>of</strong> homogeneous clay or shale and soil, while translational slides are mass movements on a more or<br />
less plane surface.<br />
Lateral spreads. A lateral spread occurs when large blocks <strong>of</strong> soil spread out horizontally after fracturing <strong>of</strong>f<br />
the original base; these usually occur on gentle slopes <strong>of</strong> less than 6° and typically spread only 3 to 5 m, but<br />
may move from 30 to 50 m when conditions are favourable. During an earthquake in Alaska, United States,<br />
in 1964, more than 200 bridges were damaged or destroyed by lateral spreading <strong>of</strong> flood plain deposits<br />
near river channels.<br />
Box 14: Main triggers <strong>of</strong> landslides<br />
Rainfall<br />
Rainfall is an important landslide trigger. There is a direct correlation between the amount <strong>of</strong> rainfall and the<br />
incidence <strong>of</strong> landslides.<br />
• A cumulative rainfall <strong>of</strong> 50–100 mm in one day or a daily rainfall exceeding 50 mm can cause small-scale and<br />
shallow debris landslides.<br />
• A cumulative two-day rainfall <strong>of</strong> about 150 mm or a daily rainfall <strong>of</strong> about 100 mm in a given area greatly<br />
increases the probability and number <strong>of</strong> landslides.<br />
• A cumulative two-day rainfall exceeding 250 mm, or an average intensity <strong>of</strong> more than 8 mm per hour in one<br />
day, rapidly increases the occurrence and number <strong>of</strong> large landslides.<br />
Earthquakes<br />
Earthquakes can cause many large, dam-forming landslides. Seismic accelerations, the duration <strong>of</strong> the shock, the<br />
focal depth, the angle, and the approach <strong>of</strong> the seismic waves all contribute to inducing landslides, but environmental<br />
factors such as the geology and landform are the most decisive factors. This is why small earthquakes can sometimes<br />
induce more landslides than large earthquakes.<br />
The type <strong>of</strong> slope and the slope angle also influence the occurrence <strong>of</strong> landslides. Landslides rarely occur on slopes<br />
with a grade less than 25°. The large majority <strong>of</strong> landslides occur on slopes with grades ranging from 30° to 50°.<br />
Source: Shrestha (2008)<br />
92
Day 3<br />
Figure 15: Types <strong>of</strong> landslides<br />
a. Fall b. Topple c. Slide<br />
Talus<br />
d. Spread<br />
e. Flow<br />
Original Position<br />
Session 14<br />
Moving Mass<br />
Source: Deoja et al. (1991)<br />
Flows. Flows move like a viscous fluid, sometimes very rapidly, and can travel several miles. Water is not<br />
essential for flows to occur, although most flows form after periods <strong>of</strong> heavy rainfall. The different types <strong>of</strong><br />
flow include earth flow, mud flow, debris flow, debris avalanche, and creep. Mud flows contain at least 50%<br />
sand, silt, and clay particles. A debris flow is a slurry <strong>of</strong> soil, rock, and organic matter combined with air and<br />
water. Debris flows usually occur on steep gullies. Creep is a very slow, almost imperceptible flow <strong>of</strong> soil and<br />
bedrock.<br />
Formation and types <strong>of</strong> landslide dams<br />
In general, high landslide dams form in steep-walled, narrow valleys because there is little area for the<br />
landslide mass to spread out (Costa and Schuster 1988). Commonly, large landslide dams are caused by<br />
complex landslides that start as slumps or slides and transform into rock or debris avalanches. Excessive<br />
precipitation and earthquakes are the most important triggers that can initiate landslides that form dams<br />
(Figure 16). Other mechanisms include stream under-cutting and entrenchment.<br />
Landslide dams can be classified geomorphologically according to their orientation relative to the valley floor<br />
(Swanson et al. 1986, in Costa and Schuster 1988) and factors causing their formation (Figure 17,<br />
Table 10).<br />
Modes <strong>of</strong> failure <strong>of</strong> landslide dams and triggering factors<br />
A natural landslide dam differs from a constructed dam in that it is made up <strong>of</strong> a heterogeneous mass <strong>of</strong><br />
unconsolidated or poorly consolidated material and has no proper drainage system to prevent piping and<br />
control pore pressure. It also has no channelised spillway or other protected outlet; as a result, landslide dams<br />
commonly fail by overtopping (Figure 18) (after which the overflow water erodes the dam and breaching<br />
93
<strong>Flash</strong> <strong>Flood</strong> <strong>Risk</strong> <strong>Management</strong> – A <strong>Training</strong> <strong>of</strong> <strong>Trainers</strong> Manual<br />
Figure 16: Formation <strong>of</strong> a natural dam (left) and photograph (right) <strong>of</strong> river damming due to a landslide<br />
Rainfall<br />
Temporary lake<br />
Session 14<br />
Landslide<br />
mass<br />
Photo source: WECS 1987<br />
Figure 17: Types <strong>of</strong> river-damming landslides<br />
Type I Type II Type III<br />
Type IV Type V Type VI<br />
Source: Based on Costa and Schuster (1988)<br />
Table 10: Types <strong>of</strong> landslide dams<br />
Type Cause Effect<br />
I Falls, slumps<br />
Dams are small with respect to the width <strong>of</strong> valley floor and do not<br />
reach from one side to the other<br />
II Avalanches, slumps/slides Dams are larger and span the entire valley floor<br />
III Flows, avalanches<br />
Dams fill the valley from side to side and considerable distances<br />
upstream and downstream<br />
IV Falls, slumps/slides, avalanches<br />
Dams are formed by contemporaneous failure <strong>of</strong> materials from both<br />
sides <strong>of</strong> a valley<br />
V Falls, avalanches, slumps/ slides<br />
Dams are formed when the same landslide has multiple lobes <strong>of</strong><br />
debris that extend across a valley floor at two or more locations<br />
VI Slumps/ slides<br />
Dams are created by one or more surface failures that extend under<br />
the stream or river valley and emerge on the opposite valley<br />
Source: Shrestha (2008)<br />
94
Day 3<br />
occurs). In most documented cases, the breach<br />
results from fluvial erosion <strong>of</strong> the landslide<br />
material; the head cutting typically originates<br />
at the toe <strong>of</strong> the dam and moves progressively<br />
upstream to the lake. When it reaches the lake,<br />
breaching occurs. The breach commonly does<br />
not erode down to the original level <strong>of</strong> the river<br />
bed, as many landslide dams contain some<br />
coarse material that is not swept away. Thus,<br />
smaller lakes can remain after dam failure.<br />
A landslide dams that have steep upstream<br />
and downstream faces and that also have high<br />
pore-water pressure are susceptible to slope<br />
failure. If a dam has a narrow cross-section or<br />
progressive slope failure, the crest may fail,<br />
leading to overtopping and breaching. Nearly<br />
all faces <strong>of</strong> landslide dams are at the angle<br />
<strong>of</strong> repose <strong>of</strong> the material or less; however,<br />
because they are formed dynamically, slope<br />
failures are rare. A special type <strong>of</strong> slope failure<br />
occurs when there is lateral erosion <strong>of</strong> the dam<br />
by a stream or river.<br />
Figure 18: Modes <strong>of</strong> failure <strong>of</strong> landslide dams<br />
% <strong>of</strong> all events<br />
70<br />
60<br />
50<br />
40<br />
30<br />
20<br />
10<br />
0<br />
60<br />
50<br />
Overtopping Piping Slope failure Physically<br />
controlled<br />
(did not fail)<br />
Modes <strong>of</strong> failure<br />
Source: Based on Costa and Schuster (1988)<br />
Figure 19: Causes <strong>of</strong> landslides that form dams<br />
Session 14<br />
RM 14.2: Process <strong>of</strong> landslide<br />
damming and factors that cause<br />
landslide dams<br />
Both natural and anthropogenic factors can<br />
initiate dam-forming landslides. The most<br />
important natural processes are excessive<br />
precipitation (rainfall and snowmelt) and<br />
earthquakes.<br />
Source: Based on Costa and Schuster (1988)<br />
Globally, about 50% <strong>of</strong> dam-forming landslides<br />
are caused by rainstorms and snowmelt, and<br />
about 40% are caused by earthquakes (Figure 19). In the HKH region, volcanic eruptions are rare, so most<br />
landslide dams are caused by rainfall, snowmelt, and earthquakes.<br />
% <strong>of</strong> all events<br />
40<br />
30<br />
20<br />
10<br />
0<br />
Rainstorm<br />
and snowmelt<br />
Earthquakes<br />
Modes <strong>of</strong> failure<br />
Volcanic<br />
eruptions<br />
Others<br />
Landslide dams are frequent in steep, narrow<br />
valleys bordered by high rugged mountains<br />
(Table 11). This setting is widespread in<br />
geologically active areas such as the HKH<br />
where earthquakes are common and mountain<br />
slopes are steepened by glacial activity. Steep,<br />
narrow valleys are dammed by a relatively<br />
small volume <strong>of</strong> material; thus, even small<br />
mass movements can cause landslide dams.<br />
Large landslide dams are caused by complex<br />
landslides that start as slumps <strong>of</strong> slides and<br />
become rock or debris avalanches.<br />
Table 11: Factors causing landslide dams<br />
Natural<br />
Anthropogenic<br />
High relief<br />
Undercutting <strong>of</strong> river banks<br />
Deforestation<br />
Improper land use<br />
Weak geology<br />
High weathering<br />
• agriculture on steep<br />
slopes<br />
• irrigation <strong>of</strong> steep slopes<br />
Intensive rainfall<br />
• overgrazing<br />
High snowmelt<br />
• quarrying<br />
Poor sub-surface drainage<br />
Construction activities<br />
Seismic activities<br />
Source: Shrestha (2008)<br />
95
<strong>Flash</strong> <strong>Flood</strong> <strong>Risk</strong> <strong>Management</strong> – A <strong>Training</strong> <strong>of</strong> <strong>Trainers</strong> Manual<br />
Figure 20: a) Bhairabkunda Khola a few days after the LDOF; b) debris deposited by the LDOF;<br />
c) large boulders trapped at the highway bridge; d) Larcha village destroyed by the flash flood<br />
a<br />
b<br />
Session 14<br />
c<br />
d<br />
Source: NR Khanal<br />
RM 14.3: Case studies <strong>of</strong> landslide dam outburst floods<br />
Case 1: The Budhi Gandaki and Larcha Khola landslide dam outburst flood<br />
In recent memory, the Budhi Gandaki River in Nepal was twice dammed near Lukubesi (Shrestha et al.<br />
2008). In 1967, the river was dammed for three days after slope failure at Tarebhir. Another landslide in<br />
1968 again dammed the river with a huge amount <strong>of</strong> displaced material. After the landslide dam was<br />
breached, the water level rose by 14.61 m. The peak flow was estimated to be 5,210 m 3 /sec, which is<br />
significantly higher than the mean annual instantaneous flood (2,380 m 3 /sec). After the breach, one bridge<br />
and 24 houses were swept away at Arughat Bazaar which is located about 22 km downstream from the<br />
damming site (Figure 20).<br />
The Bhairabkunda Khola (river) was dammed in 1996. The subsequent landslide dam outburst flood<br />
destroyed 22 houses and killed 54 people in Larcha village. The highway bridge was swept away by the<br />
flash flood.<br />
Case 2: The Tsatichhu landslide dam outburst flood<br />
Another example <strong>of</strong> an LDOF in the HKH region is the Tsatichhu LDOF in Bhutan (Shrestha et al. 2008)<br />
(Figure 21). On 10 September 2003, material with an estimated volume <strong>of</strong> 7–12 x 10 6 m 3 failed on the<br />
wall <strong>of</strong> a valley and slid into the Tsatichhu River. The tremor cause by the landslide was felt as far away as<br />
Ladrong village some 2.5 km away. According to the inhabitants <strong>of</strong> nearby areas, the main slide occurred<br />
over a period <strong>of</strong> 30 minutes. The slide formed a river-blocking dam 110 m high. The deposited material<br />
had an estimated volume <strong>of</strong> 10–15 x 10 6 m 3 . The dam crest extended approximately 580 m across the<br />
valley (Dunning et al. 2006), and the deposited material spread a distance <strong>of</strong> 200 m upstream and 700 m<br />
downstream.<br />
96
Day 3<br />
Figure 21: Tsatichhu landslide dam: a) the area at the source <strong>of</strong> the landslide;<br />
b) detailed view <strong>of</strong> the dam; c) Tsatichhu Lake<br />
a<br />
Session 14<br />
b<br />
c<br />
Source: Dunning et al. (2006)<br />
97
<strong>Flash</strong> <strong>Flood</strong> <strong>Risk</strong> <strong>Management</strong> – A <strong>Training</strong> <strong>of</strong> <strong>Trainers</strong> Manual<br />
The landslide dammed the Tsatichhu river and formed a lake which was temporarily known as Tsatichhu lake.<br />
The lake extended 1 km up-valley, and had an estimated volume <strong>of</strong> 4–7 x 10 6 m 3 at its maximum level.<br />
A small surface outflow occurred in December 2003, but did not cause the dam to fail. There was also<br />
significant seepage through the dam, which together with the surface outflow maintained an equilibrium with<br />
the river inflow <strong>of</strong> 0.53 m 3 /sec.<br />
Session 14<br />
The dam survived for 10 months, then in May 2004, heavy rainfall caused some material from the<br />
downstream face <strong>of</strong> the dam to fail, but did not cause a major failure. On 10 July 2004, after a period<br />
<strong>of</strong> prolonged intense rainfall, the dam failed. The dam failed mainly due to a combination <strong>of</strong> downstream<br />
slope failure and overtopping. The failure caused an enormous flood downstream. Since 10 months elapsed<br />
between the formation and the failure <strong>of</strong> the dam, the Department <strong>of</strong> Energy had sufficient time to put early<br />
warning systems in place. Timely warnings saved the downstream hydropower plant. The water level in<br />
the reservoir was pre-lowered; this enabled it to cater to the flood with only minor damage to the main<br />
infrastructure. This LDOF did not result in any human casualties, but the loss <strong>of</strong> agricultural land was significant<br />
(Xu et al. 2006).<br />
RM 14.4: Measures that can reduce the risk <strong>of</strong> landslide dam<br />
outburst floods<br />
Control measures, such as the construction <strong>of</strong> spillways to drain the impounded water, have been attempted<br />
in various places around the world. Sometimes these measures are successful in preventing LDOFs, but at<br />
other times overtopping occurs before satisfactory control measures can be constructed. In some cases,<br />
constructions for structural mitigation can themselves trigger floods that can cause large-scale causalities. This<br />
manual focuses on non-structural measures to mitigate LDOFs.<br />
Landslide hazard assessment<br />
The first step in LDOF mitigation is to identify places where the hazard can occur. This identification can take<br />
place by preparing a landslide hazard map. A landslide in a narrow valley close to a stream can potentially<br />
cause a lake-forming dam. Additional analysis can be used to estimate <strong>of</strong> the volume <strong>of</strong> the dam, which<br />
together with the stream inflow rate, can give an indication <strong>of</strong> the rate at which a dammed lake could rise.<br />
Hazard and risk mapping can be accomplished using any one or a combination <strong>of</strong> the following methods.<br />
• Simple qualitative methods are based on experience and use an applied geomorphic approach to<br />
determine parameters, their weightings, and scores; overlays <strong>of</strong> parameter maps are used for prefeasibility<br />
level studies.<br />
• Statistical methods score the different parameters based on bivariate and multivariate statistical analysis.<br />
• Deterministic methods are based on the properties <strong>of</strong> materials.<br />
• Social mapping methods use information derived from discussions with people familiar with the area and<br />
make use <strong>of</strong> their local knowledge, experiences, and feelings.<br />
The potential hazard may be classified as relative (by assigning ratings to the different factors that can<br />
contribute to the hazard), absolute (by deterministically deriving factors, e.g., factor <strong>of</strong> safety), or monitored<br />
(by making actual measurements such as the deformation <strong>of</strong> roads or other structures).<br />
To assess relative hazard, these steps are generally followed:<br />
• Determine the different factors that can contribute to slope instability.<br />
• Develop a rating scheme to score the probability <strong>of</strong> a hazard.<br />
• Identify and quantify elements at risk.<br />
• Develop a rating scheme and scores for damage potential.<br />
• Construct a hazard and risk matrix.<br />
• Map the hazard and risk.<br />
98
Day 3<br />
Estimating downstream flooding<br />
Informed estimates <strong>of</strong> the magnitude <strong>of</strong> a potential flood are necessary in order to implement mitigation<br />
measures in downstream areas. When the time between the dam formation and the outburst is short, a<br />
detailed analysis may not be possible and estimates need to rely on simple techniques.<br />
Costa and Schuster (1988) suggest the following regression equation to estimate the peak discharge <strong>of</strong> a<br />
LDOF:<br />
Q = 0.0158P e<br />
0.41<br />
where Q is peak discharge in cubic metre per second, and P e<br />
is the potential energy in joules.<br />
P e<br />
is the potential energy <strong>of</strong> the lake water behind the dam prior to the failure and can be calculated using<br />
the following equation:<br />
Session 14<br />
P e<br />
= H d<br />
x V x g<br />
where H d<br />
the height <strong>of</strong> the dam in metres, V is the volume <strong>of</strong> the stored water, and g is the specific weight <strong>of</strong><br />
water (9810 Newton/m 3 ).<br />
Mizuyama et al. (2006) suggest the following equation for calculating peak discharge:<br />
Q = 0. 542<br />
⎪⎧<br />
⎨<br />
⎪⎩<br />
3<br />
( gh )<br />
tan θ x q<br />
0.5<br />
in<br />
3<br />
x10<br />
⎪⎫<br />
⎬<br />
⎪⎭<br />
0.565<br />
x<br />
q<br />
in<br />
10<br />
x B<br />
6<br />
where Q is the peak discharge in m 3 /sec; q in<br />
the inflow into the lake in cm 3 /sec; g the gravitational<br />
acceleration (about 9.8 m/sec 2 ); h the dam height (in metres); and θ the stream-bed gradient.<br />
Figure 22 shows a schematic diagram <strong>of</strong> the input parameters for the calculation <strong>of</strong> peak outflow. The<br />
methods <strong>of</strong> Costa and Schuster (1988) and Mizuyama et al. (2006) give entirely different results as they use<br />
different parameters; the second method uses more parameters than the first.<br />
Sophisticated computer models can estimate the peak outflow <strong>of</strong> the LDOF and predict the route <strong>of</strong> the flood<br />
along the river reach downstream <strong>of</strong> the lake. These models can also predict the area and level <strong>of</strong> flooding,<br />
and can help in making decisions regarding relocating people or implementing structural mitigation measures.<br />
Estimation <strong>of</strong> past floods<br />
Estimation <strong>of</strong> past floods provides an idea <strong>of</strong> the magnitude <strong>of</strong> flood that is likely to affect the location.<br />
The slope-area method for estimating the magnitude <strong>of</strong> past floods is described above. Paleohydraulic<br />
reconstruction techniques can also provide estimates <strong>of</strong> past floods. These techniques reconstruct the velocity<br />
<strong>of</strong> the flow and the depth and width <strong>of</strong> the channel during the flood based on the size <strong>of</strong> the boulders<br />
deposited by the flood. Details are given in Costa (1983). These estimates provide a basis for identifying the<br />
magnitude <strong>of</strong> a past floods and for assessing potential future hazard and risk.<br />
The following steps are used to estimate the magnitude <strong>of</strong> past floods:<br />
Step 1: Velocity calculation. Several equations have been developed for calculating the mean velocity <strong>of</strong><br />
flow (v) <strong>of</strong> past floods in m/sec based on the size <strong>of</strong> boulders deposited. Here we present some <strong>of</strong> the more<br />
commonly cited ones. In all three, d is the diameter <strong>of</strong> the boulder in millimetres.<br />
99
<strong>Flash</strong> <strong>Flood</strong> <strong>Risk</strong> <strong>Management</strong> – A <strong>Training</strong> <strong>of</strong> <strong>Trainers</strong> Manual<br />
Figure 22: Schematic diagram showing the parameters used in calculating peak flow discharge:<br />
a) Isometric view; b) Cross-section view<br />
a<br />
Session 14<br />
q in<br />
B<br />
b<br />
q in<br />
h<br />
Θ<br />
Source: Shrestha (2008)<br />
Mavis and Laushey (1949) calculate the velocity <strong>of</strong> bed flow, V b<br />
, in ft/sec as<br />
Vb<br />
4<br />
=<br />
9<br />
g<br />
1<br />
0.5d<br />
( S −1) 2<br />
where S g<br />
is the specific gravity <strong>of</strong> the boulder. The mean velocity, v , is then calculated as<br />
_<br />
1<br />
V = V<br />
3 b<br />
100
Day 3<br />
Strand (1977) uses the same equation for mean velocity, but calculates the velocity <strong>of</strong> bed flow, V b<br />
again in<br />
ft/sec), as<br />
1<br />
2<br />
V b<br />
= 0.51d<br />
Williams (1983) suggests that<br />
V = 0.065d 0.5<br />
Step 2: Depth calculation. The next step is to calculate the mean depth <strong>of</strong> the flow. Several methods are<br />
available for calculating the mean depth (D).<br />
Manning’s equation proposes<br />
_<br />
_<br />
D = ( V<br />
n<br />
√S<br />
)<br />
1.5<br />
Session 14<br />
where D is mean depth, V is mean velocity, n is the roughness coefficient, and S is the slope.<br />
Sheild (1936) suggests<br />
_<br />
D =θd ( γ S −γ<br />
)/<br />
S<br />
f<br />
where θ is dimensionless shear stress (use 0.02), g f<br />
= 1,070 kg/m 3 , g s<br />
= 2,700 kg/m 3 , and S is the slope.<br />
Williams (1983) suggests<br />
_<br />
τ/<br />
D = γ f S<br />
τ = 0.17d 1.0<br />
where t is the shear stress (N/m²),d is the boulder diameter (mm), g is the specific weight <strong>of</strong> water, and S is<br />
the slope<br />
Step 3: Width calculation. The width is determined using an iterative method. For the cross-section, a straight<br />
reach (neither expanding nor contracting) is selected. The site should not be abnormally wide, narrow, steep,<br />
or flat. At least one, and preferably both, valley walls should be bedrock. The site should be close to the site<br />
where the deposition took place. At least two cross-sections are selected, these should be spaced about one<br />
valley width apart. No major tributaries should enter the main channel between the cross-sections.<br />
Once the cross-sections have been plotted, a line is drawn to represent the estimated top width <strong>of</strong> the cross<br />
section. The area <strong>of</strong> the cross-section is calculated using a planimeter; then the area is divided by the top<br />
width <strong>of</strong> the cross-section. If the value calculated in this way deviates from the estimated depth calculated in<br />
Step 2, the process is repeated by drawing a new top-width line and recalculating; the process is repeated<br />
until the two values agree. The cross-sectional area ‘A’ for the final top-width is then calculated.<br />
Calculation <strong>of</strong> discharge. Knowing the average velocity from Step 1 and the cross-sectional area from Steps<br />
2 and 3, a single discrete estimate <strong>of</strong> flood discharge (Q) can be made using the equation:<br />
Q = V x A<br />
Land use regulations<br />
The increasing hazard and risk <strong>of</strong> LDOFs are a result <strong>of</strong> the unregulated use <strong>of</strong> land and the use <strong>of</strong> flood<br />
prone areas for infrastructure development such as buildings and roads. Regulations that encourage the<br />
proper use <strong>of</strong> land can help to prevent flood prone areas from being used for settlements or as sites for<br />
101
<strong>Flash</strong> <strong>Flood</strong> <strong>Risk</strong> <strong>Management</strong> – A <strong>Training</strong> <strong>of</strong> <strong>Trainers</strong> Manual<br />
important structures. Regulations may also involve relocating people or infrastructure away from hazardous<br />
areas, particularly if alternative sites exist. Restrictions can be placed on the type and number <strong>of</strong> buildings that<br />
can be erected in high-risk areas. Similarly, activities that might activate a landslide can be restricted to take<br />
place away from avalanche prone areas. Restrictions can be implemented through measures such as policy<br />
and building codes.<br />
Early warning systems<br />
Session 14<br />
An early warning system can be an effective measure to mitigate the impacts <strong>of</strong> LDOFs, particularly in saving<br />
lives and property. Depending on the situation, a variety <strong>of</strong> systems can be implemented. In many cases,<br />
the best option is to implement a community-based early warning system. This may consist <strong>of</strong> people placed<br />
at strategic locations from the dam site to the greatest distance downstream where an LDOF could have an<br />
impact. Each person should have visual contact with the person just upstream and downstream. An early<br />
warning system is part <strong>of</strong> a monitoring, warning, and response system (MWRS).<br />
102
Day 4<br />
Session/Activity<br />
Session 15: Country Presentations<br />
Activity time<br />
(minutes)<br />
Cumulative time<br />
<strong>of</strong> session<br />
Session 16: Hazard-Specific <strong>Flash</strong> <strong>Flood</strong> <strong>Management</strong>: Glacial Lake Outburst <strong>Flood</strong>s<br />
16.1 Glaciers, formation <strong>of</strong> glacial lakes, and the glacial landforms 10 10<br />
16.2 Causes <strong>of</strong> glacial lake dam failure 10 20<br />
16.3 Impacts <strong>of</strong> GLOF events 10 30<br />
16.4 Measures to minimise GLOF risk 30 60<br />
16.5 Briefing for the field trip 30 30
<strong>Flash</strong> <strong>Flood</strong> <strong>Risk</strong> <strong>Management</strong> – A <strong>Training</strong> <strong>of</strong> <strong>Trainers</strong> Manual<br />
Session 15 Country Presentations<br />
Objective<br />
To give the participants an opportunity to share their experiences and knowledge on various activities for flash<br />
flood risk management<br />
Activities<br />
Ask the participants to give a short presentation on any aspect <strong>of</strong> flash flood risk management from their own<br />
country.<br />
Session 15<br />
A little preparation can help to make this activity a good success.<br />
Make sure that you advise the participants well ahead <strong>of</strong> time,<br />
possibly in the course requirements or even on the first day <strong>of</strong><br />
the course, that they will have to make a presentation on Day 4.<br />
Advising the participants ahead <strong>of</strong> time will give them plenty <strong>of</strong><br />
time to work on their presentations and to gather any materials<br />
that are required such as photos and documentation. When and<br />
as appropriate, encourage them to show how they are already<br />
using some <strong>of</strong> the concepts that they have learned in the first<br />
three days <strong>of</strong> the course.<br />
Suggestions for the<br />
facilitator – planning<br />
ahead<br />
The presentations can consist <strong>of</strong> a PowerPoint, a short video, or<br />
both. Be specific about how long the presentation should be; this<br />
will depend on the scheduling and the size <strong>of</strong> the class, but on<br />
average, country presentations are 30 minutes: 20 minutes for<br />
the presentation and 10 minutes for discussion.<br />
There must be, at least one presentation from each country. If<br />
there are several participants from the same country they can<br />
join up for a team presentation, and if there are very many from<br />
the same country then different teams can each choose an aspect<br />
that they would like to elaborate.<br />
The day before, collect the titles <strong>of</strong> the presentations and the<br />
names <strong>of</strong> the presenters and make a short list – this will make it<br />
easier to introduce them. Make sure that any audio-visual backup<br />
that is need is available. Introduce the country presentation in<br />
alphabetical order by country and ask participants to present<br />
accordingly. If the facilitator feels that it is appropriate, the<br />
country presentations can be shared among the participants<br />
at the end <strong>of</strong> the training. In this case, decide what is the<br />
most appropriate medium for sharing the information (e.g.,<br />
photocopies, CDs) and prepare the required number <strong>of</strong> copies.<br />
104
Day 4<br />
Session 16 Hazard-Specific <strong>Flash</strong> <strong>Flood</strong><br />
<strong>Management</strong>: Glacial Lake Outburst <strong>Flood</strong>s<br />
Time: 60 minutes<br />
Objective<br />
To introduce glacial lake outburst floods (GLOFs) and the measures that can be taken to minimise the risk they<br />
pose, including:<br />
XX<br />
The glacial landscape, glaciers, and the formation <strong>of</strong> glacial lakes<br />
XX<br />
Causes <strong>of</strong> glacial lake dam failure<br />
XX<br />
How to determine which glacial lakes are potentially dangerous<br />
XX<br />
The potential impacts <strong>of</strong> GLOFs<br />
XX<br />
Measures that can be used to minimise the risks posed by GLOFs<br />
Activities<br />
Activity 16.1: Glaciers, formation <strong>of</strong> glacial lakes, and the glacial<br />
landforms<br />
Time: 10 minutes<br />
Present the salient features <strong>of</strong> glaciers, how glacial lakes are formed, and the characteristics <strong>of</strong> the glacial<br />
landscape such as moraine, terminus, talus slope, ice cliff, crevasse, dead ice, and supra glacial lakes.<br />
Activity 16.2: Causes <strong>of</strong> glacial lake dam failure<br />
Time: 10 minutes<br />
Step 1<br />
Present the causes <strong>of</strong> glacial lake dam failure. Differentiate between moraine dam failure and ice<br />
dam failure.<br />
session 16<br />
Step 2<br />
Discuss the methods used to determine whether a glacial lake is potentially dangerous.<br />
Activity 16.3: Impacts <strong>of</strong> GLOF events<br />
Time: 10 minutes<br />
Discuss the possible impacts <strong>of</strong> GLOF events. Give examples from documented recent GLOF events such as,<br />
for example, the Dig Tsho GLOF <strong>of</strong> 4 August 1985.<br />
Activity 16.4: Measures to minimise GLOF risk<br />
Time: 30 minutes<br />
Discuss the control measures that can be used to minimise the risk <strong>of</strong> GLOFs.<br />
Step 1<br />
Highlight the methods that can be used to prepare an inventory <strong>of</strong> glaciers and glacial lakes, for<br />
early recognition <strong>of</strong> risk.<br />
105
<strong>Flash</strong> <strong>Flood</strong> <strong>Risk</strong> <strong>Management</strong> – A <strong>Training</strong> <strong>of</strong> <strong>Trainers</strong> Manual<br />
Step 2<br />
Step 3<br />
Step 4<br />
Describe the empirical scoring system for moraine-dammed glacial lake outburst hazard.<br />
Discuss the methods that can be used to estimate the magnitude <strong>of</strong> a potential flood in order to<br />
estimate downstream flooding and implement appropriate mitigation measures downstream.<br />
Discuss GLOF risk mapping. Explain how estimating the magnitude <strong>of</strong> past floods can be used as a<br />
basis for preparing for future hazard and risk. Discuss the methods that can be used to calculate the<br />
parameters <strong>of</strong> past floods such as velocity, depth, width, and discharge.<br />
Note to the<br />
trainer<br />
Remember to briefly remind the class that measures such as landuse<br />
regulations and early warning systems, which were covered<br />
in previous sessions, also apply in the case <strong>of</strong> GLOFS.<br />
session 16<br />
106
Day 4<br />
Session 16 Resource Materials<br />
RM 16.1: Glaciers and formation <strong>of</strong> glacial lakes<br />
Glaciers<br />
A glacier is a huge mass <strong>of</strong> flowing ice. Since in any given year, more snow falls than melts, snow layers pile<br />
up year after year and are compressed under their own weight. As the compression progresses the density<br />
increases and the compacted layer, now called ice, becomes impermeable to air. The density <strong>of</strong> ice ranges<br />
from 0.83 to 0.917 g/cm 3 . When the thickness <strong>of</strong> the snow and ice exceeds a certain critical value, the ice<br />
mass <strong>of</strong> the lower layers undergoes a plastic deformation, flows down to a lower elevation, and becomes<br />
thinner.<br />
Moraine<br />
The debris from both sides <strong>of</strong> the steep slope settles on the glacier surface and is carried downslope. The<br />
debris that piles up on both sides and at the end <strong>of</strong> the glacier are known as moraines. ‘Terminal’ or ‘end<br />
moraines’ are formed at the foot or terminal end <strong>of</strong> a glacier. Lateral moraines are formed on the sides <strong>of</strong> the<br />
glacier. Medial moraines are formed when two different glaciers, flowing in the same direction, coalesce and<br />
the lateral moraines <strong>of</strong> each combine to form a moraine in the middle <strong>of</strong> the merged glacier. Less apparent<br />
is the ground moraine, also called glacial drift, which blankets the underneath surface <strong>of</strong> much <strong>of</strong> the glacier<br />
below the equilibrium line (the imaginary line separating areas <strong>of</strong> positive and negative mass balance).<br />
Glacial lakes<br />
Glacial lakes (Figures 23 and 24) are the ponds which form when glaciers melt; they are usually found<br />
near the ends <strong>of</strong> glaciers. Since the structure <strong>of</strong> these lakes is not consolidated, they can be unstable. These<br />
lakes are created when glaciers surge; they can broadly be classified into three categories based on the<br />
composition <strong>of</strong> the dam:<br />
• moraine dammed lakes;<br />
• glacial ice-dammed lakes;<br />
• ice-core moraine dammed lakes.<br />
session 16<br />
Most <strong>of</strong> the glacial lakes in the HKH are moraine dammed. When the glacial dams break, huge amounts<br />
<strong>of</strong> water from the glacial lake are released downstream in a sharp flood wave. This flood wave is usually<br />
released with so much force that it can wash away infrastructure found along the river banks. This destructive<br />
flood is known as a glacial lake outburst flood (GLOF).<br />
The formation <strong>of</strong> glacial lakes<br />
The formation and growth <strong>of</strong> glacial lakes is closely related to deglaciation. Shrinkage <strong>of</strong> glaciers is a<br />
widespread phenomenon in the HKH region at present and is closely associated with climate change. The<br />
glacial retreat that has been observed in recent decades is generally attributed to an anthropogenic increase<br />
in the concentration <strong>of</strong> greenhouse gasses in the atmosphere and the overall warming that is attributed to it.<br />
Valley glaciers are typically dotted with supra-glacial ponds; in a warming environment these grow bigger<br />
and merge with each other. This process is accelerated by the rapid retreat <strong>of</strong> glaciers. As glaciers retreat,<br />
they leave large voids behind, and the melt water that is trapped in these depressions forms lakes. Figure 25<br />
shows the rapid growth <strong>of</strong> the Tsho Rolpa Lake in Nepal as an example.<br />
107
<strong>Flash</strong> <strong>Flood</strong> <strong>Risk</strong> <strong>Management</strong> – A <strong>Training</strong> <strong>of</strong> <strong>Trainers</strong> Manual<br />
Figure 23: Types <strong>of</strong> glacial lakes<br />
I/Ig<br />
I/C<br />
I/B<br />
S<br />
M<br />
I/B<br />
I/Mg<br />
I<br />
Symbol<br />
I<br />
M<br />
S<br />
B<br />
C<br />
Ig<br />
Mg<br />
Type <strong>of</strong> Lake<br />
Ice-dammed lake<br />
Moraine-dammed lake<br />
Supraglacial lake<br />
Lake dammed by tributary glacier (blocked lake)<br />
Converging ice ponded<br />
Interglacial ponded<br />
Marginal ponded<br />
Note: Two letter symbol means both apply, (e.g., A/D means ice-dammed lake<br />
with the damming caused by a tributary glacier)<br />
Glacier<br />
Lake<br />
River<br />
River valley<br />
Flow direction<br />
Source: Shrestha (2008)<br />
Figure 24: Schematic view <strong>of</strong> typical glacial lakes found in the HKH: a) end moraine; b) lateral moraine;<br />
c) glacial lake; d) glacier terminus; e) hanging glacier; f) talus slope; g) dead ice<br />
session 16<br />
e<br />
e<br />
d<br />
f<br />
b<br />
c<br />
a<br />
g<br />
b<br />
f<br />
d<br />
f<br />
Source: Shrestha (2008)<br />
108
Day 4<br />
Figure 25: Development <strong>of</strong> the Tsho Rolpa glacial lake<br />
1957–59<br />
1975–77<br />
1994<br />
0.23 km 2<br />
0.80 km 2<br />
1.39 km 2<br />
0.78 km 2 1.27 km 2<br />
1960–68<br />
1979<br />
1997<br />
0.61 km 2<br />
1.02 km 2<br />
1.65 km 2<br />
1972<br />
1983–84<br />
2002<br />
0.62 km 2<br />
1.16 km 2<br />
1.76 km 2<br />
1974<br />
1988–90<br />
0 1 2 3 km<br />
Source: Shrestha (2008)<br />
RM 16.2: Causes <strong>of</strong> glacial lake dam failure<br />
Moraine dam failure<br />
Moraine dams can be breached in a number <strong>of</strong> ways, the mechanisms <strong>of</strong> dam failure can be classified into<br />
two broad categories:<br />
• breaches caused by the erosion <strong>of</strong> dam material;<br />
• breaches caused by the sudden collapse <strong>of</strong> a portion <strong>of</strong> the dam (as in the case <strong>of</strong> earthquakes or geotechnical<br />
failures, for example).<br />
session 16<br />
A moraine dam may collapse as a result <strong>of</strong> some external trigger or because <strong>of</strong> internal failure. A huge<br />
displacement wave can cause the water to overtop the moraine; the displacement wave can be caused by a<br />
rockslide or by an avalanche <strong>of</strong> snow or ice from the glacier terminus or by hanging glaciers falling into the<br />
lake. The displacement wave can cause a large breach that leads to dam failure (Ives 1986).<br />
The types <strong>of</strong> failure caused by erosion <strong>of</strong> the terminal moraine can be further classified as caused by:<br />
• overtopping <strong>of</strong> the dam due to a progressive rise in the lake level or by creation <strong>of</strong> a surface wave by a<br />
landslide, a rock fall, an icefall, ice calving, or wind waves;<br />
• piping through the dam material;<br />
• intensive rain which rapidly fills up the lake and eventually overtops or pipes through the moraine.<br />
Richardson and Reynolds (2000) analysed 26 GLOF events in the Himalayas in the twentieth century<br />
and concluded that a majority <strong>of</strong> the moraine dam failures were triggered by overtopping usually as a<br />
consequence <strong>of</strong> a displacement wave triggered by ice avalanches into the lake from hanging or calving<br />
glaciers.<br />
109
<strong>Flash</strong> <strong>Flood</strong> <strong>Risk</strong> <strong>Management</strong> – A <strong>Training</strong> <strong>of</strong> <strong>Trainers</strong> Manual<br />
Ice-dam failure<br />
Ice is the s<strong>of</strong>test type <strong>of</strong> rock and, in the conditions found in the Himalayas, it is also usually very close to its<br />
melting point. Ice-dammed lakes are mechanically very unstable, since the ice dams can be compromised by:<br />
• flotation <strong>of</strong> the ice dam;<br />
• pressure deformation;<br />
• melting <strong>of</strong> a tunnel through or under the ice; and<br />
• drainage associated with tectonic activity.<br />
Methods to determine whether glacial lakes are potentially dangerous<br />
Methods to determine whether a glacial lake is potentially dangerous or not, can range from simple deskbased<br />
investigations to complicated methods, involving highly specialised field tests. In general, potentially<br />
dangerous lakes can be identified based on the following:<br />
Volume and rise in the water level <strong>of</strong> the lake. An outburst <strong>of</strong> a relatively small lake may not have a significant<br />
impact. Lakes smaller than 0.01 km 3 in volume are not considered potentially dangerous. The dynamics <strong>of</strong> the<br />
water level are also important, since an increase in the water level increases the hydrostatic pressure on the<br />
moraine dam and may cause it to collapse.<br />
Activity <strong>of</strong> a glacial lake. Rapidly increasing lake size indicates the high probability <strong>of</strong> a GLOF. Similarly,<br />
when the lake boundary and outlet position are dynamic, high risk is also indicated.<br />
Position <strong>of</strong> the lake. Potentially dangerous lakes are generally located at the lower end <strong>of</strong> the ablation area<br />
<strong>of</strong> the glacier near the end moraine. Only when the parent glacier is sufficiently massive can it give rise to<br />
lakes that are large enough to be dangerous. Large lakes should be regularly monitored with the help <strong>of</strong> multitemporal<br />
satellite imaging and field investigations.<br />
session 16<br />
Condition <strong>of</strong> the moraine dam. The condition <strong>of</strong> the moraine damming the lake determines how stable the<br />
lake is. The possibility <strong>of</strong> outburst due to collapse <strong>of</strong> the moraine dam increases if:<br />
• the dam has a narrow crest area;<br />
• the dam has steep slopes;<br />
• the dam is ice cored;<br />
• the dam is located high above the valley floor;<br />
• there are instabilities in the slopes <strong>of</strong> the dam;<br />
• there is seepage through the moraine dam.<br />
Condition <strong>of</strong> parent glacier and glaciers on the periphery. The terminus <strong>of</strong> the parent glacier (that is in<br />
contact with the lake) can experience calving due to the development <strong>of</strong> thermokarsts on the lower part <strong>of</strong> the<br />
terminus and exploitation <strong>of</strong> crevasses on the glacier. When a large fragment <strong>of</strong> ice drops from this terminus<br />
drops into the lake, it can cause a displacement wave that has sufficient intensity to travel across the lake<br />
and cause water to overtop the moraine dam. Similarly, when the parent glacier presents at a steep angle or<br />
when it is located on a side valley it can cause ice avalanches into a lake. Such ice avalanches can cause<br />
displacement waves capable <strong>of</strong> overtopping moraine dams.<br />
Physical condition <strong>of</strong> the surroundings. When the mountain slopes around the lake are unstable, there is<br />
always a possibility <strong>of</strong> mass movements and snow avalanches, both <strong>of</strong> which can cause displacement waves<br />
that can overtop the moraine dams. Smaller lakes located at high altitudes can also sometimes pose a danger<br />
to a glacial lake located at a lower altitudes. When the high altitude lakes outburst they can drain into the<br />
lower altitude ones and the additional water can cause overtopping and consequent failure <strong>of</strong> the moraine<br />
dam.<br />
110
Day 4<br />
RM 16.3: Impacts <strong>of</strong> GLOF events<br />
There have been at least 35 recorded GLOF events in the HKH region: 16 in China, 15 in Nepal, and 4<br />
in Bhutan; and there have been some reports <strong>of</strong> floods <strong>of</strong> glacial origin in India and Pakistan. Many <strong>of</strong> the<br />
GLOFs in China occurred in the southern part <strong>of</strong> the Tibetan Plateau, where rivers drain into Nepal. One <strong>of</strong><br />
the most remarkable GLOF events was the Zhangzanbo lake GLOF <strong>of</strong> 11 July 1981. The lake burst because<br />
<strong>of</strong> a sudden ice avalanche which caused a large wave, and a 50 m deep and 40–60 m wide breach<br />
formed in the moraine. This GLOF created a great change in the landforms downstream by erosion and<br />
sedimentation, and caused considerable damage to the highway below the lake up to the Sunkoshi power<br />
station. It destroyed the Friendship Bridge between Nepal and China and two other bridges, one in Tibet<br />
and one in Nepal. The flood also caused heavy damage to the diversion weir <strong>of</strong> the Sunkoshi hydropower<br />
station.<br />
One <strong>of</strong> the region’s most well documented GLOF events was the Dig Tsho GLOF <strong>of</strong> 4 August 1985. Dig Tsho<br />
Lake is located at the headwaters <strong>of</strong> the Bhotekoshi River in Nepal. The GLOF destroyed the nearly complete<br />
Namche Hydropower Project and the total damage was estimated at US $1.5 million.<br />
RM 16.4: Measures to minimise GLOF risk<br />
Early recognition <strong>of</strong> risk<br />
The most effective way to minimise the risk <strong>of</strong> a GLOF hazard is to be aware <strong>of</strong> the risk early so that<br />
appropriate measures can be taken in a timely and cost-effective manner.<br />
The first step is to prepare an inventory <strong>of</strong> the glaciers and glacial lakes in the region. While preparing the<br />
inventory <strong>of</strong> glacial lakes, parameters that can be derived remotely can be entered as attributes. Then the GIS<br />
s<strong>of</strong>tware can be programmed to screen for potentially dangerous lakes in the area <strong>of</strong> interest.<br />
RGSL (2003) has suggested criteria for defining the GLOF hazard <strong>of</strong> glacial lakes (Table 12), and a<br />
hazard rating based on an empirical score (Table 13). A glacial lake scoring higher than 100 is potentially<br />
dangerous and an outburst can occur at any time. Glacial lakes should be monitored regularly to refine and<br />
update the status <strong>of</strong> the criteria which is listed below.<br />
Table 12: Empirical scoring system for moraine-dammed glacial lake outburst hazard (RGSL 2003)<br />
Criteria affecting hazard/score 0 2 10 50<br />
Volume <strong>of</strong> lake N/A Low Moderate Large<br />
Calving risk from ice cliff N/A Low Moderate Large<br />
Ice/rock avalanche risk N/A Low Moderate Large<br />
Lake level relative to freeboard N/A Low Moderate Full<br />
Seepage evident through dam None Minimal Moderate Large<br />
Ice-cored moraine dam with/without thermokarst features None Minimal Partial >Moderate<br />
Compound risk present None Slight Moderate Large<br />
Supra/englacial drainage None Low Moderate Large<br />
Source: Shrestha (2008)<br />
session 16<br />
Table13: Hazard rating on the basis <strong>of</strong> the<br />
empirical scoring system (RGSL 2003)<br />
0 50 100 125 150+<br />
Zero Minimal Moderate High Very High<br />
An outburst can occur any time<br />
Source: Shrestha (2008)<br />
Volume <strong>of</strong> lake. The volume <strong>of</strong> the lake can be<br />
established by bathymetric surveying for which<br />
there are two common methods. The first is to<br />
measure the depth directly when the lake is<br />
frozen. A grid <strong>of</strong> measurement points is predetermined<br />
and depth sounding measurements<br />
111
<strong>Flash</strong> <strong>Flood</strong> <strong>Risk</strong> <strong>Management</strong> – A <strong>Training</strong> <strong>of</strong> <strong>Trainers</strong> Manual<br />
are made through holes bored through the ice layer at these points. The measurement points are interpolated<br />
to get the total volume <strong>of</strong> the lake. Another method which is recently gaining in popularity uses echo-sounders.<br />
This method can give a relatively dense measurement in a short time. The volume thus derived can be related<br />
to the surface area <strong>of</strong> the lake and after a number <strong>of</strong> measurements the relationship <strong>of</strong> volume to area can be<br />
established.<br />
Calving risk from ice cliffs. The status <strong>of</strong> the terminus <strong>of</strong> the parent glacier should be routinely monitored in<br />
the field. The geometry and size <strong>of</strong> the terminus can give useful information as to whether it will imminently<br />
give rise to large displacement waves. High overhanging ice-cliffs can calve, potentially giving rise to large<br />
displacement waves. A debris or ice apron in front <strong>of</strong> the ice-cliff reduces the chances that it will generate a<br />
large displacement, even when ice calving occurs. Often ice termini have a series <strong>of</strong> crevasses. The terminus<br />
and crevasses can be monitored by time lapse photography. High-resolution satellite imagery can provide<br />
some information on the crevasses, and field surveys can provide information on the height <strong>of</strong> the ice cliff.<br />
Ice/rock avalanche risk. Ice avalanches from hanging glaciers and rock avalanches from weathered slopes<br />
can cascade into lakes where they can cause large displacement waves capable <strong>of</strong> overtopping moraine<br />
dams causing dam failure. Ice and rock avalanche areas have to be monitored regularly for early detection<br />
<strong>of</strong> possible avalanches. This can be done through a combination <strong>of</strong> visual inspection on the ground and<br />
high-resolution satellite imagery. The dynamics <strong>of</strong> the lake water level also have to be observed continuously.<br />
This can be done by establishing a lake water level measuring station. The water level data from the station<br />
can be monitored regularly by a gauge reader, or it can be read automatically using a level pressure sensor<br />
and data logger. The water level observations can be supplemented by discharge measurements, which give<br />
important additional information on the outflow from the lake.<br />
Lake level relative to freeboard. High water level and low freeboard means that even a relatively small<br />
displacement wave can overtop the moraine dam. The dynamics <strong>of</strong> the lake water level have to be<br />
observed continually. This can be done by establishing a lake water level measuring station. The station can<br />
have a simple level gauge monitored regularly by a gauge reader, or an automatic recorder with a water<br />
level pressure sensor and data logger. The water level observation can be supplemented by discharge<br />
measurements, which will give important information on the outflow <strong>of</strong> the lake.<br />
session 16<br />
Seepage evident through dam. Seepage through a moraine dam may indicate that piping is taking place<br />
inside the dam; this is serious since piping is a precursor to dam failure. Seepage can also be due to<br />
rapid melting <strong>of</strong> dead ice inside the moraine dam; this is also serious since it can lead to the formation <strong>of</strong><br />
voids inside the dam which can cause the dam to collapse. The height <strong>of</strong> the seepage outlet and seasonal<br />
fluctuations in the quantity <strong>of</strong> seepage need to be monitored. Seepage due to the infiltration <strong>of</strong> precipitation is<br />
seasonal and does not pose a serious threat to the integrity <strong>of</strong> the dam.<br />
Ice-cored moraine dam with or without thermokarst features. Thermokarsts are voids in the moraine dam<br />
caused by rapid melting <strong>of</strong> buried ice blocks. Thermokarsts reduce the structural stability <strong>of</strong> the moraine dam<br />
and make it more vulnerable to the hydrostatic pressure <strong>of</strong> the lake water. Slumping and subsidence due<br />
to the collapse <strong>of</strong> thermokarst may cause overtopping <strong>of</strong> a moraine dam and lead to its collapse. Features<br />
on the moraine such as slumping and subsidence have to be monitored regularly. Monitoring can be<br />
accomplished visually or by conducting a detailed topographic survey <strong>of</strong> the concerned area. Specialised<br />
techniques such as ground penetrating radar surveys or electro-resistivity surveys give a three-dimensional map<br />
<strong>of</strong> the buried ice.<br />
Compound risk present. This criterion is subjective and is based on visual observations. The risk is based on<br />
the behaviour and characteristics <strong>of</strong> the end and lateral moraines and the lake surroundings. Assessment <strong>of</strong><br />
risk involves consideration <strong>of</strong> deepening and enlargement <strong>of</strong> ponds on the moraines, presence <strong>of</strong> ponds at<br />
higher altitude above the lake, shifting and enlargement <strong>of</strong> outlet channels, etc.<br />
112
Day 4<br />
Supra or englacial drainage. Parent glaciers generally contain several supra-glacial lakes and englacial<br />
channels. Occasionally these ponds drain though englacial channels into the glacial lake. Similarly, lakes at<br />
higher altitude can drain into the glacial lake. If the volume <strong>of</strong> the water released is significant, it might cause<br />
overtopping <strong>of</strong> the moraine dam. Supra-glacial ponds and high altitude lakes need to be monitored regularly.<br />
Satellite images can provide multi-temporal information on the development <strong>of</strong> supra-glacial ponds and high<br />
altitude lakes in the surrounding areas.<br />
Estimation <strong>of</strong> peak outflow discharge<br />
Sophisticated computer models can estimate the peak discharge <strong>of</strong> a GLOF. Due to limited resources and<br />
expertise, it is not always possible to undertake a detailed modelling exercise. Simple methods can also<br />
provide reasonably good estimates <strong>of</strong> the outburst magnitude.<br />
Costa and Schuster (1988) suggest the following equation for predicting peak outflow discharge from a<br />
GLOF:<br />
Q = 0.00013(P e<br />
) 0.60<br />
where Q is peak discharge in m 3 /sec, and P e<br />
is potential energy in joules.<br />
P e<br />
is the energy <strong>of</strong> the lake water behind the dam prior to failure and can be calculated using the equation:<br />
P e<br />
= H d<br />
x V x g<br />
Popov (1991) suggests the following equation be used to predict flash flood peak discharge due to an<br />
outburst:<br />
Q = 0.0048V 0.896<br />
The peak discharge depends on the volume <strong>of</strong> the glacial lake (V). The lake volume is generally not available<br />
unless a detailed bathymetric survey has been previously conducted. The surface area <strong>of</strong> the lake, however,<br />
can be easily derived from maps and satellite imagery. The volume can then be calculated using the<br />
following formula suggested by Huggel et al. (2002):<br />
V = 0.104A 1.42<br />
session 16<br />
The peak outburst depends on the nature <strong>of</strong> the outburst, i.e., the duration <strong>of</strong> the outburst, the nature <strong>of</strong> the<br />
outburst hydrograph, and the size and geometry <strong>of</strong> the dam breach. A simple approach is to assume a<br />
triangular breach hydrograph and to assume that the duration <strong>of</strong> the outburst is 1,000 seconds. Huggel et al.<br />
(2002) suggest that most outbursts last between 1,000 and 2,000 seconds, and that the peak discharge can<br />
be estimated as:<br />
Q =<br />
2V<br />
t<br />
Estimation <strong>of</strong> the area at risk by a GLOF event<br />
The hazard assessment should include a rough estimate <strong>of</strong> the area that can potentially be affected by a<br />
lake outburst. A worst-case scenario is generally assumed for delineating the area that could be affected.<br />
The runout (travel) distance <strong>of</strong> an outburst is related to the amount <strong>of</strong> debris that is mobilised. Outburst floods<br />
with a higher content <strong>of</strong> solid material form debris flows and stop abruptly, whereas GLOFs, that consist<br />
predominantly <strong>of</strong> water attenuate, more gradually. For a rough estimate <strong>of</strong> the maximum area that can be<br />
affected, the peak discharge is used to estimate the overall slope <strong>of</strong> the outburst flood (the average slope<br />
between the starting and the end points <strong>of</strong> an outburst event).<br />
113
<strong>Flash</strong> <strong>Flood</strong> <strong>Risk</strong> <strong>Management</strong> – A <strong>Training</strong> <strong>of</strong> <strong>Trainers</strong> Manual<br />
GLOF risk mapping<br />
GLOF risk mapping is an important tool to help predict the area likely to be impacted by a GLOF, to estimate<br />
the vulnerability <strong>of</strong> those areas, and to help in the planning mitigation measures. Detailed descriptions<br />
<strong>of</strong> GLOF risk mapping can be found in Shrestha et al. (2006) and Bajracharya et al. (2007a, 2007b).<br />
The process involves estimating the discharge hydrograph at the outlet (breach). This can be done using<br />
dam break models or by simple calculations assuming the breach size and the lake drawdown rate. The<br />
hydrograph is routed through the river reach to find the peak discharge and flood height at the locations <strong>of</strong><br />
interest. An inundation map is prepared by overlaying the flood height over the terrain map.
Day 4<br />
Briefing for the Field Trip<br />
Time: 30 minutes<br />
Objectives<br />
To share information about the upcoming field trip, including<br />
XX<br />
the objectives <strong>of</strong> the trip<br />
XX<br />
the list <strong>of</strong> planned activities<br />
XX<br />
practical information<br />
XX<br />
tips on required preparation<br />
Activities<br />
Take some time to properly orient the participants on the upcoming field trip. Make sure to mention the<br />
following.<br />
• Discuss the objectives <strong>of</strong> the field trip.<br />
• Point out each field visit site on a map, and explain how far it is and the route that will be taken.<br />
• Describe the special or unique features <strong>of</strong> each field site and relate these feature to the success or failure<br />
<strong>of</strong> past flash flood risk management activities.<br />
• Describe the activities that the participants are going to observe, and what they are going to do in the<br />
field.<br />
• Go over the logistics <strong>of</strong> the field trip: time <strong>of</strong> departure, time <strong>of</strong> arrival at different places, length <strong>of</strong> stay,<br />
and what is expected at each site.<br />
• Clearly mention any necessary preparation that needs to be made beforehand; list practical items that<br />
may be required: comfortable clothing, shoes for trekking, sun glasses, sun block, insect repellent, and<br />
other items as needed.<br />
Suggestions for<br />
the facilitator<br />
Preparation<br />
A little prior preparation can help to make the field trip a<br />
success. Note the following:<br />
• If at all possible, visit the sites <strong>of</strong> the field trip beforehand.<br />
• Select places where different flood risk management<br />
measures have both been successful and unsuccessful.<br />
• Once you have decided on a location, make sure to advise<br />
the community in-charge and others that you will be working<br />
with that you will be coming and when.<br />
• Prepare a short description <strong>of</strong> the places to be visited,<br />
the events or activities to take place there, and any other<br />
necessary information such as the distance and the time to<br />
get there.<br />
• Give a short presentation in which you describe the different<br />
places that the group will be visiting and point out what floodrelated<br />
points <strong>of</strong> interest need to observe in each place.<br />
• Distribute a copy <strong>of</strong> the short description <strong>of</strong> the locations to<br />
be visited to each participant after the briefing on the field<br />
trip.<br />
session 16<br />
(continues)<br />
115
<strong>Flash</strong> <strong>Flood</strong> <strong>Risk</strong> <strong>Management</strong> – A <strong>Training</strong> <strong>of</strong> <strong>Trainers</strong> Manual<br />
Suggestions for<br />
the facilitator<br />
(continued)<br />
Logistics<br />
The following necessary items for the field trip should be<br />
provided by the facilitator:<br />
• Travel arrangement plans<br />
• Accommodation plans<br />
• Maps printed in large size (e.g., Google maps) and/or<br />
satellite images<br />
• Drawing paper (A1 size) and camera<br />
• Drawing materials such as marker pens, pencils, tape, and<br />
erasers<br />
Remember to advise the local facilitator, if one is needed.<br />
session 16<br />
116
Days 5, 6,<br />
and 7<br />
Field Trip
Day 8<br />
Session/Activity<br />
Activity time<br />
(minutes)<br />
Cumulative time<br />
<strong>of</strong> session<br />
Session 17: Legal and Institutional Issues <strong>of</strong> Integrated <strong>Flood</strong> <strong>Risk</strong> <strong>Management</strong><br />
17.1 Role <strong>of</strong> law in flood risk management 10 10<br />
17.2<br />
17.3<br />
Major legal aspects <strong>of</strong> IFM and institutional arrangements for<br />
flash flood disaster management<br />
International conventions and laws pertaining to flash flood<br />
disaster risk management<br />
40 50<br />
10 60<br />
Session 18: <strong>Flash</strong> <strong>Flood</strong> <strong>Management</strong> Cycle – Preparedness<br />
18.1 Concept and phases <strong>of</strong> the flash flood management cycle 10 10<br />
18.2 Emergency planning activities at community level 15 25<br />
18.3 Community preparedness activities for flash flood management 35 60<br />
Session 19: <strong>Flash</strong> <strong>Flood</strong> <strong>Management</strong> Cycle – Response and Recovery<br />
19.1<br />
Evacuation, search and rescue, shelter management, and<br />
health response<br />
15 15<br />
19.2 Damage and needs assessment 20 35<br />
19.3 Recovery, rehabilitation, and enhancing community resilience 10 45<br />
19.4 Monitoring, evaluation, and information management 15 60<br />
Session 20: Overall Discussion 60 60<br />
Session 21: <strong>Training</strong> Evaluation and Closing Session<br />
21.1 <strong>Training</strong> evaluation 30 30<br />
21.2 Closing session 30 60
<strong>Flash</strong> <strong>Flood</strong> <strong>Risk</strong> <strong>Management</strong> – A <strong>Training</strong> <strong>of</strong> <strong>Trainers</strong> Manual<br />
Session 17 Legal and Institutional Issues<br />
<strong>of</strong> Integrated <strong>Flood</strong> <strong>Risk</strong> <strong>Management</strong><br />
Time: 60 minutes<br />
Objective<br />
To learn about:<br />
XX<br />
Legal aspects <strong>of</strong> integrated flood management<br />
XX<br />
Legal and institutional arrangements for flash flood risk management at different levels and in different<br />
sectors<br />
XX<br />
How international conventions and laws apply to flash flood and disaster risk management<br />
Activities<br />
Activity 17.1: Role <strong>of</strong> law in flood risk management<br />
Time: 10 minutes<br />
Step 1<br />
Step 2<br />
Discuss the role <strong>of</strong> law in integrated flood risk management.<br />
Discuss the need for flash flood risk management policy at the national, provincial, and local levels.<br />
Activity 17.2: Major legal aspects <strong>of</strong> IFM and institutional arrangements<br />
for flash flood disaster management<br />
Time: 40 minutes<br />
Step 1<br />
Step 2<br />
Step 3<br />
State the major legal aspects and briefly explain each.<br />
Urge the participants to become familiar with the existing major policies related to disaster<br />
management in their own countries. As an example, present the legal and institutional arrangements<br />
for disaster risk management for a given country and explain how these pertain to flash flood risk<br />
management.<br />
Discuss the sectors implicated in flash flood risk management and the associated sectoral policies<br />
(see Box 15 in RM 17.2).<br />
session 17<br />
Step 4<br />
Discuss the existing institutional arrangement and note where gaps can arise among national, subnational,<br />
and local levels. It is important to discuss the responsibilities <strong>of</strong> each institution and explain<br />
how (ideally) they should coordinate among themselves for flash flood risk management.<br />
Note to the<br />
trainer<br />
Examine the institutional arrangements and note the vertical<br />
linkages from the local to the national level. At the same time,<br />
note the horizontal linkages in terms <strong>of</strong> the distribution <strong>of</strong><br />
responsibilities and the coordination between different sectors<br />
in areas such as land use, watershed management, and forest<br />
management. How are policy and institutional arrangements<br />
coordinated at the provincial and local level? And how do these<br />
come into play before, during, and after a flood?<br />
120
Day 8<br />
Step 5<br />
Discuss how polices can be reformed to better address the needs <strong>of</strong> poor and vulnerable people in<br />
the context <strong>of</strong> flash floods.<br />
Highlight the importance <strong>of</strong> addressing gender issues in flash flood risk management. Gender issues are<br />
social issues and should be part <strong>of</strong> an overall social protection policy. Social protection is a legal way <strong>of</strong><br />
supporting and protecting the more vulnerable members <strong>of</strong> society.<br />
Activity 17.3: International conventions and laws pertaining to flash flood<br />
disaster risk management<br />
Time: 10 minutes<br />
Step 1<br />
Step 2<br />
Rivers and river basins <strong>of</strong>ten extend over two or more countries in the HKH, this makes flash flood<br />
risk management a transboundary issue. It is <strong>of</strong>ten in the best interest <strong>of</strong> both countries to share<br />
hydrometeorological research and data that can be useful in early warning systems and in different<br />
activities <strong>of</strong> flash flood risk management; however, neighbouring countries can have differing<br />
approaches to sharing data. Country-specific policies to data sharing and river management are<br />
some <strong>of</strong> the challenges in transboundary flash flood risk management.<br />
Mention international laws, convections, and initiatives that are pertinent to flash flood and<br />
transboundary water management. Highlight legal provisions and initiatives that apply in the HKH<br />
region.<br />
session 17<br />
121
<strong>Flash</strong> <strong>Flood</strong> <strong>Risk</strong> <strong>Management</strong> – A <strong>Training</strong> <strong>of</strong> <strong>Trainers</strong> Manual<br />
Session 17 Resource Materials<br />
RM 17.1: Role <strong>of</strong> law in flood management<br />
‘Disaster risk management is the process <strong>of</strong> implementing those policies, institutions and<br />
investments to strengthen the coping capacities <strong>of</strong> society to reduce the impacts <strong>of</strong> natural hazards<br />
and related environmental and technological disasters.’ (UNISDR 2009)<br />
Integrated flood management should be based on a legal framework and supported by solid institutional<br />
arrangements. A legal mechanism is very important because many governmental and non-governmental<br />
organisations at the national, subnational, and local levels are involved in flood management. In this context,<br />
laws work to provide the framework for implementing governmental policies for flood management.<br />
The law has three distinct roles as outlined in Figure 26.<br />
• Law defines institutional roles and responsibilities<br />
• It protects the rights and determines the obligations <strong>of</strong> institutions and individuals.<br />
• If conflicts cannot be avoided, the law provides a mechanism for dispute resolution through the judicial<br />
system.<br />
These legal provisions are essential to ensure that government agencies have specific responsibilities<br />
for addressing aspects <strong>of</strong> flood management and can be held accountable. Laws define the rights and<br />
obligations <strong>of</strong> different institutions and individuals at all stages <strong>of</strong> flood management. Laws are also essential<br />
in giving flood managers the legal powers they need to intervene during a flood event, such as right <strong>of</strong><br />
access to private property.<br />
A legal framework at the national level should address issues related to:<br />
• coordination and cooperation among organisations, institutions, sectors, and beneficiaries;<br />
• availability and accessibility <strong>of</strong> the basic data and information needed for decision making;<br />
• building and enabling a conducive environment for all stakeholders to participate and make collective<br />
decisions.<br />
Figure 26: The role <strong>of</strong> law in IFM<br />
session 17<br />
Stakeholders<br />
Scientists<br />
Policy<br />
Implementation<br />
Water<br />
resource<br />
managers<br />
Law<br />
Defines institutional<br />
roles and responsibilities<br />
Provides mechanisms for<br />
dispute management<br />
Determines and protects<br />
rights and obligations<br />
Source: WMO (2006)<br />
122
Day 8<br />
RM 17.2: Major legal aspects <strong>of</strong> IFM and institutional arrangements<br />
The four major legal aspects <strong>of</strong> integrated flood management are:<br />
• ensuring coordination and integration across institutional boundaries;<br />
• generating and sharing information;<br />
• enabling stakeholder participation;<br />
• ensuring rights, powers, and obligations.<br />
Ensuring coordination and integration across institutional boundaries<br />
Ensuring coordination and integration across<br />
institutional boundaries is one <strong>of</strong> the major<br />
legal themes <strong>of</strong> IFM. Within the concept <strong>of</strong><br />
IWRM, flood management decisions must<br />
take into account both how to alleviate flood<br />
risk and how to minimise the socio-economic<br />
impact. It is more likely to achieve good results<br />
when an integrated basin approach is used;<br />
but an integrated approach requires that a<br />
number <strong>of</strong> institutions and authorities work<br />
together, and for this it is essential to ensure<br />
coordination among them (Box 15).<br />
Box 15: Major sectors having policies<br />
relevant to flash flood management<br />
• Agriculture and food security<br />
• Land use (zonation)<br />
• Forestry<br />
• River valley management<br />
• Watershed management<br />
• Health<br />
• Education<br />
• Physical planning and infrastructure<br />
development<br />
• Water and sanitation<br />
Ensuring coordination requires that: first,<br />
• Information and communication<br />
planning at the governmental level must be<br />
integrated so that the government’s strategy,<br />
which is implemented through different<br />
departments, is coherent and harmonised; and second, that it must be applied at all levels <strong>of</strong> public planning,<br />
whether national, regional or local, and involve all relevant public agencies. At the same time, there should<br />
also be some mechanism to ensure that local views and experiences are in turn fed back into the national<br />
planning processes.<br />
Figure 27 shows how horizontal and vertical interactions work to integrate various stakeholders and interest<br />
groups at all relevant areas <strong>of</strong> government planning. The horizontal axis shows interactions between the<br />
various government departments and ministries (at all levels), and how stakeholders and interest groups are<br />
involved in the decision-making processes. The vertical axis shows consistency in the policy and planning<br />
processes and implementation at different levels <strong>of</strong> government. From the local level up, plans should be<br />
consistent with those produced at the next higher level.<br />
The need for a coordinated and integrated approach can be illustrated by the example <strong>of</strong> land use planning.<br />
Since land use influences flood risk and water management in general, it is imperative that land use planning<br />
and water use allocation be properly coordinated. Land use in a given area (whether urban or rural) can<br />
affect flood risk elsewhere in the basin. Moreover, the consequences for flood risk from the forestry sector<br />
(e.g., uncontrolled logging) can have consequences for erosion and, to a limited extent, for flood peaks.<br />
Similarly, agricultural land use practices (e.g., topsoil compaction) can have consequences for downstream<br />
river regimes. Consequently, forestry policy and planning should be subject to flood risk assessment. The<br />
technical aspects <strong>of</strong> forestry and agricultural practices with regards to land use may also be subject to<br />
regulations but these may be more difficult to enforce.<br />
session 17<br />
Information generation and sharing<br />
Robust notification and information are required. <strong>Flood</strong> management strategies need to be based on scientific<br />
data gathered by a number <strong>of</strong> agencies and need to be constantly reviewed in the light <strong>of</strong> new data<br />
123
<strong>Flash</strong> <strong>Flood</strong> <strong>Risk</strong> <strong>Management</strong> – A <strong>Training</strong> <strong>of</strong> <strong>Trainers</strong> Manual<br />
Figure 27: Integration <strong>of</strong> various stakeholders and interest groups in flood management<br />
All relevant<br />
ministries/<br />
departments<br />
Environmental<br />
regulator<br />
National<br />
Farmers /<br />
forest users<br />
Developers<br />
Insurers<br />
Regional<br />
Irrigators<br />
Dam/reservoir<br />
operators<br />
Strategic industries<br />
Lenders/credit<br />
institutions<br />
Local<br />
Local communities<br />
session 17<br />
Emergency<br />
services<br />
Drainage<br />
authorities<br />
Water/sewerage<br />
service providers<br />
Sectors<br />
Users<br />
Other stakeholders<br />
Source: WMO (2006)<br />
124
Day 8<br />
gathered with each new flood event. Mechanisms must therefore be in place to feed basic planning data and<br />
assessments <strong>of</strong> actual performance back into the strategic planning process. Various types <strong>of</strong> information that<br />
are generated in the monitoring process are required for preparedness as well as to keep improving strategies<br />
for emergency response, and these need to be shared across administrative boundaries.<br />
Raising the awareness <strong>of</strong> property owners and stakeholders on the risks <strong>of</strong> flooding is paramount. When<br />
stakeholders understand the risks to which they are exposed, they are more likely to participate in the<br />
planning process. The flood hazard maps and all <strong>of</strong> the plans, programmes, and strategies that have been<br />
devised form the basic information package that should be shared with all stakeholders as part <strong>of</strong> their<br />
pre-flood preparedness. These, along with the related timing and background information that have been<br />
subjected to public scrutiny, must be made available and accessible to the public at large.<br />
Information about the rights, powers, and obligations <strong>of</strong> the concerned authorities for the provision <strong>of</strong> flood<br />
forecasting, warning, and emergency response should also be shared. The rights <strong>of</strong> access <strong>of</strong> authorities<br />
to relevant information should be made clear, and the availability <strong>of</strong> such information should be ensured<br />
(basin wide). Authorities should be obligated to broadcast flood warnings in the mass media. Unambiguous<br />
assignment <strong>of</strong> responsibilities is also essential for establishment <strong>of</strong> liabilities in the case that warnings are<br />
issued too late, inaccurately, or without just cause.<br />
Enabling stakeholder participation<br />
Stakeholder participation is central to the IFM concept. In order for IFM to deliver maximum benefit to the<br />
largest number <strong>of</strong> people, all stakeholders must be involved in the decision-making process. The level <strong>of</strong><br />
participation <strong>of</strong> the different interested groups will vary depending on their expertise and whether they are<br />
involved nationally or locally, however, regardless <strong>of</strong> the level <strong>of</strong> involvement, without effective participation<br />
from all quarters, IFM cannot succeed.<br />
The realisation that the participation <strong>of</strong> stakeholders in flood management is necessary leads to a number <strong>of</strong><br />
questions, such as:<br />
• Who are the stakeholders?<br />
• What decisions should they be involved in?<br />
• What information should be provided, and how, to achieve effective participation?<br />
• How much consideration should be given to stakeholder views?<br />
• What rights, powers, and obligations should the stakeholders and the decision-making authorities have?<br />
It is important to recognise that the stakeholders referred to above include not only property owners and<br />
inhabitants <strong>of</strong> the area (who are particularly vulnerable to flooding), but also other bodies that have an interest<br />
in the way the decisions affecting flood management are made. If flood management is to be sustainable, it<br />
must accommodate the economic, environmental, and social needs <strong>of</strong> the basin, and stakeholders reflecting<br />
each <strong>of</strong> these aspects must have a role in the way flood management is planned and implemented.<br />
Ensuring rights, powers, and obligations<br />
Institutions and individuals must have the necessary rights and power to implement the legal provisions<br />
related to flash flood management. Legislation works within the framework <strong>of</strong> the constitution <strong>of</strong> a country.<br />
Constitutional rights differ from those arising from the overall statutory framework. The rights <strong>of</strong> institutions and<br />
organisations need to be examined separately from the rights afforded to individuals. Some countries have<br />
promoted decentralisation and transferred powers to formal village groups and associations; in that context<br />
group rights have been significant. With the adoption <strong>of</strong> integrated and participatory approaches to flood<br />
management there is a growing need to develop conditions under which groups can form legally constituted<br />
associations or local self-governance units to exercise their legal rights.<br />
session 17<br />
125
<strong>Flash</strong> <strong>Flood</strong> <strong>Risk</strong> <strong>Management</strong> – A <strong>Training</strong> <strong>of</strong> <strong>Trainers</strong> Manual<br />
In general, the property owner has a corresponding right to claim compensation for any damage caused by<br />
the construction <strong>of</strong> works which need to be implemented during a flood emergency. When private land has to<br />
be expropriated for flood defence work or for flood retention, the expropriating authority must have adequate<br />
purchasing power to be able to compensate the landowner.<br />
RM 17.3: International conventions and laws that pertain to flash flood<br />
and disaster management<br />
Many international laws and initiatives pertain to flood management. For example,<br />
• the 1997 United Nations Convention on the Law <strong>of</strong> the Non-navigational Uses <strong>of</strong> International<br />
Watercourses (also known as the United Nations Watercourses Convention) – the only global framework<br />
treaty to address the use <strong>of</strong> rivers for purposes other than navigation – adopted IFM as its central policy<br />
concept in the area <strong>of</strong> water hazard and risk (UN, 2005);<br />
• the International <strong>Flood</strong> Initiative adopted IFM as a central policy concept (UNESCO-IHP, 2007);<br />
• the Hyogo Framework for Action explicitly recognises the need for IFM strategies (UNISDR 2005).<br />
Basic principles <strong>of</strong> the 1997 United Nations Watercourses Convention<br />
Equitable and reasonable utilisation. In articles 5 and 6, the principle <strong>of</strong> equitable and reasonable utilisation<br />
is spelled out as follows:<br />
Utilisation <strong>of</strong> an international watercourse in an equitable and reasonable manner … requires taking<br />
into account all relevant factors and circumstances, including:<br />
• Geographic, hydrographic, hydrological, climatic, ecological and other factors <strong>of</strong> a natural<br />
character;<br />
• The social and economic needs <strong>of</strong> the watercourse States concerned;<br />
• The population dependent on the watercourse in each watercourse State;<br />
• The effects <strong>of</strong> the use or uses <strong>of</strong> the watercourses in one watercourse State on other watercourse<br />
States;<br />
• Existing and potential uses <strong>of</strong> the watercourse;<br />
• Conservation, protection, development and economy <strong>of</strong> use <strong>of</strong> the water resources <strong>of</strong> the<br />
watercourse and the costs <strong>of</strong> measures taken to that effect;<br />
• The availability <strong>of</strong> alternatives, <strong>of</strong> comparable value, to a particular planned or existing use.<br />
… The weight to be given to each factor is to be determined by its importance in comparison with that<br />
<strong>of</strong> other relevant factors. In determining what is a reasonable and equitable use, all relevant factors are<br />
to be considered together and a conclusion reached on the basis <strong>of</strong> the whole.<br />
session 17<br />
No significant harm. Closely linked to the rule <strong>of</strong> equitable and reasonable utilisation is the obligation<br />
that watercourse States not cause significant harm. While the rule <strong>of</strong> equitable and reasonable utilisation<br />
focuses on balancing competing interests, the focus on ‘no significant harm’ is on the management <strong>of</strong> risk.<br />
“Watercourse States shall … take all appropriate measures to prevent the causing <strong>of</strong> significant harm to other<br />
watercourse States.”<br />
The Convention seeks to harmonise the obligation <strong>of</strong> no significant harm with that <strong>of</strong> equitable and<br />
reasonable utilisation by stating in Article 7(2) that:<br />
Where significant harm nevertheless is caused to another watercourse State, the States whose use<br />
causes such harm shall, in the absence <strong>of</strong> agreement to such use, take all appropriate measures,<br />
having due regard to the provisions <strong>of</strong> articles 5 and 6, in consultation with the affected States, to<br />
eliminate or mitigate such harm and, where appropriate, to discuss the question <strong>of</strong> compensation.<br />
126
Day 8<br />
Precautionary principle<br />
The precautionary principle can broadly be defined as “the imposition <strong>of</strong> controls in advance <strong>of</strong> complete<br />
scientific understanding” (WMO 2006). In the context <strong>of</strong> environmental protection, Principle 15 <strong>of</strong> the Rio<br />
Declaration provides that: “where there are threats <strong>of</strong> serious or irreversible damage, lack <strong>of</strong> full scientific<br />
certainty shall not be used as a reason for postponing cost-effective measures to prevent environmental<br />
degradation” (UN, 1992a).<br />
A precautionary approach could equally be taken with respect to the protection <strong>of</strong> human life or property.<br />
Article 3(3) <strong>of</strong> the United Nations Framework Convention on Climate Change states that: “The Parties should<br />
take precautionary measures to anticipate, prevent or minimise the causes <strong>of</strong> climate change and mitigate<br />
its adverse effects. Where there are threats <strong>of</strong> serious or irreversible damage, lack <strong>of</strong> full scientific certainty<br />
should not be used as a reason for postponing such measures, taking into account that policies and measures<br />
to deal with climate change should be cost-effective so as to ensure global benefits at the lowest possible<br />
cost” (UN, 1992b).<br />
Legal framework for IFM in transboundary basins<br />
The HKH region has many transboundary river basins. The most relevant law relating to flood management<br />
issues at the transboundary level is the Law <strong>of</strong> International Watercourses, which includes United Nations<br />
Watercourse Convention. It will be necessary to explore whether other provisions, such as the protection <strong>of</strong><br />
the environment and the principles enunciated in other related international conventions and protocols, could<br />
be drawn upon to establish a legal framework for IFM in transboundary basins.<br />
session 17<br />
127
<strong>Flash</strong> <strong>Flood</strong> <strong>Risk</strong> <strong>Management</strong> – A <strong>Training</strong> <strong>of</strong> <strong>Trainers</strong> Manual<br />
Session 18 <strong>Flash</strong> <strong>Flood</strong> <strong>Management</strong><br />
Cycle – Preparedness<br />
Time: 60 minutes<br />
Objective<br />
To understand the management cycle for flash flood preparedness and its related activities, which includes<br />
understanding the following:<br />
XX<br />
The different phases <strong>of</strong> the flash flood management cycle<br />
XX<br />
The importance <strong>of</strong> emergency planning and related activities<br />
XX<br />
Different preparedness activities<br />
Note to the<br />
trainer<br />
Remind the class that community-based flash flood management<br />
and social hazard mapping was discussed in Sessions 7<br />
and 9 and that the Community <strong>Flash</strong> <strong>Flood</strong> <strong>Risk</strong> <strong>Management</strong><br />
Committee (CFFRMC) is responsible for undertaking emergency<br />
planning and preparedness activities at the community level.<br />
Activities<br />
Activity 18.1: Concept and phases <strong>of</strong> the flash flood management cycle<br />
Time: 10 minutes<br />
Discuss the flash flood management cycle. Clarify that it starts with community preparedness before the flood<br />
event, follows through with response during the event, and wraps up with recovery activities after the flood.<br />
Activity 18.2: Emergency planning activities at community level<br />
Time: 15 minutes<br />
Step 1<br />
Step 2<br />
Highlight the need for emergency planning for flash flood management. Clarify who is responsible,<br />
what the activities are, and how the activities are managed.<br />
Discuss the major activities for emergency planning. Discuss what resources, equipment, and<br />
materials may be needed, how to plan for safe places, and how to address the specific needs <strong>of</strong><br />
women, children, the elderly, and the disabled.<br />
Activity 18.3: Community preparedness activities for flash flood<br />
management<br />
session 18<br />
Time: 35 minute<br />
Step 1<br />
Review what a community can do to be prepared for a flash flood. Highlight the importance <strong>of</strong><br />
community and household awareness and preparedness (see Box 16 in RM 18.3). Engage the<br />
128
Day 8<br />
class in a short question and answer session in which they are asked to come up with different<br />
methods that can be used to raise community awareness. Get the class to think about how different<br />
segments <strong>of</strong> the society can be reached.<br />
Step 2<br />
Step 3<br />
Step 4<br />
Step 5<br />
Quickly review the different flood forecasting and early warning systems that may be available;<br />
remember to include local knowledge for early warning. Review what a community should do if<br />
any <strong>of</strong> the warning systems signal an impending flood.<br />
Discuss the various systems that are used for early warning in local communities, such as the herder<br />
relay system (as in Pakistan), watchtowers with an alarm (as in Chitwan, Nepal), big fires, and the<br />
sounding <strong>of</strong> various musical instruments. Highlight the importance <strong>of</strong> communicating early warning<br />
information in a way that is easy to understand, time and cost effective, and sustainable. Discuss<br />
ways <strong>of</strong> making information from scientific early warning systems more understandable to local<br />
communities.<br />
Discuss what small structural and non-structural methods people can use for hazard mitigation.<br />
Mention how techniques such as bioengineering and ethno-engineering can be used for flash flood<br />
hazard mitigation.<br />
Explain that during an emergency situation, it is necessary to establish a control room. Go over the<br />
functions <strong>of</strong> a control room, and review related information such as where to locate it (geophysical<br />
location), minimum area requirements, how far it can be from settlements, and safe access routes.<br />
Note to the<br />
trainer<br />
Ask participants what community awareness measures are most<br />
effective in their region. Discuss why early warning systems,<br />
even if they are available, might not be effective. For example,<br />
communities in remote mountain communities may not have a<br />
local radio station, and if they do, not every family may own a<br />
radio. Some segments <strong>of</strong> the community, e.g., women, do not<br />
<strong>of</strong>ten have time to listen to radio or other reports. Since scientific<br />
warnings and data, before they are edited for mass media,<br />
are not appropriate for distribution to the community, local<br />
knowledge still plays a vital role in the community.<br />
Emphasise that the participants need to be sensitive to community<br />
perception. In many communities, respected individuals or<br />
organisations (e.g., the village head, school teacher, or health<br />
workers) are considered the most reliable and authentic bearers<br />
<strong>of</strong> information, and their advice is heeded. The CFFRMC<br />
can mobilise these persons and organisations for effective<br />
communication and awareness rising.<br />
session 18<br />
129
<strong>Flash</strong> <strong>Flood</strong> <strong>Risk</strong> <strong>Management</strong> – A <strong>Training</strong> <strong>of</strong> <strong>Trainers</strong> Manual<br />
Session 18 Resource Materials<br />
RM 18.1: Concept and phases <strong>of</strong> flash flood risk management cycle<br />
The management <strong>of</strong> flash floods (and floods in general) takes place in three phases: preparedness, response,<br />
and recovery.<br />
The preparedness phase aims to prepare an effective response to a flood disaster; the community and the<br />
concerned authorities each prepare accordingly. The response phase aims to reduce adverse impacts during<br />
the flood. The recovery phase aims to assist the affected community to rehabilitate and rebuild. The last phase<br />
evaluates, monitors, and documents its activities so that everyone concerned can better prepared for future<br />
events. The cycle <strong>of</strong> flood management and major activities is given in Figure 28.<br />
Figure 28: The flood response management cycle; major activities by phase<br />
Community<br />
activities<br />
Pre-flood<br />
During flood<br />
Post-flood<br />
Coordination –<br />
CFFRMC<br />
• Emergency planning and<br />
assigning responsibilities<br />
• Collect flood information<br />
• <strong>Flood</strong> forecasting/early warning<br />
• Awareness rising<br />
• Identify and prepare shelter<br />
Pre-flood: PREPAREDNESS<br />
• Evacuation and rescue<br />
• Provide shelter<br />
• Ensure normal life: food, health,<br />
security<br />
• Maintaining mobility and<br />
communication<br />
During flood: RESPONSE<br />
session 18<br />
• Damage/loss assessment<br />
• Assessing community needs<br />
• Recovery and rehabilitation<br />
• Continuous relief activities<br />
• Monitoring and evaluation for<br />
better future preparation<br />
Post-flood: RECOVERY<br />
130
Day 8<br />
RM 18.2: Emergency planning activities in the community<br />
Emergency relief plans are contingency plans used to cope with the devastation. Before a flood occurs it is<br />
impossible to predict with certainty when it will occur and what intensity it will have. All eventualities need<br />
to be considered and for this reason emergency planning is based on the comprehensive risk assessment<br />
scenarios put together by the community. The plans are designed by the various sub-committees <strong>of</strong> the<br />
CFFRMC in close collaboration with the community and other external organisations. The design and<br />
discussion <strong>of</strong> plans is one <strong>of</strong> the important preparedness activities because once the plans have been agreed<br />
upon it is easier to deliver a quick and effective response to evacuate and provide relief to those affected<br />
during an actual emergency situation.<br />
Emergency relief plans need to be culturally sensitive and need to take cultural sensitivities into consideration<br />
so that no disputes arise when the plans are implemented. The plans must be comprehensive and look after<br />
the needs <strong>of</strong> the local population.<br />
Emergency relief planning involves the following activities:<br />
• setting clear roles and responsibilities for CFFRMC members, team leaders, and volunteers;<br />
• ensuring the participation <strong>of</strong> beneficiaries;<br />
• keeping an inventory <strong>of</strong> the trained human resources available in case <strong>of</strong> emergency;<br />
• developing the capacity <strong>of</strong> the CFFRMC in rapid disaster needs assessment at the local level;<br />
• establishing an emergency operation centre (i.e., control room);<br />
• planning for relief camps and shelter management;<br />
• planning activities to ensure timely disaster relief;<br />
• planning for the specific needs <strong>of</strong> children, women, and people with special needs during the relief<br />
phase;<br />
• identifying the resources that might be needed for emergency relief;<br />
• ensuring that there are emergency stockpiles at each cluster level for use during the emergency;<br />
• identifying safe places for evacuation during flash flooding and planning evacuation routes;<br />
• fostering good communication between the different agencies during the relief phase to avoid duplication<br />
<strong>of</strong> effort and to avoid possibly overlooking some segments <strong>of</strong> the populations.<br />
RM 18.3: Community preparedness activities for flash flood management<br />
Communities must be prepared to mitigate the risk <strong>of</strong> flash floods (Box 16). Preparedness involves:<br />
• awareness raising and community mobilisation;<br />
• drills;<br />
• forecasting and early warning;<br />
• various small structural measures.<br />
The CFFRMC is responsible for handling these preparedness activities. The CFFRMC can also unite<br />
the community, make preparedness plans, and assign duties and responsibilities to the members <strong>of</strong> the<br />
community.<br />
Raising awareness<br />
Community awareness about flash floods is very important for effective risk management activities and<br />
behaviour (Box 17). Various awareness campaigns can be conducted to inform and unite the community.<br />
Awareness raising measures can include posters, brochures, songs/drama/street theatre, school arts projects<br />
and essay competitions, audio-visual presentations, training and demonstrations, regular drills, and promotion<br />
by local celebrities such as singers, leaders, and actors. The objective <strong>of</strong> community mobilisation is to<br />
increase the resilience <strong>of</strong> the community.<br />
session 18<br />
131
<strong>Flash</strong> <strong>Flood</strong> <strong>Risk</strong> <strong>Management</strong> – A <strong>Training</strong> <strong>of</strong> <strong>Trainers</strong> Manual<br />
session 18<br />
Box 16: Community and household<br />
preparedness<br />
Why should communities in flash flood prone areas be<br />
prepared?<br />
<strong>Flash</strong> floods are inevitable and beyond anyone’s control.<br />
Everyone living in the flood prone area will be affected to<br />
some extent. Outside support is limited, and no institutions<br />
outside the community can manage flash flood risk. The<br />
community should therefore be prepared for the event.<br />
Community mobilisation, awareness raising, and preparation<br />
can increase community resilience. Resilient communities<br />
are capable <strong>of</strong> adjusting and bouncing back from adverse<br />
events. They can do this by actively preparing for economic,<br />
social, and environmental change. Community resilience can<br />
be cultivated through social learning, which is the learning<br />
process that takes place among a group <strong>of</strong> people who seek<br />
to improve a common situation by taking action collectively;<br />
flash flood risk management is just such a situation.<br />
Emergency preparedness at the household level<br />
Communities need to be prepared for flood hazards. Each<br />
member <strong>of</strong> the hazard prone community should be prepared<br />
with the following:<br />
• emergency supplies <strong>of</strong> important items (such as<br />
medication, money, bank information)<br />
• stockpiles <strong>of</strong> food, water, and fodder for livestock<br />
• stockpiles <strong>of</strong> cooking utensils and fuel<br />
• a plan for refuge in case <strong>of</strong> an evacuation<br />
• materials and methods for emergency flood pro<strong>of</strong>ing<br />
(sandbagging and boarding)<br />
• plans to move vehicles and livestock to higher ground<br />
How to raise awareness for local preparedness<br />
• Street drama and songs<br />
• School art and essay competitions<br />
• <strong>Training</strong> and demonstrations (with audio-visuals)<br />
• Printed matter (posters, brochures, etc.)<br />
• Regular drills<br />
• Promotion by local celebrities<br />
Box 17: How to respond to a flood warning<br />
• Listen to the radio for updated emergency information.<br />
• Be alert to signs <strong>of</strong> flooding.<br />
• Bring outdoor belongings (e.g., patio furniture, bicycles)<br />
indoors.<br />
• Move valuable household possessions to the upper floors<br />
or to safe ground if time permits.<br />
• Move quickly to higher ground. If you live in a<br />
flood prone area or think you are at risk, evacuate<br />
immediately.<br />
• Follow instructions and heed the advice <strong>of</strong> local<br />
authorities.<br />
• If advised to evacuate, do so immediately.<br />
• Follow recommended evacuation routes.<br />
An effective means <strong>of</strong> reaching the community<br />
is to approach the children. Children will<br />
relate these school activities to their families<br />
and friends. The older participants can also<br />
be asked to prepare evacuation plans for<br />
their families highlighting their knowledge<br />
<strong>of</strong> safe places, and their understanding <strong>of</strong><br />
what food and other basic supplies and<br />
equipment might be needed. Various types <strong>of</strong><br />
training can be given to adults and workers<br />
regarding hazards, existing resources, and<br />
considerations in flash flood risk management.<br />
Since experience shows that it can be<br />
difficult to give awareness training to elderly<br />
people, one strategy can be to approach<br />
them when they are taking part in local feasts<br />
and festivals. During this time, awareness<br />
programmes can be presented using audiovisual<br />
media.<br />
Street theatre can also be used at times <strong>of</strong><br />
social gatherings in the village to help raise<br />
awareness. Similarly, if local celebrities can<br />
be convinced to participate in the event they<br />
can lend their voice to it and help to convey<br />
the massage effectively and in an entertaining<br />
manner.<br />
Cooperation with local media can be helpful<br />
but it is necessary to be mindful that many<br />
<strong>of</strong> the poorest households still do not have<br />
access. Yet another approach can be to place<br />
large and attractive maps <strong>of</strong> flood hazard<br />
areas in public places such as schools, market<br />
places, health posts, and village councils to<br />
get local people to discuss them and become<br />
acquainted with the different features.<br />
Drills<br />
In addition to all the preparation measures,<br />
demonstration drills are also very helpful. The<br />
CFFRMCs can conduct drills to prepare the<br />
community for emergencies by involving all<br />
members <strong>of</strong> the community, including women,<br />
children, and the elderly. Demonstrations,<br />
drills, and simulations are necessary for<br />
efficient disaster preparedness. Exercises and<br />
demonstrations can include orientations to<br />
provide general information on evacuation<br />
plans. Drills also serve to test run the plans and<br />
verify how effective they are (ADPC/UNDP<br />
2005).<br />
132
Day 8<br />
<strong>Flood</strong> forecasting and early warning<br />
Communities use a variety <strong>of</strong> forecasting methods to minimise losses since some warning systems work better<br />
than others depending on the environment. In some communities, one particular warning signal might be more<br />
effective than others because <strong>of</strong> the nature <strong>of</strong> the hazard. The key to an effective forecasting and warning<br />
system is to be able to disseminate the information and to communicate it in a form that is understandable to a<br />
mass audience. Radio and television can provide weather information such as how much rainfall is expected<br />
and where it is expected. Since this type <strong>of</strong> information can be useful in forecasting flash floods, communities<br />
should be encouraged to heed these mass media weather reports especially during the monsoon season.<br />
CFFRMCs should be familiar with local knowledge and incorporate it in preparedness plans and early<br />
warning systems. Local knowledge can be as simple as observing clouds in the upper catchments or<br />
observing changes in the water flows (e.g., rising water levels, river water mixed with mud, and leaves<br />
floating on the water). Increasing numbers <strong>of</strong> fish in the river, unusual sounds or smells, and unusual behaviour<br />
<strong>of</strong> animals also provide clues that something has changed and that a flood may be imminent. Ice avalanches<br />
and glacial calving generate loud noises that can be taken as early warning signals. Similarly, continued<br />
rainfall in the surrounding areas or in the upper catchments <strong>of</strong> a stream provides a clue as to the likelihood <strong>of</strong><br />
a flood event. The CFFRMC (through volunteers) can set up a network <strong>of</strong> rain gauges and they can share the<br />
information with each other about the amount and intensity <strong>of</strong> rainfall.<br />
A person from the community can be given<br />
the responsibility to keep an eye on upstream<br />
watershed condition from the early warning<br />
outlook tower; if the water level rises above<br />
normal, he or she can issue a warning to<br />
the community (Box 18). Issuing an audiovisual<br />
warning can be as simple as beating<br />
a drum, flashing a mirror, or starting a signal<br />
fire. A simple yet effective means is to use a<br />
mirror to reflect sunlight down to the village.<br />
Alternatively, creating a large fire on a hilltop<br />
can warn downstream communities.<br />
Box 18: Some ways to communicate<br />
warnings<br />
• Warning flags, fires, or flashing mirrors<br />
• Radio broadcasts<br />
• Loudspeakers or beating loud drums<br />
• Police<br />
• Interpersonal communications<br />
• Telephone (landline and mobile)<br />
Herders who see signs <strong>of</strong> an impending flood can also issue a warning to the community, by shouting to<br />
other herders on lower pastures or to the nearest village in a chain system. Since herders typically spread<br />
their flocks evenly on the available grazing space, they are in a good position to see other herders further on<br />
down the valley; in this way the message can be relayed from valley to valley. Herders typically use different<br />
rhythms and tunes to convey different messages. Using this type <strong>of</strong> local knowledge for communication<br />
ensures that it is in tune with the local socio-cultural context, and that, as such, it is well accepted and trusted<br />
as well as being cost effective.<br />
Structural measures for hazard mitigation<br />
To address hazards properly, some community-level structural measures are also needed. An account <strong>of</strong><br />
the past history <strong>of</strong> the community can encourage its households to minimise flood damage by taking some<br />
structural measures. Simple structural measures can be:<br />
• embankments along tributaries;<br />
• minor drainage works which allow the flood to pass, thus avoiding inundation;<br />
• irrigation canals that divert water to agricultural fields;<br />
• culverts and floodways;<br />
• construction <strong>of</strong> houses, communities, and roads in upland areas only;<br />
• polders to enclose houses, fields, food supplies, or animal fodder;<br />
• construction <strong>of</strong> public buildings such as schools or auditoriums in upland areas so that they can also be<br />
used as refuges where the whole community can take shelter during a flood.<br />
session 18<br />
133
<strong>Flash</strong> <strong>Flood</strong> <strong>Risk</strong> <strong>Management</strong> – A <strong>Training</strong> <strong>of</strong> <strong>Trainers</strong> Manual<br />
In constructing buildings with the intention that they can also be used as refuges, it should be remembered that<br />
they will need to have access to a safe supply <strong>of</strong> drinking water and sanitary facilities.<br />
Control room<br />
A well equipped central location is needed for the use <strong>of</strong> the early warning and communications team to use<br />
as a headquarters where they can carry out management activities. The control room should be located in<br />
a convenient and easily accessible location that is also out <strong>of</strong> immediate danger. The location <strong>of</strong> the control<br />
room needs to be decided upon before the flood season begins and needs to be operational on a 24-hour<br />
basis during the flood.<br />
The control room not only acts as a centre for information dissemination but it can also be used as a place<br />
to: prepare advance contingency plans, to conduct rescue drills, to gather the community and assign duties<br />
during a flood, to train volunteers, and to store emergency supplies and equipment.<br />
Some suggested features <strong>of</strong> a control room are:<br />
• convenient, safe, and easily accessible location;<br />
• the facility for an enquiry counter and information display board;<br />
• communication links such as landline telephone, FAX, mobile communication, radio, television, and<br />
computer with Internet access;<br />
• ready access to up-to-date information;<br />
The functions <strong>of</strong> the control room are:<br />
• to be the headquarters for receiving weather forecast information;<br />
• to be the location where villagers can learn about possible air dropping sites;<br />
• to pass on messages from every part <strong>of</strong> the affected area to the appropriate authorities;<br />
• to collect the information that will be needed for distributing relief items after the event;<br />
• to keep updated inventory <strong>of</strong> rescue items.<br />
session 18<br />
134
Day 8<br />
Session 19 <strong>Flash</strong> <strong>Flood</strong> <strong>Management</strong><br />
Cycle – Response and Recovery<br />
Time: 60 minutes<br />
Session 19<br />
Objective<br />
To become familiar with the response and recovery phases <strong>of</strong> the flash flood management cycle and their<br />
associated activities, such as:<br />
XX<br />
How and where to evacuate, search and rescue procedures, temporary shelter management, health and<br />
special needs<br />
XX<br />
How to carry out damage and needs assessment<br />
XX<br />
The activities involved in recovery and rehabilitation, and methods <strong>of</strong> enhancing community resilience<br />
XX<br />
Methods <strong>of</strong> monitoring, evaluation, and information management<br />
Activities<br />
Activity 19.1: Evacuation, search and rescue, shelter management, and<br />
health response<br />
Time: 15 minutes<br />
Step 1<br />
Step 2<br />
Step 3<br />
Step 4<br />
Step 5<br />
Step 6<br />
Step 7<br />
Discuss the aim <strong>of</strong> evacuation and rescue. Engage the class in a short question and answer session<br />
on what factors to consider when responding to a flood. Summarise and prioritise the answers. Go<br />
over the steps that the evacuation and rescue teams <strong>of</strong> the CFFRMC should undertake. Reiterate that<br />
evacuations are most effective when the community has had a chance to think about their response<br />
beforehand either by participating in the social hazard map or by being informed through an<br />
awareness campaign.<br />
Go over the list <strong>of</strong> things that the community should do both inside and outside the home during a<br />
flash flood (see Box 21 in RM 19.1).<br />
Discuss practical aspects <strong>of</strong> search and rescue and list what major equipment can be useful.<br />
Discuss the importance <strong>of</strong> temporary shelters and shelter management. Emphasise the need for<br />
women to have some privacy, and the requirement for other special needs groups such as children,<br />
the elderly, and the disabled to be cared for.<br />
Go over the list <strong>of</strong> health issues that can be expected after a flood and what medication needs to<br />
be stocked.<br />
Go over the need to practice good hygiene. Mention the need for proper disposal <strong>of</strong> waste,<br />
human corpses, animal carcases, and the like.<br />
Make sure that everyone is aware <strong>of</strong> the special health needs <strong>of</strong> women, children, the sick, and<br />
the disabled.<br />
135
<strong>Flash</strong> <strong>Flood</strong> <strong>Risk</strong> <strong>Management</strong>: A <strong>Training</strong> <strong>of</strong> <strong>Trainers</strong> Manual<br />
Activity 19.2: Damage and needs assessment<br />
Session 19<br />
Time: 20 minutes<br />
Step 1<br />
Step 2<br />
Discuss the importance <strong>of</strong> damage assessment.<br />
Distinguish between ‘damage assessment’ and ‘needs assessment’. List the types <strong>of</strong> damage that<br />
can be expected after a flood and for each one discuss what ‘needs’ should be considered.<br />
Step 3<br />
Present methods for assessing physical, quantifiable damage and non-physical damage. Physical<br />
damage refers to damage to physical entities and assets (e.g., infrastructure), while non-physical<br />
damage (which can be difficult to quantify) refers to loss <strong>of</strong> agricultural productivity, physiological<br />
stress to people, injury or death <strong>of</strong> human beings and livestock, etc. A detailed inventory <strong>of</strong> each<br />
type <strong>of</strong> damage should be prepared for damage and loss assessment. Examples <strong>of</strong> checklists for<br />
both types <strong>of</strong> damage, physical and non-physical, are given in Handout 19.2. Checklists should<br />
include detailed information on the type <strong>of</strong> damage, the location <strong>of</strong> the damage, the estimated<br />
cost, and so on. The list can be prepared using participatory rural appraisal methods. The CFFRM<br />
team members should work in collaboration with the community and external support agencies to<br />
prepare the inventory. This group may choose to organise a focus group discussion – a research<br />
methodology in which a small group including representatives from the community and a researcher<br />
or moderator gathers to discuss a specified topic. The focus group can be tasked with preparing<br />
the inventory. Another method for obtaining specific information is a key informant survey.<br />
Note to the<br />
trainer<br />
In the aftermath <strong>of</strong> a flood disaster it is common to focus on<br />
damage assessment rather than on needs assessment. Remind<br />
the class that both are equally important.<br />
Activity 19.3: Recovery, rehabilitation, and enhancing community<br />
resilience<br />
Time: 10 minutes<br />
Step 1<br />
Step 2<br />
Step 3<br />
Step 4<br />
Step 5<br />
Step 6<br />
Discuss the aim and major aspects <strong>of</strong> recovery and rehabilitation activities.<br />
Discuss how the community can participate in rehabilitation activities.<br />
List the different areas for recovery and rehabilitation efforts.<br />
Discuss what community resilience is and review the factors that contribute to it.<br />
Discuss how community resilience can be threatened by a flood event.<br />
Discuss how community resilience can be enhanced.<br />
Note to the<br />
trainer<br />
Review the benefits <strong>of</strong> community resilience. Being resilient means<br />
being better prepared to save lives and property and being able<br />
to recover quickly after a flood event. Resilient communities:<br />
• are in a better position to receive and make good use <strong>of</strong><br />
national and sub-national funds;<br />
• have better access to emergency managers and researchers;<br />
• have a well informed public;<br />
• have identified their needs;<br />
• have good core infrastructure that can address community<br />
concerns.<br />
136
Day 8<br />
Activity 19.4: Monitoring, evaluation, and information management<br />
Time: 15 minutes<br />
Step 1 Clarify the importance and objectives <strong>of</strong> monitoring, evaluation and information management.<br />
Step 2 Discuss methods <strong>of</strong> monitoring, evaluation, and information management.<br />
Session 19<br />
137
<strong>Flash</strong> <strong>Flood</strong> <strong>Risk</strong> <strong>Management</strong>: A <strong>Training</strong> <strong>of</strong> <strong>Trainers</strong> Manual<br />
Session 19 Handouts<br />
Session 19<br />
Handout 19.2: Example <strong>of</strong> damage and loss assessment inventory,<br />
showing some typical impacts <strong>of</strong> flash floods<br />
Impact Physical/quantifiable/direct Non-physical/non-quantifiable/<br />
indirect<br />
Infrastructure damage X X<br />
Household<br />
Assets<br />
X<br />
Employment X X<br />
Injury*<br />
X<br />
Death<br />
X<br />
Mental health<br />
X<br />
Trauma<br />
X<br />
Economic loss/business<br />
Assets (merchandise)<br />
X<br />
Labour X X<br />
Down time X X<br />
Productivity loss<br />
X<br />
Agricultural loss<br />
Crops destroyed<br />
X<br />
Damage to surplus<br />
X<br />
Damage to fields<br />
X<br />
Damage to equipment<br />
X<br />
Labour X X<br />
Time lost<br />
X<br />
* It is also common to consider injury as physical damage.<br />
Source: ADPC/UNDP (2005)<br />
138
Day 8<br />
Session 19 Resource Materials<br />
RM 19.1: Evacuation, preparedness for search and rescue, shelter<br />
management, and health response<br />
It is critical to have a well coordinated and well managed response during a flash flood event. Planning for the<br />
eventuality <strong>of</strong> a flood and establishing guidelines ahead <strong>of</strong> time are two ways to minimise loss and damage.<br />
Session 19<br />
Evacuation<br />
The aim <strong>of</strong> evacuation is to remove people<br />
from the flood and its associated hazards<br />
(Boxes 19 and 20). The following factors<br />
should be considered by the evacuation and<br />
rescue teams.<br />
• Have evacuation procedures in place and<br />
available for the case in which there is little<br />
warning time.<br />
• Have alternative evacuation routes marked<br />
on the social flood hazard map.<br />
• Make sure that people are aware <strong>of</strong> the<br />
secondary hazards that can occur after<br />
a flash flood recedes, such as landslides,<br />
mudslides, exposed ‘live’ power cables<br />
that have snapped during the flood (which<br />
can be very dangerous), and snakes and<br />
other animals displaced from their natural<br />
habitats (which likewise can be dangerous<br />
to humans)<br />
(Box 21).<br />
• Give special consideration to the<br />
evacuation <strong>of</strong> vulnerable groups such as<br />
children, pregnant women, the elderly, and<br />
the disabled.<br />
Box 19: Evacuation and rescue<br />
Evacuation and rescue have different functions. During<br />
the evacuation phase, persons at risk are moved to safer<br />
ground. During rescue, the victims are resettled and<br />
provided with shelter and basic needs.<br />
Box 20: Essential activities for the evacuation<br />
and rescue team<br />
• Register the people who will be housed in the shelter.<br />
• Take note <strong>of</strong> any injury or medial requirements during<br />
the registration (if possible).<br />
• Take note <strong>of</strong> any other special requirements they may<br />
have.<br />
• Inquire whether they know if their family members and<br />
neighbours are safe or need to be rescued.<br />
• Dispense health information.<br />
• Provide a basic level <strong>of</strong> security and see that women<br />
and children are safe. It is important to ensure that<br />
women are protected from any violence.<br />
The CFFRMC (in coordination with other agencies) should<br />
help to provide and maintain basic health services and<br />
hygiene.<br />
Box 21: Responding to a flash flood – outside or inside<br />
If you are outside during a flash flood<br />
• Avoid going to flooded areas.<br />
• Do not let children play outside.<br />
• Watch out for hanging or submerged power lines and wires. If possible, report fallen electrical lines.<br />
• Do not venture to unstable ground.<br />
• Do not go to flooded river bank areas to catch fish or retrieve logs or timber.<br />
• If you are driving, stop driving and climb to higher ground.<br />
• Do not try to drive or walk over flooded roads or bridges.<br />
If you are inside during a flash flood<br />
• Gather together your preassembled emergency supplies.<br />
• Shut <strong>of</strong>f all power and propane gas in the house. Remember, fire is the most frequent hazard after a flood.<br />
• Quickly evacuate to safer or higher ground. If there is no time, climb to a higher floor or to the ro<strong>of</strong> top and signal for help.<br />
• Avoid walking around after the flooding as steps and floors are slippery and can be covered with debris and broken glass.<br />
139
<strong>Flash</strong> <strong>Flood</strong> <strong>Risk</strong> <strong>Management</strong>: A <strong>Training</strong> <strong>of</strong> <strong>Trainers</strong> Manual<br />
Session 19<br />
• Determine whether people can walk or drive out <strong>of</strong> the flooded area. Help them to move to higher ground<br />
or to the tops <strong>of</strong> buildings to await assistance.<br />
• Consider the various modes <strong>of</strong> transport such as walking, non-motorised vehicles, buses, cars, boats,<br />
helicopters, and army vehicles.<br />
• Notify people <strong>of</strong> evacuation routes and safe areas by communicating through the CFFRMC.<br />
Safe areas should be provided so that people can convene temporarily either before they are removed<br />
to evacuation camps or before they are assigned temporary shelters, or until they can safely return to their<br />
houses. In these safe places, victims need to have access to basic supplies such as blankets, water, food,<br />
medication, first-aid, and sanitation facilitates.<br />
It is essential to <strong>of</strong>fer safety and security to the flood victims. The military or police may be able to provide<br />
security for the period after the flood event until people can return to their homes. If it is possible to prevent<br />
looting after the emergency phase by protecting people’s assets it will facilitate the recovery phase. The<br />
CFFRMC should coordinate security with the military and the police. The safety and privacy <strong>of</strong> women must<br />
be prioritised.<br />
Search and rescue<br />
As soon as possible after a flash flood event, the<br />
evacuation and rescue teams should initiate search<br />
and rescue activities. Trained, untrained, or semitrained<br />
volunteers can be mobilised and led by<br />
experienced team leaders. Volunteers are dispatched<br />
in groups and usually asked to work on a rotational<br />
basis to minimise stress and exhaustion. Search<br />
and rescue volunteers need to have communication<br />
equipment to maintain contact with the control room<br />
at all time (Box 22). Rescue work should be fast and<br />
effective.<br />
Box 22: Suggested equipment for search<br />
and rescue<br />
• Suitable rescue ropes<br />
• Ladders<br />
• Buckets<br />
• Torches<br />
• Loudspeakers<br />
• Blankets<br />
• Floating rescue devices, inflatable boats<br />
• Two-way radios and other reliable<br />
communication equipment<br />
Shelter<br />
Temporary shelters are essential to house people who have been left homeless by the flood. The number <strong>of</strong><br />
temporary shelters needed depends on the population <strong>of</strong> the community. Temporary shelters protect people<br />
immediately after flooding and provide them with a level <strong>of</strong> security and privacy. Volunteers can manage<br />
the logistics <strong>of</strong> registering the names <strong>of</strong> people who have been rescued and can assign shelters. It is vital to<br />
record the names <strong>of</strong> those who have been rescued in order to be able to inform relatives and to identify those<br />
who are still missing.<br />
During the planning phase before a flood event, due consideration needs to be given to both the location <strong>of</strong><br />
the site and to considering how many temporary shelters would be needed. The location needs to be easily<br />
accessible, yet at a safe enough distance from any hazard.<br />
Other considerations for temporary shelters include:<br />
• Capacity: The population in each temporary shelter must be managed so that requirements do not exceed<br />
supplies.<br />
• Relief items: These can include food, clothing, medicine, cooking utensils, and general household items.<br />
• Gender: Arrangements for women in temporary shelters are <strong>of</strong>ten very poor. No matter how bad the<br />
situation is, women must be ensured at least a minimum amount <strong>of</strong> sanitation, security, and privacy.<br />
140
Day 8<br />
Health<br />
Members <strong>of</strong> the CFFRMC team responsible for health care must be able to dispense first-aid and to deal with<br />
large numbers <strong>of</strong> injured people. They also need to be aware <strong>of</strong> the possibility <strong>of</strong> secondary health problems<br />
such as water-related communicable diseases that are common after floods. Diseases such as typhoid, acute<br />
diarrhoea, skin infections, scabies, malaria, and dengue are common in flood-affected areas. It is necessary<br />
both to have an adequate supply <strong>of</strong> medicines on hand and to make people aware that some diseases can<br />
be prevented through good hygiene and sanitation practices such as preventing flies from gathering at waste<br />
disposal sites.<br />
Session 19<br />
In a post-flood situation (Box 23) it is essential<br />
to dispose <strong>of</strong> waste properly and to manage<br />
the removal <strong>of</strong> carcasses and corpses to<br />
minimise the spread <strong>of</strong> disease. It is important<br />
to respond to the special health requirements<br />
<strong>of</strong> women, children, and the elderly. The<br />
following are some key health and sanitation<br />
issues to be prepared for after a flood event.<br />
• Provide toilet facilities for people and make<br />
sure that the waste is disposed <strong>of</strong> in a<br />
sanitary manner.<br />
• Protect water supplies from contamination.<br />
• Be ready to provide simple first-aid. For<br />
example, provide oral saline when there<br />
is an outbreak <strong>of</strong> diarrhoea; administer<br />
aspirin for scorpion bites (if possible, put<br />
ice on the sting); and use calcium tablets<br />
or powdered eggshell to minimise allergic<br />
reactions. If necessary, quickly transfer the<br />
patients to the nearest hospital or health<br />
care facility.<br />
• Hang small open bottles <strong>of</strong> carbolic acid<br />
outside shelters (but out <strong>of</strong> reach <strong>of</strong> children)<br />
Box 23: What to do after a flood: Practical<br />
tips<br />
• If you are in a partly flooded building, get out and<br />
ask for help.<br />
• If you are outside, stay outside until the flood water<br />
subsides.<br />
• Help neighbours who require assistance, especially<br />
children, the elderly, and the disabled.<br />
• Make sure that buildings are safe to reoccupy.<br />
Inspect foundations and ro<strong>of</strong>s for cracks or other<br />
damage. Check for animals (such as poisonous<br />
snakes) that may have taken shelter in the house.<br />
• Continue listening to the radio or other<br />
announcements for further instructions and warnings.<br />
• Look for electrical damage. If you see electrical<br />
hazards (such as hanging ‘live’ wires), ask for help.<br />
• Boil, disinfect, or distil water before drinking.<br />
• Do not eat contaminated food.<br />
• Check that a proper waste disposal system is<br />
maintained.<br />
to help ward <strong>of</strong>f snake invasions and avoid snakebites.<br />
• Control infestations <strong>of</strong> house flies by using deltamethrin and permathrin in and around cooking and eating<br />
places.<br />
• Make sure to provide at least a minimum amount <strong>of</strong> water for drinking, cooking, and personal and<br />
domestic hygiene.<br />
• Ensure that people have enough containers to collect and store clean water.<br />
• Ensure that people have sufficient cooking utensils, equipment, and fuel to cook and store food safely.<br />
• Make people aware <strong>of</strong> health hazards.<br />
• Ensure that people have soap for washing their hands.<br />
RM 19.2: Methods and processes <strong>of</strong> damage and needs assessment<br />
Damage assessment refers to gathering information on the extent to which the flash flood damaged life<br />
and property in the area. <strong>Flash</strong> floods can destroy physical infrastructure, houses, livelihoods, and other<br />
socio-cultural and economic establishments. The damage needs to be assessed before any sustainable<br />
rehabilitation work can begin.<br />
Damage and needs assessment, followed by prioritisation, are the first steps towards recovery. After a disaster<br />
occurs, it is necessary to gather information on the damage incurred, but in doing so, there is also a danger<br />
141
<strong>Flash</strong> <strong>Flood</strong> <strong>Risk</strong> <strong>Management</strong>: A <strong>Training</strong> <strong>of</strong> <strong>Trainers</strong> Manual<br />
Session 19<br />
<strong>of</strong> being overwhelmed by too much information and so losing sight <strong>of</strong> the priority needs. It is very important<br />
to focus on the community’s needs, to make community vulnerability the first concern, and to address it using a<br />
rights-based approach. It is the right <strong>of</strong> the most vulnerable to have priority in a needs assessment; their needs<br />
should be assessed first.<br />
For this, the relief and rehabilitation team <strong>of</strong> the CFFRMC needs to be equipped with the proper skills and<br />
expertise. In conducting a needs assessment:<br />
• Determine the magnitude <strong>of</strong> the damage and how much area has been affected.<br />
• Determine what type <strong>of</strong> support is needed and how much is needed.<br />
• Keep a record for future reference.<br />
• Identify areas where the condition <strong>of</strong> the watershed can be improved to reduce the possibility that such a<br />
disaster could recur.<br />
Damage can be <strong>of</strong> two types, physical and non-physical. A conceptual framework for damage and needs<br />
assessment is given in Figure 29. Physical damage is quantifiable; this includes damage to structures and<br />
loss <strong>of</strong> assets. Environmental damage such as soil erosion, sedimentation, and damage to ecosystems and<br />
biodiversity should be assessed properly since this has consequences for agriculture.<br />
Non-physical damage or losses, such as the loss <strong>of</strong> productivity <strong>of</strong> agricultural land, loss <strong>of</strong> tourism revenues<br />
that would not be realised, delays in the economic growth <strong>of</strong> the area, or workforce losses due to injury, are<br />
more difficult to quantify. Trauma stemming from natural disasters can be devastating, and in extreme cases,<br />
survivors may continue to suffer extreme psychological distress long after the event (ADPC/UNDP 2005). As<br />
such, socio-economic losses must be assessed very carefully. It is difficult to correlate economic and social<br />
losses in the immediate aftermath <strong>of</strong> a flood; the first step is to conduct an assessment <strong>of</strong> the immediate needs<br />
such as shelter, water and sanitation, medical facilities etc., and to provide mental health counselling as<br />
needed, if possible. Handout 19.2 simplifies and categorises some <strong>of</strong> the direct and indirect, quantifiable<br />
and non-quantifiable, physical and non-physical impacts.<br />
Figure 29: Conceptual framework for damage and needs assessment<br />
Impact <strong>of</strong> a disaster hazard<br />
e.g., loss <strong>of</strong> house and crop,<br />
livestock died, scarcity <strong>of</strong> drinking<br />
water, income loss, food scarcity,<br />
disease outbreak, mass casualty<br />
Gap at household level<br />
Capacity <strong>of</strong> household<br />
e.g., food stock at household level,<br />
continuation <strong>of</strong> income, savings,<br />
informal credit source available,<br />
livestock, safe place for shelter, etc.<br />
Institutional response:<br />
• Health service functioning?<br />
• Primary health care, injury service and<br />
pregnant service available?<br />
• Search and rescue ongoing?<br />
• Food support ongoing?<br />
• Safe drinking water support ongoing?<br />
• Safe sanitation available?<br />
Make a list <strong>of</strong> priority<br />
Need for the affected people by gender,<br />
generation, occupation and ability<br />
Resources?<br />
Capacity?<br />
Decision making on response to a disaster<br />
Source: Based on ADPC/UNDP (2005)<br />
142
Day 8<br />
RM 19.3: Recovery and rehabilitation activities: How to enhance<br />
community resilience<br />
After flooding, many people may be at high risk and desperately awaiting different types <strong>of</strong> services. It is<br />
essential to assess the community’s needs and to carry out recovery and rehabilitation activities. These may<br />
include the reconstruction <strong>of</strong> buildings and infrastructure, maintaining basic hygienic conditions, maintaining<br />
basic economic conditions, maintaining or establishing gender equity, and enhancing the environment.<br />
Session 19<br />
People can show a great deal <strong>of</strong> courage in accepting their losses and in trying to rehabilitate their property,<br />
even if they have to start from nothing. Often, because <strong>of</strong> sentimental attachment, people tend to rebuild at<br />
the original location. In such cases, the survivors should be encouraged to consider the location carefully to<br />
avoid rebuilding in a location that again leaves them vulnerable to possible future flash floods.<br />
Health effects can surface immediately after a disaster and can continue for a long time. Waterborne<br />
diseases, mental illness, and malnutrition-related diseases are common in flood-affected areas. Volunteers must<br />
be prepared to assist the community by providing both mental and physical health care.<br />
<strong>Flash</strong> floods can be devastating for the economic condition <strong>of</strong> the community. Prosperity achieved over a<br />
lifetime can be lost in seconds. The speedy rehabilitation <strong>of</strong> economic activities is important for community<br />
resilience. In order to boost the local economy it is necessary that certain fundamental services be restored,<br />
including regular supplies <strong>of</strong> commodities such as electricity, kerosene, and gas; transportation; and the<br />
reconstruction and strengthening <strong>of</strong> river training works. Agricultural planning is important for enhancing<br />
economic viability. Other measures include providing temporary employment opportunities, training for<br />
income generating activities, and loans for small business, all <strong>of</strong> which can help local people in the short<br />
term. For the long term, adopting new farming techniques may be a good measure to reduce future risk.<br />
Every affected person must be assured <strong>of</strong> help from disaster relief measures irrespective <strong>of</strong> his or her economic<br />
and social status. Emphasis should be given to women’s needs and their protection from violence.<br />
Resilience is the extent to which a community has<br />
the capacity to regain its original state (Box 24).<br />
Even after vast destruction, resilient communities<br />
can get back on their feet by themselves and<br />
rebuild. Characteristics that enhance resilience<br />
include vibrant leadership, shared goals and<br />
values, established institutions and organisations,<br />
positive socioeconomic trends (stable and healthy<br />
populations with a diversified economic base),<br />
constructive external partnerships and linkages,<br />
and the availability and use <strong>of</strong> resources and<br />
skills (Gardner and Dekens 2007).<br />
Box 24: Elements <strong>of</strong> community resilience<br />
• Good governance<br />
• Robust socio-economic and livelihood systems<br />
• Good land use and resource management<br />
• Good structural design<br />
• Knowledge and understanding <strong>of</strong> risks<br />
• Effective warning and evacuation systems<br />
• Effective emergency response system<br />
• Disaster recovery plan in place<br />
Source: UCAR (2010)<br />
Community resilience is threatened by shifts in biophysical conditions; expansion <strong>of</strong> infrastructure such as roads<br />
and buildings; erosion <strong>of</strong> traditional knowledge and practices; population growth; permanent and transient<br />
migration; natural resource extraction; development <strong>of</strong> commercial agriculture and horticulture; protection <strong>of</strong><br />
strategic interests and national security; war; and tourism development (Gardner and Dekens 2007).<br />
Traits and activities that foster community resilience can include the following:<br />
• ability to learn from past flash flood experiences and to use this knowledge to prepare for possible future<br />
floods;<br />
• understanding <strong>of</strong> how ecological diversity (e.g., changed cropping patterns, stall feeding <strong>of</strong> livestock to<br />
discourage pasture degradation, and rehabilitation <strong>of</strong> degraded forest) can reduce the risk <strong>of</strong> vulnerability;<br />
• recognising the value <strong>of</strong> local knowledge about the local environment and the landscape;<br />
143
<strong>Flash</strong> <strong>Flood</strong> <strong>Risk</strong> <strong>Management</strong>: A <strong>Training</strong> <strong>of</strong> <strong>Trainers</strong> Manual<br />
Session 19<br />
• valuing community cohesion and cooperation by bringing all the expertise to one forum to address the<br />
disaster and its effects;<br />
• establishing linkages and partnerships with different partners and stakeholders;<br />
• making educational materials for response to flash floods available to everyone in the community;<br />
• increasing public awareness and understanding on severe weather and other hazards.<br />
RM 19.4: Monitoring, evaluation, and information management<br />
The CFFRMC usually monitors and evaluates the effectiveness <strong>of</strong> programmes and gives feedback to the<br />
process. Monitoring and evaluation can also be conducted by supporting NGOs or district-level government<br />
representatives. Monitoring typically has three phases: process monitoring, effect monitoring, and monitoring<br />
<strong>of</strong> significant changes in flash flood risk management. The major aims <strong>of</strong> monitoring and evaluation are:<br />
• to determine the full extent <strong>of</strong> positive and negative outcomes and impacts, usually at the end <strong>of</strong> a project;<br />
• to identify lessons that can be applied in future and improve effectiveness;<br />
• to document experiences for the purpose <strong>of</strong> advocating for policy change and institutionalisation;<br />
• to collect data demonstrating the quality and effectiveness <strong>of</strong> the process;<br />
• to ensure and demonstrate accountability;<br />
• to improve monitoring methods;<br />
• to take stock <strong>of</strong> the programme’s strengths and weaknesses;<br />
• to compare the programme with others like it;<br />
• to share experiences;<br />
• to evaluate cost effectiveness (to see if the work is costing too much and/or achieving too little).<br />
Information is a major resource for learning and planning. CFFRMCs should keep records <strong>of</strong> all flash flood<br />
events, damage incurred, their own activities, and how they responded to the flood. CFFRMCs should collect<br />
the relevant information for preparedness, which can be used before, during, and after flood situations.<br />
Information on how <strong>of</strong>ten local floods occur and the extent and duration <strong>of</strong> the inundation is very important<br />
for reviewing preparedness and action plans. CFFRMCs should keep records <strong>of</strong> maximum flood levels at<br />
different locations since this can facilitate post-flood investigations by technical agencies and can be helpful in<br />
planning for possible future events.<br />
Managing information for future reference is important because it:<br />
• helps planners to visualise what long-term support people will need;<br />
• provides a reference point to allow development workers and researchers to determine the cause <strong>of</strong> the<br />
disaster by knowing its magnitude and duration in the watershed – information that can be used to support<br />
integrated watershed management;<br />
• quantifies the loss <strong>of</strong> life and property;<br />
• clarifies the constraints on preparedness that limited<br />
intervention in the past;<br />
• clarifies what went wrong in the areas <strong>of</strong><br />
evacuation and temporary settlements;<br />
Box 25: Continuous evaluation and<br />
improvement <strong>of</strong> the CFFRMC<br />
• can be a source <strong>of</strong> ideas for improvements and<br />
The CFFRMC can call a general meeting to discuss the<br />
innovations that can help to reduce future losses.<br />
strengths and weaknesses <strong>of</strong> the risk management efforts.<br />
Since community members directly or indirectly monitor<br />
The CFFRMC can also record its own activities<br />
(Box 25) as well as those <strong>of</strong> other groups that it has<br />
worked with such as INGOs, NGOs, research institutes,<br />
and development agencies. Documentation and<br />
records should also comprise relevant audio and visual<br />
information, inventory lists <strong>of</strong> damage, and a record <strong>of</strong><br />
dates, times, and flood levels. It is equally important to<br />
document local knowledge on the community’s general<br />
the activities <strong>of</strong> the CFFRMC, their opinions can be noted<br />
and used to evaluate the CFFRMC’s risk management<br />
programme. Alternatively, the programme can be<br />
evaluated through informal interviews with key informants.<br />
The CFFRMC can also choose to assign the evaluation <strong>of</strong><br />
its work to an independent body <strong>of</strong> villagers. This body,<br />
through interviews, questionnaires, and focus discussion<br />
groups, can prepare an independent evaluation report. It<br />
perception <strong>of</strong> the environment before the flash flood.<br />
is also important to evaluate the activities <strong>of</strong> the CFFRMC<br />
from a gender perspective.<br />
144
Day 8<br />
Session 20 Overall Discussion<br />
Time: 60 minutes<br />
Objective<br />
This is an open session. Participants can choose to have a discussion on any one <strong>of</strong> the topics that has been<br />
covered during the training or that is otherwise pertinent to it. Alternatively, if the facilitator sees that there is a<br />
need to revisit a certain topic, he or she can set an agenda for the discussion.<br />
Activities<br />
If there is no outstanding issue to be discussed, the facilitator can use this session as an opportunity to review<br />
some <strong>of</strong> the course material.<br />
Session 20<br />
This is an interactive session; the facilitator can divide the class into three or four different groups (making sure<br />
that, to the extent possible, the groups have participants from each country that is represented in the class).<br />
The facilitator then assigns each group a problem based on any one <strong>of</strong> the themes covered in the training<br />
sessions or based on the field observations. It must be a practical problem that demands an integrated<br />
solution – it should not be too long or too complicated and should be a problem that can be worked out in<br />
the 40 minutes allotted.<br />
Each group discusses the problem and comes up with a way <strong>of</strong> approaching it. At the end <strong>of</strong> the allotted time<br />
a spokesperson from each group makes a short (5 minute) presentation to the whole class.<br />
145
<strong>Flash</strong> <strong>Flood</strong> <strong>Risk</strong> <strong>Management</strong> – A <strong>Training</strong> <strong>of</strong> <strong>Trainers</strong> Manual<br />
Session 21 <strong>Training</strong> Evaluation and<br />
Closing Session<br />
Time: 60 minutes<br />
Objective<br />
To evaluate the training and to conclude formally.<br />
Activities<br />
Activity 21.1: <strong>Training</strong> evaluation<br />
Time: 30 minutes<br />
Session 21<br />
This is an informal session. It is expected that the participants will independently and freely evaluate the<br />
training. For this purpose, the facilitator can prepare a semi-open-ended questionnaire (for example,<br />
Handout 21.1). The questionnaire can cover different aspects <strong>of</strong> the training such as: How well prepared<br />
were the resource persons? How effective were the training methods and materials? Was enough time<br />
allotted for discussions and sharing? Were the logistics and other practical aspects <strong>of</strong> the training adequate?<br />
What is their overall assessment <strong>of</strong> the training?<br />
The participants are asked to fill out the evaluations and return them to the facilitator.<br />
The facilitators should scrutinise the evaluations to see what improvements can be incorporated in future<br />
training courses.<br />
Activity 21.2: Closing session<br />
Time: 30 minutes<br />
The closing session is a formality that provides an opportunity to give thanks and to distribute the certificates.<br />
Each facilitator can design the closing ceremony as he or she sees fit. Below is a list <strong>of</strong> suggested<br />
components.<br />
• Closing remarks: The facilitator can decide who should say a few words.<br />
• Participants’ feedback on training: This can be a short informal question and answer session, or the<br />
facilitator can choose to summarise the feedback given on the evaluation forms.<br />
• Distribution <strong>of</strong> certificates: The facilitator should see beforehand that these are printed and filled out<br />
appropriately.<br />
• Vote <strong>of</strong> thanks.<br />
146
Day 8<br />
Session 21 Handouts<br />
Handout 21.1 <strong>Training</strong> evaluation form<br />
Title <strong>of</strong> the workshop:<br />
Date:<br />
Resource persons:<br />
Please indicate your impression on the items listed below. Place a check in<br />
the box against each statement as applicable; 5 signifies the highest rating<br />
and 1 signifies lowest rating.<br />
A. Curriculum<br />
1. The objectives <strong>of</strong> the workshop were relevant and followed.<br />
2. The materials distributed were adequate and useful.<br />
3. I will be able to apply what I learned.<br />
4. The content was well organised and easy to follow.<br />
B. Resource persons<br />
1. The instructions were clear.<br />
2. The presentations were interesting and practical.<br />
3. The resource person(s) met the training objectives.<br />
4. Participation and interaction were encouraged.<br />
5. Adequate time was provided for questions and clarifications.<br />
6. Adequate time was provided for group work.<br />
7. The resource persons were knowledgeable.<br />
C. The workshop<br />
1. How do you rate the training overall?<br />
2. Will the training help you to do your job better?<br />
D. Additional comments<br />
1. What did you find most useful?<br />
2. What did you find least useful?<br />
3. What were topics you would like to see added?<br />
4. How far did the training meet your expectations?<br />
5. How was the field visit? Was it relevant to the course?<br />
6. Other comments<br />
Rating<br />
1 2 3 4 5<br />
Session 21<br />
147
<strong>Flash</strong> <strong>Flood</strong> <strong>Risk</strong> <strong>Management</strong> – A <strong>Training</strong> <strong>of</strong> <strong>Trainers</strong> Manual<br />
References<br />
ADPC (2003) Project completion report <strong>of</strong> Bangladesh Urban Disaster Mitigation Project. Project Report<br />
No. 5. Bangkok, Thailand: Asian Disaster Preparedness Center and CARE-Bangladesh<br />
ADPC/ECHO/UNESCAP (2004) Community-based disaster risk management, field practitioner’s handbook.<br />
Bangkok, Thailand: Asian Disaster Preparedness Center<br />
ADPC/UNDP (2005) A primer for integrated flood risk management in Asia (2). Bangkok, Thailand: Asian<br />
Disaster Preparedness Center and United Nations Development Programme<br />
Alexander, D (1993) Natural disasters. New York, USA: Chapman and Hall<br />
Bajracharya, B; Shrestha, AB; Rajbhandari, L (2007a) ‘Glacial lake outburst floods in the Sagarmatha region:<br />
Hazard assessment using GIS and hydrodynamic modelling.’ Mountain Research and Development 27:<br />
336–344<br />
Bajracharya, SR; Mool, PK; Shrestha, BR (2007b) Impact <strong>of</strong> climate change on Himalayan glaciers and<br />
glacial lakes: Case studies <strong>of</strong> GLOF and associated hazards in Nepal and Bhutan. Kathmandu, Nepal:<br />
ICIMOD<br />
Bhatta, B; Chalise, S; Myint, AK; Sharma, PN (1999) Recent concepts, knowledge, practices and new skills in<br />
participatory integrated watershed management: Participatory Watershed <strong>Management</strong> <strong>Training</strong> in Asia.<br />
Kathmandu, Nepal: ICIMOD<br />
Blakie, P; Cannon, T; Davis, I; Wisner, B (1994) At risk: Natural hazards, people’s vulnerability and disasters.<br />
London, UK: Routledge<br />
Brilly, M (2001) ‘The integrated approach to flash flood management.’ In Gruntfest, E; Handmer, J (eds),<br />
Coping with flash floods, pp 103–114. Dordrecht, Netherlands: Kluwer Academic Publishers<br />
Chalise, SR; Khanal, NR (2001) ‘An introduction to climate, hydrology and landslide hazards in the Hindu<br />
Kush-Himalayan region: Landslide hazard mitigation in the Hindu Kush-Himalaya’. In Tianchi, L; Chalise,<br />
SR; Upreti, BN (eds) Landslide hazard mitigation in the Hindu Kush-Himalaya, pp 51–62. Kathmandu,<br />
Nepal: ICIMOD<br />
Chow, VT (1984) Handbook <strong>of</strong> applied hydrology: A compendium <strong>of</strong> water resources technology. New York,<br />
USA: McGraw-Hill<br />
Chow, VT; Maidment, DR; Mays, LW (1988) Applied hydrology. Singapore: McGraw-Hill<br />
Colombo, AG; Hervas, J; Arellano, ALV (2002) Guidelines on flash flood prevention and mitigation. Ispra,<br />
Italy: NEDIES<br />
Costa, JE (1983) ‘Paleohydraulic reconstruction <strong>of</strong> flash-flood peaks from boulder deposits in the Colorado<br />
Front Range.’ Geological Society <strong>of</strong> America Bulletin 94: 986–1004<br />
Costa, JE; Schuster, RL (1988) ‘The formation and failure <strong>of</strong> natural dams.’ Geological Society <strong>of</strong> America<br />
Bulletin 100: 1054–1068<br />
Cutter, SL (1996) ‘Vulnerability to natural hazards.’ Progress in Human Geography 20: 529–539<br />
Dekens, J (2007) The river and the snake don’t run straight: Local knowledge on flood preparedness in the<br />
astern Terai <strong>of</strong> Nepal. Kathmandu, Nepal: ICIMOD<br />
Deoja, B; Dhital, M; Thapa, B; Wagner, A (1991) Mountain risk engineering handbook, subject background:<br />
Part I. Kathmandu, Nepal: ICIMOD<br />
Domroes, M (1979) ‘Temporal and spatial variations <strong>of</strong> rainfall.’ Journal <strong>of</strong> Nepal Research Centre 2: 49–67<br />
Dunning, SA; Rosser, NJ; Petley, DN; Massey, CR (2006) ‘Formation and failure <strong>of</strong> the Tsatichhu landslide<br />
Dam, Bhutan.’ Landslides 3: 107–113<br />
Gardner JS; Dekens, J (2007) ‘Mountain hazards and the resilience <strong>of</strong> social-ecological systems: Lessons<br />
learned in India and Canada.’ Natural Hazards 41: 317–336<br />
Gouldby, B; Samuals, P (2005) Language <strong>of</strong> risk. Wallingford, USA: <strong>Flood</strong> Site<br />
148
References<br />
HAA (2002) 100 ways to energize groups: Games to use in workshops, meetings and the community.<br />
Brighton, UK: International HIV/AIDS Alliance<br />
Heyman, BN; Davis, C; Krumpe, PF (1991) ‘An assessment <strong>of</strong> worldwide disaster vulnerability.’ Disaster<br />
<strong>Management</strong> 4: 1–23<br />
Huggel, C; Kääb, A; Haeberli, W; Teysseire, P; Paul, F (2002) ‘Remote sensing based assessment <strong>of</strong> hazards<br />
from glacial lake outbursts: A case study in the Swiss Alps.’ Canadian Geotechnical Journal 39: 316–330<br />
ICIMOD (2007) Inventory <strong>of</strong> glaciers, glacial lakes, and identification <strong>of</strong> potential glacial lake outburst floods<br />
(GLOFs) affected by global warming in the mountains <strong>of</strong> Himalayan Region. Kathmandu, Nepal<br />
ICIMOD (2009) Mountain development resource book for Afghanistan. Kathmandu, Nepal: ICIMOD<br />
IDNDR (1997) Guiding principles for effective early warning. Geneva, Switzerland: United Nations<br />
International Decade for Natural Disaster Reduction<br />
Ives, JD (1986) Glacial lake outburst floods and risk engineering in the Himalaya. Kathmandu, Nepal:<br />
ICIMOD<br />
Ives, JD; Shrestha, RB; Mool, PK (2010) Formation <strong>of</strong> glacial lakes in the Hindu Kush-Himalayas and GLOF<br />
risk assessment. Kathmandu, Nepal: ICIMOD<br />
Jonkman, SN (2005) ‘Global perspectives on loss <strong>of</strong> human life caused by floods.’ Natural Hazards 34:<br />
151–175<br />
Kelsch, M; Caporali, E; lanza, LG (2001) ‘Hydrometeorology <strong>of</strong> flash floods.’ Gruntfest, E; Handmer, J (eds),<br />
Coping with flash floods, pp 19–35. Dordrecht, Netherlands: Kluwer Academic Publishers<br />
Li, T (1999) ‘Bioengineering for landslide control for upland watersheds.’ In Bhatta, BR; Chalise, SR; Myint,<br />
AK; Sharma, PN (eds), Recent concepts, knowledge, practices and new skills in participatory integrated<br />
watershed management: Participatory watershed management training in Asia (PWMTA), pp 81–86.<br />
Kathmandu, Nepal: ICIMOD<br />
Mavis, ID; Laushey, LM (1949) ‘Formula for velocity <strong>of</strong> beginning <strong>of</strong> Bedload movement is reappraised.’ Civil<br />
Engineering 19: 38-39<br />
Mehta, M (2007) ‘Gender and natural disasters: New challenges for mountain development.’ Disaster<br />
Preparedness 53: 17–19<br />
Mei’e, R; Renzhang, Y; Haoshend, B (1985) An outline <strong>of</strong> China’s physical geography. Beijing, China:<br />
Foreign Language Press<br />
Messner, F; Meyer, V (2005) <strong>Flood</strong> damage, vulnerability and risk perceptions: Challenge for flood damage<br />
research. Leipzig, Germany: UFZ-Umweltforschungszentrum Leipzy-Halle<br />
Mizuyama, T; Satohuka, Y; Ogawa, K; Mori, T (2006) Estimating the outflow discharge rate from landslide<br />
dam outbursts, disaster mitigation <strong>of</strong> debris flows, slope Failures and landslides. Tokyo, Japan: Universal<br />
Academy Press<br />
Parker, DJ (ed) (2000) <strong>Flood</strong>s. 2 Vols. London, UK: Routledge<br />
Pike, B; Busse, C (2004) 101 more games for trainers. Amherst (MA), USA: HRD Press<br />
Popov, N (1991) ‘Assessment <strong>of</strong> glacial debris flow hazard in the North Tien-Shan.’ In Proceedings <strong>of</strong> the<br />
Soviet-China-Japan Symposium and Field Workshop on Natural Disasters, 2–17 September 1991, Tian-<br />
Shan, pp 384–391. Shanghai, USSR: Dushanbe and Kazselezashchita<br />
Rambaldi, G; Kwaku Kyem, AP; Mbile, P; McCall, M; Weiner, D (2006) ‘Participatory spatial information<br />
management and communication in developing countries.’ Electronic Journal <strong>of</strong> Information Systems in<br />
Developing Countries 25(1): 1–9<br />
RGSL (2003) Methods <strong>of</strong> glacier and lake inventory compilation with specific reference to hazard assessment.<br />
Flintshire, UK, Reynolds Geo-sciences Limited<br />
Richardson, SD; Reynolds, JM (2000) ‘An overview <strong>of</strong> glacial hazards in the Himalayas.’ Quarternary<br />
International 65/66(1): 31–47<br />
Shamshad, KM (1988) The meteorology <strong>of</strong> Pakistan. Karachi, Pakistan: Royal Book Company<br />
Shields A (1936) Andwendung der ahnlichkeits-mechanik und der turbalenzforschung auf die<br />
geschiebebewungung. Berlin, Germany: Mitteilung der Preussischen Versuchsanstalt fur Wasserbau und<br />
Schiffbau (in German)<br />
Shrestha, AB (2008) Resource manual on flash flood risk management, Module 2: Non-structural measures.<br />
Kathmandu, Nepal: ICIMOD<br />
149
<strong>Flash</strong> <strong>Flood</strong> <strong>Risk</strong> <strong>Management</strong> – A <strong>Training</strong> <strong>of</strong> <strong>Trainers</strong> Manual<br />
Shrestha, AB; Bajracharya, B; Rajbhandari, L (2006) ‘Glacier lake outburst flood hazard mapping <strong>of</strong><br />
agarmatha National Park.’ In Sharma, KP; Jha, R (eds), Workshop on <strong>Flood</strong> Forecasting <strong>Management</strong> in<br />
Mountainous Areas, pp 228-242. Kathmandu, Nepal: Department <strong>of</strong> Hydrology and Meteorology<br />
Shrestha, AB; Shah, SH; Karim, R (2008) Resource manual on flash flood risk management, Module 1:<br />
Community-based management. Kathmandu, Nepal: ICIMOD<br />
Shrestha, AB; Shrestha, SD (2008) <strong>Flash</strong> flood risk in the Hindu Kush-Himalayas: Causes and management<br />
options. Paper presented at the International Conference on Disaster and Development: Bridging the Gap<br />
between Theory and Practice, 23–24 November, Kathmandu, Nepal<br />
Strand, RI (1977) Sedimentation in design <strong>of</strong> small dams. Washington, USA: U.S Bureau <strong>of</strong> Reclamation<br />
Swaminathan, MS (1980) ‘Plant breeding in India: Some experiments and ecological experiences in the<br />
North Eastern hill region’ In Singh, T; Kau, J (eds), Studies in Himalayan Ecology and Development<br />
Strategies, pp 152–172. New Delhi: The English Book Store<br />
UCAR (2010) <strong>Flash</strong> flood early warning system reference guide. Silver Spring, Maryland, USA: University<br />
Corporation for Atmospheric Research and National Oceanic and Atmospheric Adminis tration<br />
UN (1992a) The Rio Declaration on Environment and Development (1992). New York, USA: United Nations<br />
UN (1992b) United Nations Framework Convention on Climate Change. New York, USA: United Nations<br />
UN (2005) Convention on the Law <strong>of</strong> the Non-navigational Uses <strong>of</strong> International Watercourses 1997. New<br />
York, USA: United Nations<br />
UNESCO-IHP (2007) International flood initiative. Paris: UNESCO-IHP<br />
UNISDR (2005) Hyogo Framework for Action 2005-20015. Presented at World Conference on Disaster<br />
Reduction, Kobe. Hyogo, Japan: United Nations International Strategy for Disaster Reduction<br />
UNISDR (2009) UNISDR terminology on disaster risk reduction. Geneva, Switzerland: United Nations<br />
International Strategy for Disaster Reduction<br />
USACE/HEC (2011) ‘HEC-HMS.’ Davis, California, USA: US Army Corps <strong>of</strong> Engineers, Hydrologic<br />
Engineering Center. Online: www.hec.usace.army.mil/s<strong>of</strong>tware/hec-hms (accessed 20/05/2011)<br />
USGS (no date) Surface-water field techniques: Verified roughness characteristics <strong>of</strong> natural channels.<br />
Washington, DC, USA: United States Geological Survey. Online resource: wwwrcamnl.wr.usgs.gov/sws/<br />
fieldmethods/Indirects/nvalues/index.htm (Accessed May 2007)<br />
Wagley, M (1999) ‘Bioengineering practices for soil and water conservation.’ In Bhatta, BR; Chalise, SR;<br />
Myint, AK; Sharma, PN (eds), Recent concepts, knowledge, practices and new skills in participatory<br />
integrated watershed management: Watershed <strong>Management</strong> <strong>Training</strong> in Asia (PWMTA), pp 77–80.<br />
Kathmandu, Nepal: ICIMOD<br />
Watts, MJ; Bohle, HG (1993) ‘The space <strong>of</strong> vulnerability: The casual structure <strong>of</strong> hunger and famine.’ Progress<br />
in Human Geography 17: 43–67<br />
WECS (1987) Erosion and sedimentation in Nepal. Kathmandu, Nepal: Water and Energy Commission<br />
Secretariat<br />
Weichselgartner, J (2001) Naturgefahren als soziale Konstruktion. PhD thesis, University <strong>of</strong> Bonn, Faculty <strong>of</strong><br />
Mathematics and Natural Sciences, Bonn, Germany<br />
West, E (1999) The big book <strong>of</strong> icebreakers: Quick fun activities for energizing meetings and workshops.<br />
New York, USA: McGraw-Hill<br />
Williams, GP (1983) ‘Paleohydrological methods and some examples from Swedish fluvial environments I.<br />
Cobble and Boulder Deposits.’ Geografi ska Annaler 65A: 227–243<br />
WMO (2006) Legal and institutional aspects <strong>of</strong> integrated flood management. APFM Technical Document<br />
No 2, <strong>Flood</strong> <strong>Management</strong> Policy Series. Geneva, Switzerland: World Meteorological Organization,<br />
Associated Programme on <strong>Flood</strong> <strong>Management</strong><br />
WMO (2009) Integrated flood management. APFM Concept Paper. Geneva, Switzerland: World<br />
Meteorological Organization, Associated Programme on <strong>Flood</strong> <strong>Management</strong><br />
Xu, Jianchu; Eriksson, M; Ferdinand, J; Merz, J (2006) Managing flash floods and sustainable development in<br />
the Himalayas: International Workshop on <strong>Flash</strong> <strong>Flood</strong>s. Kathmandu, Nepal: ICIMOD<br />
Zurick, D; Pacheco, J; Shrestha, B; Bajracharya, B (2006) Atlas <strong>of</strong> the Himalaya. Kathmandu, Nepal:<br />
ICIMOD<br />
150
<strong>Flash</strong> <strong>Flood</strong> <strong>Risk</strong> <strong>Management</strong> – A <strong>Training</strong> <strong>of</strong> <strong>Trainers</strong> Manual<br />
session 6<br />
152<br />
© ICIMOD 2011<br />
International Centre for Integrated Mountain Development<br />
GPO Box 3226, Kathmandu, Nepal<br />
Tel +977-1-5003222 Fax +977-1-5003299<br />
Email info@icimod.org Web www.icimod.org<br />
ISBN 978 92 9115 222 3