

ADB_book_18 April.qxp - Himalayan Document Centre - icimod
ADB_book_18 April.qxp - Himalayan Document Centre - icimod
ADB_book_18 April.qxp - Himalayan Document Centre - icimod
- No tags were found...

Create successful ePaper yourself
Turn your PDF publications into a flip-book with our unique Google optimized e-Paper software.
About the OrganisationsAsian Development BankThe Asian Development Bank (<strong>ADB</strong>)’s work is aimed at improving the welfare of the people of the Asiaand Pacific region, particularly for the 1.9 billion who live on less than $2 a day. Despite the success stories, Asiaand Pacific remains home to two thirds of the world’s poor.<strong>ADB</strong> is a multilateral development finance institution owned by 64 members, 46 from the region and <strong>18</strong>from other parts of the globe. <strong>ADB</strong>’s vision is a region free of poverty. Its mission is to help its developingmember countries reduce poverty and improve their quality of life.<strong>ADB</strong>’s main instruments in providing help to its developing member countries are policy dialogues, loans,technical assistance, grants, guarantees, and equity investments. <strong>ADB</strong>’s annual lending volume is typically about$6 billion, with technical assistance provided usually totaling about $<strong>18</strong>0 million a year.<strong>ADB</strong>’s headquarters is in Manila. It has 26 offices around the world. The organization has more than 2,000employees from over 50 countries.International <strong>Centre</strong> for Integrated Mountain DevelopmentThe International <strong>Centre</strong> for Integrated Mountain Development (ICIMOD) is an independent ‘MountainLearning and Knowledge <strong>Centre</strong>’ serving the eight countries of the Hindu Kush-Himalayas – Afghanistan,Bangladesh, Bhutan, China, India, Myanmar, Nepal, and Pakistan – and the global mountain community.Founded in 1983, ICIMOD is based in Kathmandu, Nepal, and brings together a partnership of regional membercountries, partner institutions, and donors with a commitment for development action to secure a better futurefor the people and environment of the Hindu Kush-Himalayas. ICIMOD’s activities are supported by its coreprogramme donors: the Governments of Austria, Denmark, Germany, Netherlands, Norway, Switzerland, and itsregional member countries, along with over thirty project co-financing donors. The primary objective of the<strong>Centre</strong> is to promote the development of an economically and environmentally sound mountain ecosystem andto improve the living standards of mountain populations.
EnvironmentAssessment of NepalEmerging Issues and ChallengesInternational <strong>Centre</strong> for Integrated Mountain Development
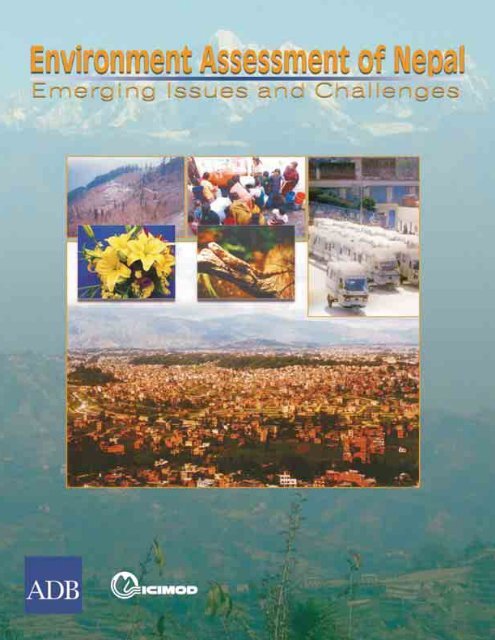
© 2006 International <strong>Centre</strong> for Integrated Mountain DevelopmentAsian Development BankAll rights reserved. Published 2006.Cover photo:Background - View of the Kathmandu Valley (M. Bajracharya)Inset - Clockwise from top left - Deforestation (NEFEJ);Water Scarcity (M. Bajracharya); SAFA Tempos (B. Pradhan);Biodiversity (ICIMOD file photo)This publication was prepared by staff and consultants of theInternational <strong>Centre</strong> for Integrated Mountain Development (ICIMOD)in collaboration with Asian Development Bank (<strong>ADB</strong>).The views expressed in this <strong>book</strong> are those of the authors and do notnecessarily reflect the views and policies of the <strong>ADB</strong> or its Board ofGovernors or the governments they represent, or of ICIMOD.Use of the term “country”, or borders shown on maps, do not implyany judgment by the authors, ICIMOD, or the <strong>ADB</strong> as to the legal orother status of any territorial entity or area of its authorities, orconcerning the delimitation of its frontiers or boundaries.ICIMOD and <strong>ADB</strong> do not guarantee the accuracy of the data includedin this publication and accept no responsibility for any consequenceof their use.Asian Development BankICIMODNepal Resident MissionKhumaltar, LalitpurSrikunj, Kamaladi, Ward No. 31 GPO Box 3226Post Box 5017Kathmandu, NepalKathmandu, Nepal Tel (+977 1) 5525313Tel: +977 1 422 7779 Fax (+977 1) 5524509Fax: +977 1 422 5063<strong>icimod</strong>@<strong>icimod</strong>.orgadbnrm@adb.orgwww.<strong>icimod</strong>.orgwww.adb.org/nrmAsian Development Bank/ICIMOD. 2006. Environment Assessment ofNepal: Emerging Issues and Challenges. Kathmandu.Printed in NepalISBN-10 92-9115-004-5 (printed)ISBN-13 978-92-9115-004-5 (printed)ISBN-10 92-9115-005-3 (electronic)ISBN-13 978-92-9115-005-2 (electronic)Publication Stock No. 020706
ForewordThe critical role of the environment in enabling and sustaining poverty reduction is magnified withinmountainous ecosystems such as those found in Nepal. For this reason, the International <strong>Centre</strong> forIntegrated Mountain Development (ICIMOD) was engaged to work with the Asian Development Bank(<strong>ADB</strong>) and the Government of Nepal to develop this publication.The <strong>ADB</strong>’s environment policy requires environmental considerations to be mainstreamed not only intoinvestment projects but also into <strong>ADB</strong>’s country and sector strategies. This important thematic work—thecountry environmental analysis (CEA)—informed <strong>ADB</strong>’s current country strategy and program for Nepal, andprovided the basis for the present publication.The CEA provides an analysis of environmental status and trends in the country; the policy, legal andinstitutional framework for environmental management; and major environmental issues and opportunities.Review of available documents, update of the relevant information, and consultations with relevantstakeholders were conducted while undertaking the CEA and preparing this publication.This publication also serves to demonstrate <strong>ADB</strong>’s and ICIMOD’s strong commitment to developing southAsia’s environment knowledge base further, to disseminating the information widely, and to providing criticallyneeded environment assessment information to policy makers, researchers and development practitioners forthe development of economically and environmentally sound ecosystems while improving the living standardsof mountain populations.The report contains a wealth of data and information and highlights key environmental issues, emergingproblems, and strategic priority areas. It seeks to provide a critical analysis of the impacts of policy, the status ofenvironmental governance, and financing mechanisms.This publication is the result of close collaboration between <strong>ADB</strong> and ICIMOD. Sungsup Ra, the SeniorProgram Specialist, and Nogendra Sapkota, Social and Environment Officer, Nepal Resident Mission (NRM),supervised the study on behalf of <strong>ADB</strong>. Basanta Shrestha and Bidya Banmali Pradhan provided overall guidanceto the ICIMOD team of consultants comprising Mahesh Banskota, Govinda Raj Bhatta, Bandana Pradhan, andDrona Ghimire. We believe that this publication will be used widely within and beyond Nepal.____________ ________________ __________________Kunio Senga Sultan Hafeez Rahman J. Gabriel CampbellDirector General Country Director Director GeneralSouth Asia Department Nepal Resident Mission International <strong>Centre</strong> forAsian Development Bank Asian Development Bank Integrated Mountain Development
AcknowledgementsWe would like to extend our sincere gratitude to Mahesh Banskota (Chapters 11 and 12), Govinda RajBhatta (Chapters 9 and 10), Bandana Kayastha Pradhan (Chapters 2, 3, 4, and 5), and Drona Raj Ghimire(Chapters 6 and 8), the consultants who prepared the original chapters for this publication and whowent out of their way to respond to queries and requests for material. Special thanks go to Bidya BanmaliPradhan and Mahesh Banskota for compiling the report. The overall guidance from Basanta Shrestha and BidyaBanmali Pradhan, International <strong>Centre</strong> for Integrated Mountain Development (ICIMOD), and from Sungsup Raand Nogendra Sapkota, Asian Development Bank (<strong>ADB</strong>), is also deeply appreciated. Bidya Banmali Pradhan andBasanta Shrestha also prepared Chapters 7 and 13 respectively.Many institutions provided access to data and information, much of it unpublished. Our special thanks goto the staff of the National Planning Commission, the Ministry of Environment, Science and Technology, theMinistry of Forest and Soil Conservation, and the Central Bureau of Statistics.We thank Batu Upreti and Sher Jung Shah, previously at the Ministry of Population and Environment, for thevaluable suggestions they provided during the preparation of the report.Several organizations and individuals provided photographs for use in this report and we thank them all,with special thanks to Rakesh Y. Shrestha of Practical Action and Deependra Joshi of the World ConservationUnion (IUCN). As far as possible all sources have been credited, we apologize if any were overlooked.This publication is an outcome of the country environmental analysis (CEA) undertaken by ICIMOD for<strong>ADB</strong>, and we wish to acknowledge the contribution of all those who contributed to the preparation of the CEAreport.This report could not have been prepared without the support of the staff of ICIMOD’s MountainEnvironment Natural Resources Information Systems (MENRIS) Division, in particular Gauri Dangol whoprepared many maps and figures.The extensive input of the Publications Unit in ICIMOD’s Information Management, Communications andOutreach Section is gratefully acknowledged, in particular A. Beatrice Murray, the Senior Editor, Dharma R.Maharjan, who did the layout and design, and Asha Kaji Thaku, Cartographer/Artist. Matthew Zalichin, theconsultant editor, made many valuable suggestions.Finally the support of the <strong>ADB</strong> Publications Unit led by Kavita Sherchan was much appreciated. Theassistance provided by Arun Rana, <strong>ADB</strong>, editorial consultant, was crucial for preparing the publication in its finalform.
Acronyms and AbbreviationsACAP<strong>ADB</strong>ARIBODBOD5CBSCCCMCEACFUGCHPCITESCOCODCOPDDANIDADDCDFIDDOEIAESPSEUFYGATTGDPGEFGFD3GISGLOFGTZHDIHEIICIMODIEEINGOIUCNLDFLPGMDGMOESTMOFSCMOPEmaslNEANGONLSSNO 2NO XNORADNPCNTFPODSOPDPM10Annapurna Conservation Area ProjectAsian Development Bankacute respiratory infectionbiological oxygen demandbiological oxygen demand (over 5 days)Central Bureau of StatisticsCanadian Climate Change Modelcountry environmental analysiscommunity forest user groupChilime Hydroelectric ProjectConvention on International Trade in Endangered Species of Wild Fauna and Floracarbon monoxidechemical oxygen demandchronic obstructive pulmonary diseaseDanish International Development Agencydistrict development committeeUK Department for International Developmentdissolved oxygenenvironmental impact assessmentEnvironment Sector Programme SupportEuropean Unionfiscal yearGeneral Agreement on Tariffs and Tradegross domestic productGlobal Environment Facilitygeophysical fluid dynamics modelgeographic information systemglacial lake outburst floodGerman Technical Cooperationhuman development indexhuman empowerment indexInternational <strong>Centre</strong> for Integrated Mountain Developmentinitial environmental examinationinternational nongovernment organizationWorld Conservation Unionlocal development feeliquefied petroleum gasMillennium Development GoalsMinistry of Environment, Science and TechnologyMinistry of Forest and Soil ConservationMinistry of Population and Environmentmeters above sea levelNepal Electricity Authoritynongovernment organizationNepal Living Standards Surveynitrogen dioxidenitrogen oxidesNorwegian Agency for Cooperation and DevelopmentNational Planning Commissionnon-timber forest productozone depleting substanceoutpatient departmentparticulate matter of diameter 10 microns or less
PM2.5PAHRSSAARCSACEPSEASO 2TSPUKUNDPUNEPUSVDCWEPCOWHOWTOparticulate matter of diameter 2.5 microns or lesspolyaromatic hydrocarbonremote sensingSouth Asian Association for Regional CooperationSouth Asia Cooperation for Environment Programmestrategic environmental assessmentsulfur dioxidetotal suspended particlesUnited KingdomUnited Nations Development ProgrammeUnited Nations Environment ProgrammeUnited States (of America)village development committeeWomen Environment Preservation CommitteeWorld Health OrganizationWorld Trade OrganizationWeights and MeasuresdBAGJGWGWhGWh/ykWhmldppbpphppmdecibels AGigajoulesGigawattgigawatt-hourGigawatt hour per yearkilowatt-hourmillion liters per dayparts per billionpersons per hectareparts per millionCurrency Equivalent(As of 28 February 2006)Currency Unit—Nepalese rupees (NRs)$1 = NRs 70.75Notes(i) The Nepalese calendar year (B.S.) runs from mid <strong>April</strong> to mid <strong>April</strong>. Unless otherwise stated, year rangeswritten in the form 2005/06 denote a single calendar year.(ii) The fiscal year (FY) of the Government ends on 15 July. FY before a calendar year denotes the year in whichthe fiscal year ends. (For example, FY2000 begins on 16 July 1999 and ends on 15 July 2000.)(iii) In this report, $ refers to US dollars.(iv) In this report, tons (t) refer to metric tons or tonnes (1,000kg).(v) Acts and Regulations are cited under the name of the ministry from which they originate. The officialversion of Acts and Regulations is published in the Nepal Gazette (in Nepali). Some Acts and Regulationsare published by other Government agencies in English (unofficial translations).
ContentsForewordAcknowledgementsAcronyms and AbbreviationsChapter 1: Overview 1Introduction 1Organization 1Chapter 2: Rural Environment, Poverty, and Livelihood 5Introduction 5Rural Population 5Rural Settlement 9Rural Infrastructure and Services 12Health and Sanitation 16Poverty 21Livelihoods 23Summary 28Bibliography 29Chapter 3: Land Resources and Land Degradation 31Land Resources 31Land Degradation 32Land Degradation Control Measures 36Natural Disasters and Vulnerability 36Bibliography 37Chapter 4: Forestry and Biodiversity 39Forestry 39Biodiversity 42Summary 45Bibliography 47Appendix 4.1: Forests and Other Ecosystems by Region 49Appendix 4.2: Protected Plant and Wildlife Species 52Chapter 5: Water Resources 55Introduction 55Surface Water Discharge 55Use of Water Resources 56Sources, Quantity, and Quality of Drinking Water 56Sanitation 60Public Health Impacts 60Wetlands 61Aquatic Biodiversity 61Efforts in Water Supply and Sanitation Improvement and Management 62Bibliography 63
Chapter 6: Energy Resources 65Introduction 65Sources and Consumption Patterns 65Hydropower 67Alternative Energy 71Energy and Environment 74Bibliography 80Chapter 7: Air Pollution and Climate Change 81Introduction 81Status and Trends of Ambient Air Pollution in Nepal 81Indoor Air Quality 85Transboundary Air Pollution 86Sources of Emissions 87Impact of Air Pollution 90Climate and Climate Change 91Policy Response 95Conclusion 96Bibliography 97Appendix 7.1: World Health Organization Guideline Values 102Chapter 8: Urban Environment 103Introduction 103Urban Growth and Features 103Urban Infrastructure 106Urban Environmental Concerns 108Policies and Initiatives 113Future Directions 115Bibliography 117Chapter 9: Environmental Governance 119Introduction 119Environmental Governance in Nepal 119Environmental Policies, Plans, and Programs in Nepal 119Effectiveness of Environmental Policies, Plans and Programs 124Regulatory Framework 124International Commitments 125Sub-regional Linkages 126Enforcement of Environmental Laws and Standards 126Major Stakeholders 127Role of Key Environmental Stakeholders 128Overall Performance of Environmental Governance 131Bibliography 135Appendix 9.1: Environmental Standards Developed by Different Public Sector Agencies in Nepal 137Appendix 9.2: Some Major Environment-related International Conventions Participated in by Nepal 139Appendix 9.3: Some Prominent Environmental NGOs in Nepal 142Chapter 10: Environmental Financing 143Introduction 143Domestic Sources 143External Sources 150Tariffs and Subsidies 150Conclusion 154Bibliography 154
Chapter 11: Environment and Conflict: A Review of Nepal’s Experience 155Introduction 155Environment, Resource Scarcity, and Conflict 155Theories Behind Environmental Conflict 157Environmental Conflict in Nepal: The Overall Context 159Forest Resources and Conflicts 160Water Resources and Conflict 164Urban Environment and Conflicts 168The Maoist Insurrection and the Environment 169Conclusions 170Bibliography 171Chapter 12: Environment and Trade 175Introduction 175Trade, Environment, and Sustainable Development 176Nepal and Multilateral Environmental Agreements 178WTO and Nepal <strong>18</strong>0Nepal’s Changing Pattern of Trade and its Environmental Aspects <strong>18</strong>2Future Implications for Nepal 190Bibliography 191Chapter 13: Environmental Information, Analysis, and Integration 193Introduction 193Issues Related to Environmental Information 194Status of Environmental Data and Information in Nepal 196Integration and Analysis of Environmental Information 199Conclusions: Challenges in Environmental Information 202Bibliography 205Chapter 14: Emerging Priorities 207Introduction 207Promoting Integrated Ecosystem Management and Sustainable Livelihoods 207Promoting Integrated Urban Environmental Management 209Institutional Strengthening and Capacity Building 211Environmental and Natural Resources Information Network 214Bibliography 215Appendix 14.1: List of Key Environmental Laws and Related Legislation in Nepal 216Appendix 14.2: Some Common Constraints Faced by Nepal in Implementation of Environmental ImpactAssessment: Operational Problems and their Solutions 217Annex: Millennium Development Goals and the Environment in Nepal 219
List of FiguresFigure 2.1: People and Conservation Improving Livelihood and Ecosystems 5Figure 2.2: National, Rural, and Urban Population Growth Rates, Nepal 6Figure 2.3: Contributions by the Primary and Non-primary Production Sectors to National GDP 25Figure 2.4: Trends in Cultivated Area of Selected Crops, Nepal (1996-2002) 27Figure 3.1: Land Degradation and Financial Loss Due to Floods and Landslides 33Figure 4.1: Protected Areas in Nepal 43Figure 5.1: Water Quality Change in the Bagmati River, Kathmandu Valley 58Figure 5.2: Proportion of Water-related Diseases to Total Outpatient Department Visits, Nepal 61Figure 6.1: Power Development Map of Nepal: Major Power Stations, Transmission lines, and Substations 75Figure 7.1: Environment Sector Program Support (ESPS) Monitoring Stations 82Figure 7.2: Concentration of PM2.5 and PM10 in Kathmandu (2003/04) 83Figure 7.3: Average Air Quality, January to December 2003 84Figure 7.4: NO 2 values in the Kathmandu Valley 84Figure 7.5: SO 2 values at different sites in Kathmandu 84Figure 7.6: Benzene Concentration in Kathmandu Valley 85Figure 7.7: Polyaromatic Hydrocarbons (PAH) Level 85Figure 7.8: LIDAR Observation 87Figure 7.9: Vehicle Registered in Nepal 88Figure 7.10: Pollutants Monitored at Tikathali 89Figure 7.11: Total Energy Consumption by Residential Sector 89Figure 7.12: Air Pollution Level in Kathmandu and Incidence of Chronic Distructive Pulmonary Disease(COPD) Patients as a Percentage of All Patients 91Figure 7.13: Observed Mean Annual Temperature Trend (°C) per Decade for the Period [1981-1998] 92Figure 7.14: Mean Annual Precipitation 94Figure 7.15: Trends of Annual Precipitation (mm) per Decade for the Period (1981–1998) 94Figure 9.1: The Key Environmental Institutions in Nepal 128Figure 10.1: Development Outlay in Major Sectors (1985–2007) 144Figure 10.2: Program Cost in the Natural Resource Management Sector 144Figure 10.3: Budget Allocation for Different Programs in the Forestry Sector 144Figure 10.4: Government Revenue from Protected Areas (excluding the Annapaurna andManaslu Conservation Areas) 148Figure 10.5: Community Savings and Biodiversity Funds in Protected Areas 149Figure 13.1: Relationships among Indicators, Data, and Information to Meet Users’ Needs 194Figure 13.2: Framework for an Environmental Information Database 195Figure 13.3: Examples of Information Layers for Nepal prepared using data from Government Sources 200Figure 13.4: Mapping of Socioeconomic Indicators Using Census Information – Sources of DrinkingWater 200Figure 13.5: Examples of Environmental Applications of GIS 201Figure 13.6: Examples of Applications of Remote Sensing in Environmental Studies 202Figure 13.7: Framework for Environment and Natural Resources Information and DecisionSupport Systems 203List of TablesTable 2.1: Population Growth Rates 6Table 2.2: Distribution, Density, and Growth of Rural Population by Region 6Table 2.3: Cultivated and Forest Land by Region, Nepal, 2001 7Table 2.4: Literacy Status of the Rural Population (6 years of age and above) 7Table 2.5: Performance of Rural and Urban Areas Regarding Basic Facilities and Development, 2001 8Table 2.6: Migration of Population, Nepal, 2001 9Table 2.7: Rural and Urban Migration by Region, 2001 9Table 2.8: Distribution of Settlement Localities, 1991 and 2001 10Table 2.9: Distribution of Settlement Localities and their Population by Region, 1991 11
Table 2.10: Distribution of Settlement Localities and their Population by Region, 2001 11Table 2.11: Road Density by Region, Rural Area and Urban Area 12Table 2.12: Electricity Connection to Households 13Table 2.13: Irrigation Facilities, 2000 13Table 2.14: Health Service Accessibility 15Table 2.15: Education Accessibility 15Table 2.16: Selected Health Indicators 16Table 2.17: Common Diseases by Region 17Table 2.<strong>18</strong>: Ten Leading Diseases, 2001 17Table 2.19: Incidence of Diarrhea and Acute Respiratory Infection (ARI) per ‘000 PopulationBelow 5 years of Age <strong>18</strong>Table 2.20: Distribution of Households by Main Fuel Used for Cooking <strong>18</strong>Table 2.21: Malnourished Children Below Age 3 (%) <strong>18</strong>Table 2.22: Status and Target of Health-Related Indicators, 2001 <strong>18</strong>Table 2.23: Household Accessibility to Drinking Water by Sources, Nepal 19Table 2.24: Existing and Projected Rural Population Drinking Water Coverage 20Table 2.25: Toilet Accessibility by Region and Rural-Urban Areas 20Table 2.26: Wastewater (Sewage) Generation (‘000m 3 ) 20Table 2.27: Percentage of Households with Access to Sanitary Facilities (Drains) 21Table 2.28: Income Poverty Indicators in 1996 (Poverty Line: NRs 4,404/person/year) 22Table 2.29: Some Indicators of Poverty 22Table 2.30: Poverty and Human Development by Caste and Ethnicity 22Table 2.31: Change in Employment Structure by Major Industries (economically active population10 years of age and above) 24Table 2.32: Percentage Distribution of Economically Active Population by Major IndustrialSectors and Region, 2001 24Table 2.33: Percentage Distribution of Economically Active Population by Major Industrial Sector forRural and Urban Areas, 1991-2001 24Table 2.34: Contribution to GDP by Sector (%) 25Table 2.35: Households Having Agricultural Land, Livestock, and Poultry by Region, 2001 25Table 2.36: Share of Household Income by Source (%) 25Table 2.37: Area and Fragmentation of Landholdings 26Table 2.38: Cultivated Area of Selected Crops by Region (ha) 27Table 2.39: Food Production and Requirement (tons) 27Table 3.1: Agricultural Economic Density, 2001 32Table 3.2: Distribution of Land Uses by Region 32Table 3.3: Change in Agricultural and Forest Lands by Region 33Table 3.4: Estimated Soil Erosion Rates at Selected Sites in Nepal 34Table 3.5: Loss of Lives and Property by Different Types of Disasters in Nepal in 2002 37Table 3.6: Disaster Casualties 1995-2002 37Table 4.1: Distribution of Forest Resources by Region, 2000 39Table 4.2: Change in Forest and Shrub Cover (%) 40Table 4.3: Proportion of Forest Area by Region (ha) 40Table 4.4: Ecosystems in Protected Areas 42Table 4.5: Wetland Types in Nepal 45Table 5.1: Water Discharge of Rivers, Nepal 55Table 5.2: Water Availability and Use by Sectors, Nepal 56Table 5.3: Type of Water Sources Used by Households 57Table 5.4: Household Access to Drinking Water Sources (%) 57Table 5.5: Water Supply and Water Treatment Plants 58Table 5.6: Water Quality of Major Rivers During Dry Season 58Table 5.7: Bacteriological Water Quality of Different Water Sources, Kathmandu Valley 59Table 5.8: Arsenic Sample Tests in Nepal by Different Agencies 59Table 5.9: Water Quality of Shallow Tube Wells in the Terai Region 60Table 5.10: [Theoretical] Sewerage Coverage in Nepal 60Table 5.11: Aquatic Macro-invertebrates in Kathmandu Valley and the Country 62
Table 6.1: Energy Consumption and Per Capita Income 65Table 6.2: Energy Consumption Pattern by Source 1993/94-2002/03 67Table 6.3: Energy Consumption by Sector (‘000 GJ) 67Table 6.4: Share of Energy Consumption by Sector 67Table 6.5: Hydropower Potential 68Table 6.6: Summary of Hydroelectric Development Opportunities 68Table 7.1: Catastrophic Air Pollution Episodes 81Table 7.2: Consumption of Petroleum Products 89Table 7.3: National Ambient Air Quality Standards for Nepal 96Table 7.4: Vehicle Emission Standards for Green Stickers 96Table 8.1: Criteria for Urban Status 104Table 8.2: Summary of Urban Growth Trends in Nepal 1952/54-2001 105Table 8.3: Consolidated Revenues and Expenditures of Municipalities FY2004 114Table 9.1: Environmental Components of National Socioeconomic Development Plans (1956-2007) 120Table 10.1: Major Projects Funded by the National Agricultural Research and Development Fund (NARDF) 146Table 10.2: Annual Income and Expenditure of Community Forestry User Groups (NRs) 148Table 10.3: Users’ Share in Irrigation Project Construction 149Table 10.4: Users’ Share in Benefits from Irrigation Projects 150Table 10.5: Major Grant Projects in the Forestry Sector (as of March 2005) 151Table 10.6: Major Grant Projects in the Agricultural Sector 151Table 10.7: Phase-wise Production of Biogas in Nepal 153Table 10.8: Subsidy Rate for Biogas Plants 154Table 12.1: Direction of Foreign Trade (NRs million) <strong>18</strong>3Table 12.2: Trade/GDP Ratios <strong>18</strong>4Table 12.3: Selected Exports to India (value in NRs ‘000) <strong>18</strong>4Table 12.4: Selected Imports from India (Value in NRs ‘000) <strong>18</strong>5Table 12.5: Percentage Share of Major Commodities in Nepal’s Overseas Exports in FY2004 (2060/61)(NRs ‘000) <strong>18</strong>6Table 12.6: Major Trading Partners of Nepal: Exports (NRs ‘000) <strong>18</strong>6Table 12.7: Major Trading Partners of Nepal: Imports (NRs ‘000) <strong>18</strong>6Table 13.1a: Different Datasets Collected for the Nepal State of the Environment Report 198Table 13.1b: Key to Dataset Sources 198
Chapter 1OverviewIntroductionThere is increasing awareness of the need forreliable environmental information to informpolicy and planning for sustainable development.In many countries, however, it can be difficultto discover sources of, or gain access to, the appropriateinformation—even if it exists.The Asian Development Bank (<strong>ADB</strong>) environmentalpolicy requires environmental considerationsto be mainstreamed into both investment projectsand programs, and country and sector strategies. Asa contribution to this, a country environmentalanalysis (CEA) was prepared in 2004 as an input to<strong>ADB</strong>’s country strategy and program for Nepal. TheCEA was prepared by the International <strong>Centre</strong> forIntegrated Mountain Development (ICIMOD) in linewith its aim as a mountain learning and knowledgecenter to gather and disseminate the informationneeded as a basis for the development ofeconomically and environmentally sound ecosystemswhile improving the living standards ofmountain populations.The CEA report contained a wealth of data andinformation that could be relevant for Governmentagencies, funding agencies, nongovernmentorganizations, academia, and other concernedparties. Thus <strong>ADB</strong> and ICIMOD agreed to develop thereport further and publish it for a wider audience; thepresent publication is the result. The aim was both todisseminate the findings of the CEA report morewidely, and to provide a broad list of sources thatwould provide a starting point for future researchersand practitioners in need of environmental data.Environmental data is still a new andincomplete area in Nepal. It can be difficult both todiscover what data are available and to obtain accessto them. Relevant data are scattered among manyinstitutions, and are often unpublished. There aremany gaps and inconsistencies, problems in dataquality, lack of clear information about methods anddefinitions used, lack of time series, and lack ofcomparability between different data sets. Theseissues have been highlighted in the appropriatesections in this <strong>book</strong>. Nevertheless, the informationpublished here provides a basis for assessing theChapter 1: Overviewstate of the environment in Nepal, as well as factorslike environmental governance, financing, and tradethat influence it. The extensive sources listed willprovide future researchers with a basis for identifyingnew sources of data for future work, and it is hopedthat the identification of gaps and needs willencourage further development of an“environmental statistics” culture in the country.OrganizationThis <strong>book</strong> is organized broadly into five parts. Thefirst comprises this overview chapter together withChapter 2, which discusses the relationships amongrural environment, poverty, and livelihood. Thelargely rural population of Nepal is still almost totallydependent on land, forest, and water resources fortheir livelihood. As resources become depleted ordegraded, resource rights, vulnerability, foodsecurity, marginalization, and resources-relatedconflicts have increased. Clashes between traditionaland contemporary systems of property rights areoften at the root of livelihood insecurity. Otherpressures on natural resources come from emergingmarkets, a growing population, and rapid expansionsof different types of infrastructure. While these are anintegral part of the present development scenario,environmental problems can no longer beoverlooked as people displaced by the loss ofenvironmental resources are easily pushed intoconflict situations.The overall environmental conditions of thecountry are described in the second part comprisingChapters 3 to 8. The main findings in these chaptersis summarised below.Nepal’s forest area in 1986 was 6.2 million ha.According to the most recent survey, based onsatellite imagery, the country now has 6.8 million haof forest and shrubland, with 37% of the land areacovered by forest and 9% by shrub. However, thesefigures do not differentiate in terms of crown cover orother measures of forest health. They may also behigher than in reality (see discussion in Chapter 3). Inthe absence of other energy sources, fuelwood is themain source of energy for cooking and heating. Thishas been the main cause of deforestation. The1
forests are also used for infrastructure development,such as roads, schools, buildings, and houses.Deforestation has resulted in increased landslides,soil erosion, floods, and loss of biodiversity.Nepal’s 8 bioclimatic zones and 35 vegetationtypes support a rich biodiversity in terms of fauna andflora. Nepal has more than 100 species of mammals,800 species of birds, 600 species of butterflies,numerous invertebrates, over 5,000 species offlowering plants, and about 200 ferns. Several ofthese have become endangered as a result of variousfactors, including deforestation.About <strong>18</strong>% of the land area has beendemarcated as protected and conserved areas.Proper management of the protected areas forbiodiversity conservation, poverty reduction, andlivelihood improvement is a necessity.Soil degradation and loss of productive land areserious environmental problems. With the increasingpopulation and growing need for food, agriculture isbeing expanded to sloping lands and forests. Theheavy monsoon rains make fragile mountain slopesvulnerable to loss and degradation of land and soilthrough landslides, erosion, and river cutting. Asmuch as 5% of all landslides in Nepal are associatedwith newly-constructed roads and trails.Solid waste is a common environmentalproblem in urban areas. The major cities haveexperienced high rates of population growth andunmanaged urban development, which haveresulted in an increasing volume of solid waste. Themain sources of solid waste are urban households.Slightly over 14% of the population live in Nepal’s 58municipalities; they generate more than 80% of allsolid waste. About two thirds of the waste materialsare organic. The impacts of inappropriate solid wastedisposal on rivers and human health are substantial.The disposal of waste into local rivers has adverselyaffected the quality of water and the aesthetic valueof rivers and cities. This problem is particularly acutein Kathmandu Valley.The municipalities are responsible for solidwaste management. However, most municipalitiesdo not have adequate resources or the technicalexpertise to manage solid waste disposal. Solidwaste disposal in landfill sites has become sociallyvery sensitive and people’s participation in it isgenerally weak. Lack of suitable infrastructure, suchas landfill sites, is also a problem in urban areas.Nepal is rich in water resources. Over 6,000rivers and streams drain the country. The rapidincrease in population has increased demands forwater for drinking, sanitation, irrigation, industry,energy, and recreation. Water shortages and waterpollution are serious problems in urban areasbecause of rural-urban migration, population growth,and unplanned urbanization. The problem ofsecuring a safe drinking water supply is very serious,particularly in Kathmandu Valley.There is evidence that water quality isdeteriorating rapidly in urban areas. Urban areasgenerally lack the infrastructure for the collection,treatment, and disposal of sewage. Limited facilitiesbuilt for this purpose are either ineffective ornonfunctional. Drainage is a common problem,particularly in the Terai. As few houses are connectedto the wastewater system, untreated domesticwaste is discharged into rivers. Most households inrural areas do not have latrines; people defecate inopen areas such as riverbanks and public lands.Likewise, most industrial effluents are dischargeddirectly into rivers. All of these practices contribute tosurface and groundwater pollution.Water pollution has become a serious publichealth problem. Biological water pollution, combinedwith inappropriate sanitation and hygienepractices, is responsible for diseases such asdiarrhea, typhoid, skin diseases, and intestinalworms. These are the most common diseases inNepal, and a large number of infants die annuallydue to diarrhea alone. Recently, arsenic contaminationof the groundwater of the Terai has become aconcern.Water pollution has also adversely affectedaquatic ecosystems. Nepal’s rivers have rich aquaticbiodiversity, which is threatened due to growingwater pollution. The rivers of Kathmandu Valley,particularly in the core city areas, have already lostaquatic biodiversity.Air pollution is a serious concern in urban areasdue to dust generated by vehicles, increasing use offossil fuels for transportation, and concentration ofindustries. Air pollution by industrial emission is alocal concern in many areas. Kathmandu Valley isespecially vulnerable to air pollution due to itstopography (a bowl-shaped valley), rapid andhaphazard urbanization, and significant increase ofvehicular transport in narrow streets. In addition, thepoor maintenance of the roads aggravates airpollution by contributing particulate matter to the air.The transport sector is the largest contributor tototal emissions of pollutants in Kathmandu Valley,followed by the household, industrial, and commercialsectors. Gasoline is the largest contributor to thetotal combined emission of all pollutants, whilefuelwood and coal are also major contributors. Withthe improved technology of brick kilns, pollutionfrom this sector is expected to be reduced inKathmandu valley. Indoor air pollution due toburning fuelwood in unventilated rural houses alsocauses serious health hazards.2 Environment Assessment of Nepal : Emerging Issues and Challenges
The third part of the <strong>book</strong>, Chapters 9 and 10,deals with environmental governance, the evolutionof environmental policies, standards regulation, theroles of different stakeholders, and the financing ofenvironmental programs. Weak enforcement ofenvironmental decisions and regulations appears tobe the most serious and persistent problem. Despitesignificant progress in introducing environmentalregulations and legislation, the loss of credibility ofthe Ministry of Population and Environment (MOPE)as an effective environmental organization resultedin its dissolution, with environment functions beingmoved to the Ministry of Science and Technology.This ministry has been renamed the Ministry forEnvironment, Science and Technology (MOEST). Ithas yet to be seen whether the difficultiesencountered by MOPE will be successfully overcomeby this reorganization. Some of the problems relatedto poor implementation of environmental decisionsare endemic to all government organizations, whileothers are specific to particular environmentalissues.The fourth part, Chapters 11 to 13, deals withthree emerging environmental themes that are quitenew in the context of Nepal but are now receiving agood deal of attention. The discussion on environmentand conflict shows that conflicts regardingnatural resources are widespread in land, forest, andwater resources. A new area of environmentalconflict is also beginning in urban areas. Some ofthese problems have remained unresolved andunattended for so long that organizations may behesitant to ‘bell the cat’, given the continuing politicalturmoil and conflict situation in the country. Themost surprising revelation is that the Governmentdoes not have an established mechanism to addressthe ongoing conflicts related to natural resources,particularly some aspects of forest resources.Trade and environment represents a new areathat has become important for Nepal since it joinedthe World Trade Organization (WTO). Some exportsfrom Nepal have already been subjected toenvironmental barriers by other countries includingIndia. As a relatively new player in this area, Nepalhas a lot of catching up to do in terms of improvinginstitutional capacity, technical standards, andquality assurance of its exports; intellectual propertyrights; market access; trade in services; andcomprehensive surveillance of domestic andinternational trade.The discussion on environmental informationemphasizes the need for monitoring progress anddeveloping appropriate indicators. This has beenachieved to some extent by sharing and exchangingdata with different organizations. Information mustbe linked to policy analysis and decisions. This <strong>book</strong>seeks to make analyzed information available in aform that is easily understood and accessible topolicymakers.Finally, in Chapter 14 the <strong>book</strong> deals with theemerging strategic issues for Nepal. The first of theseis promoting integrated ecosystem management andsustainable livelihoods. The chapter brings togetherthe different aspects of livelihood security in ruralareas and argues that further deterioration of rurallivelihoods can be prevented by more effectiveintegrated ecosystem management. It focuses on theissues of sustainable use of resource endowmentsand ecological niches; participatory and collaborativeapproaches; harnessing ecological, economic,cultural, and institutional opportunities; andpromoting decentralized and transparent decisionmaking. The second issue is promoting integratedurban environment management. Urban environmentalproblems are likely to become seriousbecause of rapid urbanization, poor infrastructure,haphazard management of urban development, andthe inadequate resources of urban developmentorganizations. Unless organizations work togetherwithin a common framework, urban growth is likelyto have a significant negative impact on environmentalresources because of increasing air andwater pollution, and unrealistic prices for naturalresources used by urban residents.Another priority area is institutional strengtheningand capacity building. MOPE was disbandedbecause it was seen as a weak organization withlimited capacity. The critical question now for itssuccessor MOEST is how to strengthen the organizationand how and where to build its capacity. Thelesson from MOPE’s dissolution is that otherorganizations in the Government have alsodeveloped important environmental capacity; thenew organization must find a niche that cuts acrosssectors, that supports sectoral work, and thatprovides leadership and vision regarding thechanging environment and its management in thefuture. Some of the specific areas where further workis needed include policy reforms, improvements inthe legislative system, working with others on tradeand environment, and mobilization for strongerenforcement of environmental laws and environmentalimpact assessment (EIA) and strategicenvironmental assessment (SEA) recommendations.The final priority is for an environmental andnatural resources information network. The demandfor appropriate environmental information isgrowing. What is available is often dispersed,heterogeneous, inaccessible, discontinuous, andunreliable. This situation added to the difficulty inproducing this report, and is responsible foroccasional inconsistencies in the data reported here,Chapter 1: Overview3
as data gathered by different agencies at differenttimes may be based on different definitions andmethodologies. Improvements are needed in allthese areas including presentation in spatial formsthat are recognizable, understandable, and based onreliable evidence. New technology has providedmany options for developing new information andhas facilitated monitoring over time. There are manyopportunities available and decision makers can nolonger afford to neglect these in their environmentaldecisions and actions.The information provided in the chapters issupplemented with an Annex containing a briefaccount of Nepal’s progress in fulfilling theMillennium Development Goals (MDG) commitments.4 Environment Assessment of Nepal : Emerging Issues and Challenges
Chapter 2Rural Environment, Poverty,and LivelihoodIntroductionenvironment” refers to humansettlements in rural settings, their“Ruralsurroundings, and their interrelationships.It includes both natural and human-made or culturalenvironments. The natural environment compriseswater, air, soil, forests, pasture, wildlife, and so on,while the cultural environment includes settlementsand their patterns, transportation, technology,utilities, services and others. In Nepal, the Ministry ofLocal Development defines rural and urbanlocalities. Population size is the principal criterion forthis designation, but the threshold size of populationhas changed since the census year of 1952/1954 1 . Thepresent threshold population size for designatingmunicipalities was set in 1996 at 20,000 for the Teraiand 10,000 for the Hill and Mountain regions. Allsettlements with populations below these figures aredefined as rural localities.Rural environments in Nepal vary considerablywith variations in altitude. Over the country,elevations range from 90 to 8,848 meters above sealevel (masl). For socio-economic purposes, the 75administrative districts are identified as belonging toone of three regions: the Terai (the mostly low lyingarea along the southern border), Hills, andMountains. These regions have significantdifferences in topography, natural endowments,economic activities, and human occupancy withcorresponding implications for biodiversity anddevelopment activities.Rapid population growth, increasing density ofsettlements, degradation of land, loss of biodiversity,shortage of water, and changing weather events haveaffected food, health, incomes, and theenvironmental security of rural people. Livelihoods inrural areas, particularly in the hills and mountains,have been supported by a complex web of dynamicinteractions among the physical, cultural, andeconomic environments. A disruption in any oneFigure 2.1: People and Conservation ImprovingLivelihood and EcosystemsWellbeing of peopleFood, shelter,education, healthincome, spirituality,security, voice,dignity, equityAbility to use assetsCapacity to adaptResistance tovulnerabilitySource: IUCN Nepal (2002)component can disturb the delicate balance andthreaten the livelihood security of rural households.Neither nature nor the cultural environment is astatic entity—they change continually. However, thepresent rapid pace of change is very disruptive inrural areas. In areas with improved access,traditional farming systems are quickly movingtowards commercial farming, based more and moreon external market factors. Where access is poor anddifficult and resource degradation has continued,livelihood conditions have actually worsened.This chapter discusses population growth,settlements, services, and poverty and livelihood inthe context of rural Nepal.Rural PopulationArea of OverlapPeople’s actionimpacting onecosystemsEcosystems’ impacton peopleEcosystem ConditionEcosystem dynamicsProvision ofecological goods andservicesProtection of diversityResilience to change(e.g. climate)Growth and DistributionNepal is a rural nation, with over 86% of its 23 millionpeople living in rural areas (as of 2001, Table 2.1).The rural population is one of the fundamentaldriving forces influencing the environmentalresource base of the country. During the last fivedecades (1952–2001), both the total population and1Two Nepali years, approximately mid <strong>April</strong> 1952 to mid <strong>April</strong> 1954Chapter 2: Rural Environment, Poverty, and Livelihood5
Table 2.1: Population Growth Rates aCensus YearTotal PopulationAnnual NationalGrowth Rate (%)Rural Population% of total1952/1954 b 8,256,625 8,0<strong>18</strong>,350 97.11Annual RuralGrowth Rate (%)1961 9,412,996 1.7 9,076,774 96.43 1.21971 11,555,983 2.1 11,094,045 96.00 2.01981 15,022,839 2.6 14,066,1<strong>18</strong> 93.63 2.41991 <strong>18</strong>,491,097 2.1 16,795,378 90.83 1.82001 23,151,423 2.3 19,922,311 86.05 1.7 p2 log ep1a Growth rates of population are obtained from the following equation: r tb Census of 1952/54 cover ed two Nepali yea rs, approximately mid <strong>April</strong> 1952 to mid <strong>April</strong> 1954Source: CBS (2003) pp. 37–85.Table 2.2: Distribution, Density, and Growth of Rural Population by RegionRegionRural Area(km²)Rural Population Change1991–20011991 2001%IncreaseGrowthRate% of TotalPopulation1991% of TotalPopulation2001RuralDensityper km 22001Mountain 51,661 1,405,113 1,644,154 17.0 1.6 8.7 8.3 32Hill 59,955 7,289,308 8,567,672 17.5 1.6 45.0 43.0 143Terai 32,289 8,100,957 9,710,485 19.9 2.6 46.3 48.7 301Country 143,905 16,795,378 19,922,311 <strong>18</strong>.6 1.7 90.8 86.1 138km 2 = square kilometerSource: CBS (2003) pp. 37–85.the rural population have increased enormously. In1952, the country’s total population was 8.26 million,with a rural population of 8 million that increased to20 million by 2001 (Table 2.1). However, thecountry’s annual population growth rates havealways exceeded the annual rural population growthrates (Table 2.1; Fig. 2.2). It is estimated that thepopulation will reach 29 million by 2011 (CBS 2003).Since 1981, national and rural populationgrowth rates have been rapid, putting tremendouspressure on natural resources such as agriculturalland and forests. At present, the population density ofthe country as a whole is 157 persons per squarekilometer (km 2 ). The density on agricultural land is570 persons per km 2 .Owing to variations in topography, naturalresources, cultures, and infrastructure facilities, theMountain, Hill, and Terai regions exhibit markedvariations in the growth and distribution of ruralpopulation (Table 2.2). The rural populationincreased in all three regions between 1991 and2001, but the growth of rural population in Mountainand Hill areas (17%), was less than in the Terai (29%).The growth rate of rural population in the Terai was2.6% per year, higher than the growth rate in the twoother regions. In both the Mountain and the Hillregions, the growth rate of rural population was lessthan the growth rate of the national rural population(2.1%).According to the 2001 census, the Terai—whichhas the smallest area—has the largest share of ruralpopulation with 49%, followed by the Hill (43%) andthe Mountain regions (8%). Comparing the relativeshare of rural population in the regions between thecensus years 1991 and 2001, the Mountain and Hillregions have shown a decreasing trend and the Teraian increasing trend. As a result, the density of ruralFigure 2.2: National, Rural, and Urban PopulationGrowth Rates, NepalSource: CBS (2003)6 Environment Assessment of Nepal : Emerging Issues and Challenges
population in the Terai with 301 persons per km 2 isthe highest in the country.With the lowest density and growth rate ofpopulation, the Mountain region has less pressure onits natural resources than the other two regions. Forexample, the per capita cultivated landholding in theMountain region is 0.31 hectares (ha) compared with0.16 and 0.17 ha in the Hill and the Terai regions,respectively (Table 2.3). Likewise, the Terai regionhas the lowest per capita forest land (0.11 ha), whilethe Mountain region has the largest per capita forestland. In other words, the Terai has the greatestpressure on both its cultivated and forest resources.Economic CharacteristicsThe economically active population above 10 yearsof age constitutes 45% of the nation as a whole. Ofthe total rural population, 48% are economicallyactive, compared with 41% in urban areas. In allcases, however, the proportions of economicallyactive population are below 50%, which means thatthere is a large dependent population.According to the 2001 census, 66% of the totalgainfully employed population is engaged in theprimary sector including agriculture, forestry, andfishery. This figure was 81% in 1991. There was asignificant increase in employment in themanufacturing (secondary) and commerce (tertiary)sectors between 1991 and 2001. In rural areas, theprimary sector employed 72% of the total gainfullyemployed population as against 42% in urban areas.About 10% and 17% of the rural gainfully employedpopulation are engaged in the secondary and tertiarysectors, as against <strong>18</strong>% and 40% in urban areas. Theshare of the primary sector in the Mountain region is81%, compared with 68% and 60% in the Hill andTerai regions, respectively. Other importantemployment sectors in the Hill and Terai regions arecommerce, manufacturing, and personal andcommunity services.Social CharacteristicsIn the last census in 2001, the literacy rate of thecountry’s total rural population 6 years of age andabove (16,428,<strong>18</strong>3) was 52% (Table 2.4), comparedwith the national literacy rate of 54% (CBS 2002b).The rural literacy rate is higher in the Hill region(58%) than in the Terai (48%) or the Mountains (48%).The rural sex ratio is 99.8 males per 100 females.The Terai region as a whole has a ratio of 103.8,whereas the Mountain and the Hill regions haveratios of 98.4 and 95.8, respectively. The sex ratio islowest in the western development region at 93.The dependent population below 15 and above59 years of age accounts for 53% of the total ruralpopulation. The total fertility rate among womenaged 15–49 years is 4.4, which is double the rate ofurban women (2.1); the under-five mortality rate inrural areas is 112 per thousand live births vs. 66 inurban areas; contraceptive prevalence in rural areasis 47% among women of reproductive age (15–49)compared with 66% for urban areas; and infantTable 2.3: Cultivated and Forest Land by Region, Nepal, 2001RegionTotal Area(km²)Number ofDistrictsPer Capita Cultivated Land(ha) aPer Capita Forest Land(ha) aMountain 51,817 16 0.31 0.70Hill 61,345 39 0.16 0.30Terai 34,019 20 0.17 0.11Country 147,<strong>18</strong>1 75 0.<strong>18</strong> 0.24ha = hectare; km 2 = square kilometeraNo separate data on cultivated land and forest land available at rural level .Source: JAFTA (2001)Table 2.4: Literacy Status of the Rural Population (6 years of age and above) aLiteracy CategoryMountain Hill Terai Rural TotalNumber % Number % Number % Number %Can’t read or write 625,<strong>18</strong>4 51.0 2,965,111 41.9 4,139,386 51.0 7,729,681 47.1Read only 82,876 6.8 487,617 6.9 487,632 6.0 1,058,125 6.4Read and write 507,6<strong>18</strong> 41.4 3,588,820 50.7 3,441,026 42.4 7,537,464 45.9Not stated 10,277 0.8 40,215 0.5 52,421 0.6 102,913 0.6Total 1,225,955 100.0 7,081,763 100.0 8,120,465 100.0 16,428,<strong>18</strong>3 100.0a Rural literacy for a district is obtained by subtracting the urban literate population from the total literate population.Source: CBS (2002b)Chapter 2: Rural Environment, Poverty, and Livelihood7
mortality rates for rural and urban areas are 79 and 50per thousand live births, respectively. The datashown in Table 2.5 indicate some of the humandevelopment measures and basic facilities in ruraland urban areas. Selected measures of humandevelopment—including gross domestic product(GDP) per capita, human development index,education index, life expectancy index, genderrelated indices and human poverty index—show thatthe performance of rural areas is much poorer thanthat of urban areas. Similarly, there are markeddifferences regarding basic facilities such as pipeddrinking water, sanitation, electricity, fuel used, andmass media exposure. In most cases, the facilities forhouseholds in rural areas are fewer than in urbanareas. The Nepal Living Standards Survey (NLSS)2004 (NLSS 2004) indicates that a majority ofhouseholds consider their access to public servicessuch as health, education, drinking water, electricity,road, post office and telephone as “fair”, whereas“bad” ratings range from 15% (education and postoffice) to 44% (road).The population of Nepal includes diverse ethnicgroups and castes, languages, religions, and culturaltraditions. In the Hill and Terai regions, Janjatispopulations (ethnic groups) account for 36.5% of thetotal population and Hindu castes for nearly 59%.Unlike urban areas, the population of rural localitiesin all regions is characterized by more or lesshomogenous ethnicity and caste. However, thepopulation of the emerging rural towns and marketcenters is more diverse.MigrationMovement of people from one place to another foreconomic, social, cultural, and other reasons has along tradition in Nepal. Migration of hill populationsincreased after the 1950s following the control ofendemic malaria in the Terai region and the warmriver valleys.Table 2.5: Performance of Rural and Urban Areas Regarding Basic Facilities and Development , 2001Demographic FeaturesHuman DevelopmentMeasuresDescription Rural UrbanTotal fertility rate (women age d 15–49) 4.4 2.1Current use of contraception (any method) 46.8 66.0Childhood mortality (per 1,000 live births)Infant 79.3 50.1Child 35.4 16.7Under five 111.9 65.9GDP per capita (PPP) $ (2000) 1,094 2,133Human development index (2000) 0.446 0.616Education index (2000) 0.276 0.568Life expectancy index (2000) 0.562 0.769Gender related development index (2000) 0.426 0.605Gender empowerment measure 0.333 0.443Human poverty index (2000) 41.4 23.9Basic FacilitiesMalnourishment among children under 5 years (%) 56.3 36.1Piped drinking water (% households) 33.0 55.2Sanitation facilities (% households)Flush toilet 6.1 58.3Pit toilet 17.1 14.6No facility 75.3 20.1Other 1.5 7.0Electricity connection (% households) 17.4 85.7Fuel used (% households)Firewood 94.1 39.1Kerosene 2.3 35.8Other 3.6 25.1Exposure to mass media, newspaper, radio and TV (% hh) 10.3 40.6hh = households, GDP = gross domestic product, PPP = purchasing power p arity, TV = televisionSource: CBS (2003) p. 409.8 Environment Assessment of Nepal : Emerging Issues and Challenges
Table 2.6 shows that by 2001, 1.73 million people(or 7.5% of the total population) had migrated to aregion different to that of their original birthplace.The Terai region has been the preferred destinationfor migrants, receiving 77% of the total. The Hillregion is the largest source of out-migration with 69%of the total. In terms of net migration, both theMountain and the Hill regions are losing population,whereas the Terai is gaining. Census reports indicatethat the Terai has been a receiving area for migrantsfor the last three decades. The NLSS (2004) indicatesthat the migration rate is higher for females (50%)than males (22%).In terms of rural and urban areas, rural to ruralmigration was highest, with 68% of total migrants;rural-urban migration second with 26%; and urban tourban migration lowest with 3% (Table 2.7). NLSS(2004) indicates that the rural origin of migration isthe largest with 82%, followed by external (13%) andurban origin (6%).Migration in Nepal is mainly due to familyreasons such as marriage and dependency, whichaccounted for 75% of all migrants (NLSS 2004). Otherreasons include easier lifestyle (12%), looking for job(7%), education and/or training (2.6%), and others.This pattern is true across the three regions and ruraland urban areas. However, in rural areas, familyreasons accounted for 80% of migration comparedwith 54% in urban areas. Second in rural areas waseasier lifestyle (11%), whereas that in urban areaswas looking for job (<strong>18</strong>%).The volume of migrations with a duration ofmore than 10 years is 44% (CBS 2003). The share ofthe Terai region for migrants staying over 10 years is50%, compared with 37% and 35% in the Mountainand the Hill regions, respectively. For the country as awhole, the distribution of migrants for differentclasses of duration of stay (6–10 years, 1–5 years, andless than 1 year) is 23%, 28%, and 5%, respectively.Nepal’s population growth is rapid, which isdirectly and indirectly related to major environmentalresources such as agricultural land, forest, and wateron which the majority of the population depends forlivelihood. Rapid population growth coupled with themanner in which these resources have been usedhas placed considerable stress on the environmentand has in many cases led to accelerated deteriorationof both local and regional environments suchas deforestation; soil erosion; floods; desertification;degradation of soil quality; and destruction of hydrodams,irrigation canals, and roads.Rural SettlementDefinitionOfficially, the rural population of Nepal refers to thoseresiding in localities lying within the designatedvillage development committee (VDC) areas (HMG1999). The definition of a VDC as “rural” is purelyadministrative. The VDCs contain all settlements withpopulations below the threshhold for designation asa municipality (see Introduction). A VDC containsgovernment offices and development activities toserve the inhabitants. A VDC generally contains morethan one settlement locality.Table 2.6: Migration of Population, Nepal, 2001 a DestinationOriginMountain Hill Terai Total% OutmigrationNet MigrationMountain 125,597 169,825 295,422 17.1 (255,103)Hill 33,895 1,157,035 1,190,930 68.9 (830,759)Terai 6,424 234,574 240,998 14.0 1,085,862Total 40,319 360,171 1,326,860 1,727,350 100.0% Immigration 2.3 20.9 76.8 100.0a This figure does not include the movement of people within a region.Source: CBS (2003) p. 134.Table 2.7: Rural and Urban Migration by Region, 2001RegionRural–Rural Urban–Rural Rural–Urban Urban–UrbanNumber % Number % Number % Number %TotalMountain 42,364 89.0 2,884 6.1 2,150 4.5 <strong>18</strong>8 0.4 47,586Hill 565,527 51.6 44,851 4.1 424,801 38.8 60,031 5.5 1,095,210Terai 1,389,956 77.8 55,770 3.1 319,334 17.9 21,206 1.2 1,786,266Total 1,997,847 68.2 103,505 3.5 746,285 25.5 81,425 2.8 2,929,062Source: CBS (2003) p. 142.Chapter 2: Rural Environment, Poverty, and Livelihood9
Agglomeration village in the central hills of NepalDispersed settlement type village in the central hills ofNepalMorphological FeaturesRural settlements are primarily of two forms:scattered and agglomerated. Scattered settlementsare usually small, with large distances betweenbuildings within the locality, as well as between thesettlement localities. Agglomerated settlements, onthe other hand, are usually large because theycontain buildings that are relatively closely spaced orsometimes attached to each other. The density ofbuildings in agglomerated settlements is usuallyB. PradhanB. Pradhanhigh. Market towns in rural areas are usuallycompact, with buildings commonly attached to eachother. The rural settlement study carried out by theCentral Department of Geography (CDG 2004)indicates that dispersed settlements are foundwidely across the Hill region. However, in thewestern Hills some of the settlements inhabited bythe Gurung and Magar ethnic groups are ofagglomerated form. The rural settlements in the Teraiand the Mountain regions are mostly agglomeratedor compact. However, the size of agglomeratedsettlements in the Mountain region is smaller thanthose in the Terai. In some parts of the easternMountain region, rural settlements are mostly in thescattered form.These settlement forms are chiefly related to theamount and type of available resources, ruggednessof the topography, climatic conditions, amount ofinfrastructure services, and so on. Dispersedsettlements in the Hills are chiefly the result oflimited and scattered production resources andhabitable environments in the rugged topography.The compact or agglomerated settlements in theTerai result from the abundant land resources andflat topography, while those of the Mountains are dueto cold climate and social reasons. Because of poorsanitation and drainage, the environment of compactsettlements is mostly unhealthy.Distribution PatternTable 2.8 shows the distribution of settlementlocalities as reported by the 2001 census. Details ofthe number of localities by population size class andregion, and their total population, for 1991 and 2001are shown in Tables 2.9 and 2.10, respectively. Allrural localities lie below the population size class20,000–49,999. However, settlement localities in thepopulation size class 10,000–19,999 also containsome designated urban areas, since in Hill andTable 2.8: Distribution of Settlement Localities , 1991 and 2001Population Size Mountain Hill Terai Country TotalClass 1991 2001 1991 2001 1991 2001 1991 2001Below 1,000 60 55 12 15 0 0 72 701,000–4,999 459 399 1,722 1,477 842 520 3,023 2,3965,000–9,999 25 73 304 433 432 561 761 1,06710,000–19,999 0 27 28 53 137 205 165 28520,000–49,999 0 2 2 <strong>18</strong> 14 35 16 5550,000–99,999 0 0 3 3 5 8 8 11Over 99,999 0 0 2 3 1 2 3 5Total 544 556 2,073 2,002 1,431 1,331 4,048 3,889% Country total 13.4 14.3 51.2 51.5 35.4 34.2 100 100Source: CBS (2002b)10 Environment Assessment of Nepal : Emerging Issues and Challenges
Mountain districts, urban areas are defined assettlements with a population of 10,000 and over. Thetotal number of settlement localities of this size in2001 was 285, which included 277 rural and 8designated urban areas. There were 16 settlementlocalities in the population size class 20,000–49,999 in1991 compared with 55 in 2001, of which the numberof rural localities was 11 and 21, respectively. Thetotal number of rural areas decreased from 4,015 to3,831 between 1991 and 2001, while the number ofdesignated urban areas increased from 33 to 58. In2001, all 544 rural localities in the Mountains werebelow a population size of 19,999 except for twodesignated urban areas. The total number of ruralareas in the Hills was 1,976 as compared with 1,301in the Terai. However, the average population sizeper rural locality is larger in the Terai (7,464) than inthe Hills (4,336). The Mountains have the lowestpopulation size per rural locality. The averagepopulation size of rural locality for the country as awhole is 5,200.Increase in population has a direct bearing onthe use of environmental resources, and increaseddemand for these resources causes their furtherdegradation. The rural population and amount ofagricultural land are both expanding, but the forestarea is diminishing. Diminishing forest area meansdeclining availability of forest products or increasingtravel to collect forest products, which eventuallyaffects the sustainability of agricultural production. Inthe Hills some of the sloping areas have beenencroached for cultivation, resulting in landslides,Table 2.9: Distribution of Settlement Localities and their Population by Region, 1991Population SizeClassMountain Hill Terai TotalNo. ofLocalities Population No. ofNo. ofPopulationLocalitiesLocalities Population No. ofPopulationLocalitiesBelow 500 16 5,680 16 5,680500–999 44 34,028 12 10,290 56 44,3<strong>18</strong>1,000–1,999 123 192,527 222 374,896 20 35,422 365 602,8452,000–2,999 168 420,467 595 1,506,155 201 528,968 964 2,455,5903,000–3,999 115 398,017 561 1,947,370 357 1,248,667 1,033 3,594,0544,000–4,999 53 237,131 244 359,901 137 1,177,904 661 2,943,6915,000–9,999 25 155,280 304 1,901,280 432 3,014,438 761 5,070,99810,000–19,999 28 359,901 137 1,755,500 165 2,115,40120,000–49,999 2 43,691 14 430,899 16 474,59050,000–99,999 3 210,527 5 306,892 8 517,419Over 99,999 2 537,123 1 129,388 3 666,511Country Total 544 1,443,130 2,073 8,419,889 1,431 8,628,078 4,048 <strong>18</strong>,491,097Source: CBS (2002b)Table 2.10: Distribution of Settlement Localities and their Population by Region, 2001Population SizeClassMountain Hill Terai TotalNo. ofLocalities Population No. ofNo. ofNo. ofPopulationPopulationPopulationLocalitiesLocalitiesLocalitiesBelow 1,000 55 30,102 15 11,672 0 0 70 41,7751,000–4,999 399 928,754 1,477 4,976,439 520 2,173,043 2,396 8,066,6295,000–9,999 73 378,986 433 2,846,041 561 4,133,2<strong>18</strong> 1,067 7,342,73010,000–19,999 27 314,726 53 704,562 205 2,962,979 285 3,975,23720,000–29,999 2 35,290 12 282,037 24 590,434 38 907,76130,000–39,999 0 0 2 65,328 7 254,495 9 319,82340,000–49,999 0 0 4 174,175 4 190,352 8 364,52750,000–99,999 0 0 3 199,707 8 628,775 11 828,482100,000–99,999 0 0 2 319,303 2 279,158 4 621,007Over 299,999 0 0 1 671,846 0 0 1 683,452Country Total 556 1,687,859 2,002 10,251,111 1,331 11,212,453 3,889 23,151,423Source: CBS (2002b)Chapter 2: Rural Environment, Poverty, and Livelihood11
soil erosion, and depletion of water sources, furtherdegrading the agricultural land. Declining forestcover causes frequent river floods and siltation,which also degrade agricultural land in the Terai.Systems of rural settlement have environmentalplanning implications. Large villages are moreflexible than small villages in terms of usingenvironmental resources. Distance is unquestionablythe most important constraint in using naturalresources. Spatial proximity of villages to theseproduction support facilities is a basic element oftheir effective use and hence efficiency inagricultural production (Pradhan 2004). Ruralsettlements in the Terai are usually bigger than thosein the Hills. The scattered settlements of the Hills areneither viable for sustainable use of facilities relatedto the development of environmental resources norfeasible for providing consolidated force tocommunal development. While the Terai’sagglomerated villages allow a considerable degree offlexibility in the provision of facilities, they may alsoinvite overcrowding and environmental problemssuch as poor drainage and sanitation. Villages alongthe riverbanks in the Terai are very vulnerable tofloods.Rural Infrastructure and ServicesInfrastructure and services related to the ruralenvironment include roads, electricity, irrigation,health, and education. Data on these infrastructuresand services are available at district level; theiraccessibility is analyzed in terms of trend,distribution, and density.RoadsRoads are a basic infrastructure for development inNepal, they include all types of roads: bitumen,gravel, and earthen. The total road length in 2002 was16,835 km compared with 13,400 km in 1998 and6,000 km in 1985. The Terai region has slightly over50% of the total road length. Its density of 25 km roadper 100 km 2 area is more than double the countryaverage (Table 2.11). The Mountain region has amere 1.4 km road per 100 km 2 area.The total rural area of Nepal is 143,905 km 2 andthe urban area is 3,276—98% and 2% of the total areaof the country. The rural road density is 10.2 km roadper 100 km 2 area, which is almost seven times lessthan the urban road density. The Terai region has thelargest rural road density with 22.7 km per 100 km 2 .Many parts of the rural Hill and Mountain regions arenot accessible by road.At present, the road network has connected 61of 75 district headquarters. The effort to connect theremainder of the district headquarters by roads hasbeen slow because of limited resources. Roadconstruction in Hill and Mountain districts requireshuge investment in both construction andmaintenance. Although roads can be advocated onsocial grounds, this sector has yielded low economicreturns and suffers from low traffic volume and lackof an integrated development approach.Though roads have provided beneficial impactson social and economic environments, thesebenefits have been accompanied by a number ofadverse environmental impacts such as landslides,slope instability, soil erosion, and roadside runoff.While the negative environmental impacts of roadshave often been the result of using constructiontechniques that are incompatible with naturallydynamic and fragile slopes, there have also beenmany cases of simple mitigation measures beingemployed (DOR 2000). “Green roads” based on bioengineeringprinciples and techniques (use of livingplants and plant-derived materials in conjunctionwith inert structures for preventing failure of roadsidesteep slopes, limiting erosion and gullies, controllingrunoff, and so on) that are practical, durable,economical, and environmentally sensitive(Schaffner 1987; DFID 1998; CDG 2001) should beadopted in Nepal.ElectricityTable 2.12 shows the distribution of electricityconnections to households. Less than 40% ofhouseholds overall have electricity. The Hill regionhas electricity connections in nearly 43% ofhouseholds; whereas nearly 80% of Mountainhouseholds do not have electricity. In 2001, electricityTable: 2.11: Road Density by Region, Rural Area and Urban AreaRegionAll Roads (km) Rural Roads (km) Urban Roads (km)Length per 100 km 2 Length 100 km 2 Length 100 km 2Mountain 740 1.4 725 1.4 15 9.6Hill 7,588 12.4 6,591 11.0 997 71.7Terai 8,507 25.0 7,321 22.7 1,<strong>18</strong>6 68.5Total 16,835 11.4 14,637 10.2 2,198 67.1km = kilometer , km 2 = square kilometerSource: DOR (2002)12 Environment Assessment of Nepal : Emerging Issues and Challenges
was provided to 17% of rural households comparedwith 86% in urban areas (CBS 2002b), though arecent survey has shown improving electricityconnections in both rural (27%) and urban (87%)areas (NLSS 2004). The national rate of serviceincreased from 14% in 1995/96 to 40% in 2001. Mostrural households use other sources of energy such asfuelwood and kerosene for lighting and cooking.Bhaktapur (Hill district in the central region) hasthe largest percentage of electricity connectedhouseholds with 97.4% and Dolpa (Mountain districtin the mid-west region) has the lowest with a mere0.59% of households.The current production capacity of 527.5megawatts is a mere 0.63% of the total theoreticalhydroelectricity potential of 83,000 megawatts and1.26% of the economically feasible potential of 42,000megawatts. In order to increase the access ofelectricity and to increase production in agricultureand other activities, the current Tenth Plan(2002–2007) has set several targets: (a) to construct842 megawatts of electricity capacity, (b) 2,600village development committees to be supplied withelectricity through the national grid on the basis ofequitable distribution, and (c) annual per capitaelectricity consumption to be raised to 100 kilowatthours.One strategy envisaged in the current plan isto develop electricity through investment by both theprivate and public sectors.Electricity is a clean energy. Harnessing theeconomically feasible hydroelectricity in Nepal, asstated above, involves the construction of largereservoirs. But there have been big debates overmacro (mega) and micro hydro projects.Construction of large reservoirs for power generationin the Hill region of Nepal can have negative impactson the environment and ecosystem. Some of themajor environmental and ecological problems oflarge dams, which impound large volumes of water,are reservoir siltation, land submergence,displacement of people, resource use conflicts,effects on natural aquatic and river habitats, localclimate change, increase in incidence of landslidesfrom steep hill slopes, water logging and salinity, andwatershed disturbance. In order to mitigate theseenvironmental consequences, measures such asTable: 2.12: Electricity Connection to HouseholdsRegionNumber of HouseholdsTotal Electricity %Mountain 285,213 60,630 21.26Hill 1,951,191 834,789 42.78Terai 1,938,053 749,080 38.65Nepal 4,174,457 1,644,499 39.39Source: CBS (2002b)Chapter 2: Rural Environment, Poverty, and Livelihoodwatershed management and protection of upstreamareas need to be adopted during the constructionphase. On the other hand, micro-hydro projects(
provision remains inadequate because of theexponential growth in population. Furthermore, theprovision of the facilities in rural areas is grosslyinadequate compared with urban areas. Thedistribution of facilities is also uneven by region. TheTerai appears to be more accessible for services thanthe Hill and Mountain regions. In addition, there islittle information available on the actual quality of theservices.The five services can be divided into two broadgroups. The first group includes road, electricity, andirrigation, which are fundamental infrastructure forrural development in Nepal. Although provision ofthese infrastructures has provided beneficial impactson social and economic environments, theiravailability in rural areas is too low and the efforts toprovide them have been slow because of limitedresources. On the other hand, development of theseinfrastructures has also been accompanied by anumber of adverse environmental impacts such aslandslides, slope instability, soil erosion, siltation, andloss of habitat and biodiversity. These negativeenvironmental impacts have often been the result ofincompatible techniques used for naturally dynamicand fragile slopes. Roads, electricity, and irrigationare interlinked. Watershed conservation andmanagement should be an integral part of developingthese infrastructures. Impact assessments forinfrastructure projects should not only be carried outin situ but also in other potentially affected areas.Construction technologies for these infrastructuresshould be environmentally friendly (green roads,micro-hydro, and so on). Management and operationof these infrastructures should be by users’ groups.The second group includes health andeducation services, which are also fundamentals forenvironmental conservation and rural development.Most rural people depend directly on naturalresources for their livelihoods, and the wellbeing andfuture of this society depends on its ability to live inharmony with the natural environment. Pooraccessibility to health and education services is amajor constraint to socioeconomic developmentefforts in Nepal. The majority of rural people are stillilliterate, this is the challenge for education. Thechallenge to the health sector is to improve accessand quality of health services for rural people. Theseservices should be provided adequately in ruralareas, with due attention given to sustainability.Health and SanitationRural HealthQuality drinking water and sanitation facilities arebasic human needs. Development of this sector willhave positive impacts upon health, and healthyworkers will contribute to the growth of otherproductive sectors. Safe drinking water will significantlycontrol waterborne diseases and minimizehealth expenses incurred in treating such diseases.Access to drinking water sources is important, as itrelates to the time spent fetching water. The savedtime can be utilized in productive work, in turnproviding opportunities to earn more income andreducing poverty. Development of the drinking watersector contributes to healthy workers, additionalincome generation, and less health expenditure ontreatment of diseases. In rural Nepal, many diseasesare related to poor water and sanitation. Sanitation inrural Nepal can be described in terms of access ofpeople to toilet types and wastewater generation andmanagement, the condition of which indicates thestate of environment.Different parameters directly and indirectlyrelated to health and sanitation are discussed interms of rural and urban areas, and mountain, hill,and Terai regions.Table 2.16 shows various health indicatorscontrasted between urban and rural areas. Theperformance of the selected health indicators isuniversally less in rural areas than in urban areas.Table 2.16: Selected Health IndicatorsDescription Urban Rural NepalTotal fertility rate women age 15 –49 (expressed/woman) a 2.1 4.4 4.1Current use of contraception (any method) — married men a 66.0 46.8 —Chronic malnourishment of children under 5 years of age (%) 36.6 51.5 50.5Life expectancy at birth 64.53 60.61 60.98Population without access to safe water (%) 11.46 22.19 20.48Population with access to sanitation (%) 77.06 32.05 39.22Childhood mortality per thousand live bi rthsInfant a 50.1 79.3 —Child a 16.7 35.4 —Under-5 a 65.9 111.9 —— = not availableSource: UNDP (2001), a MOH/New Era/ORC Macro (2002 )16 Environment Assessment of Nepal : Emerging Issues and Challenges
The indicators for some common diseases arecomputed in terms of outpatient department (OPD)visits by region (Table 2.17). There are nine commonwaterborne and air (smoke) borne diseases.Compared with the national average, the relativeincidence of skin disease among hospital outpatientsis higher in the Terai, and that of intestinal worms,acute respiratory infection (ARI), gastritis, chronicbronchitis, and typhoid are lower than the nationalaverage. These diseases are most likely to occur as aresult of poor quality drinking water and lack ofnearby health facilities.Table 2.<strong>18</strong> lists the top ten diseases identified bythe Department of Health Services of Nepal andTable 2.19 the incidence of diarrhea and ARI inchildren. Diarrhea among children below 5 years ofage is more prevalent in the Mountains and the Teraithan the national average (177 per 1,000). Diarrhea isrelated to the consumption of poor quality water. ARIis more prevalent in the Terai. In rural Nepal, ARI isrelated to the lack of outlets for smoke from solidbiofuels due to poor ventilation. About 95% of ruralhouseholds use solid fuel, including wood, cowdung, leaves, and straw, for cooking and heating(Table 2.20). The studies of Nepal Health ResearchCouncil (2003) and the Intermediate TechnologyDevelopment Group (2004) show that ventilation isvery poor in rural households and smoke from theuse of solid fuel remains indoors for long periods,which could be increasing respiratory problems.According to the Department of Health Servicesannual report 2003, based on the data recorded inthe health services, the percentage of malnourishedchildren below age 3 measured in terms of underweightis higher in the Mountain and Terai regionsthan the country average (Table 2.21).Table 2.17: Common Diseases by RegionDiseasesNational(N=8,642,852)Annual Incidence of Specific Disease ( of OPD Visits) aMountain(N=807,663)Hill(N=4,091,291)Terai(N=3,743,898)Skin disease 175.3 116.7 136.6 229.5Diarrheal disease 101.4 112.1 105.0 95.2Intestinal w orms 92.6 113.9 100.0 80.0Acute respiratory i nfection 87.2 104.5 97.5 72.4Gastritis 58.2 63.9 63.4 51.3Chronic bronchitis 30.4 31.0 32.9 27.5Anemia 28.1 22.5 26.2 31.3Typhoid 28.0 32.5 27.2 27.9Jaundice and infectious hepatitis 3.5 2.7 3.0 4.1N = number, OPD = outpatient departmentNote: Figures in parentheses for each ec ological region are OPD visits.a Annual incidence of specific disease —number of specific cases in a specific year x 1,000 per total number of OPD visits in the same year.Source: DOHS (2003)Table 2.<strong>18</strong>: Ten Leading Diseases, 2001DiseaseNational(N= 8,642,852)Mountain(N= 807,663)Percent of Total OPD Visits by RegionHill(N= 4,091,291)Terai(N= 3,743,898)Skin disease 5.76 5.38 5.<strong>18</strong> 6.35Diarrheal disease 3.44 5.00 3.94 2.73Acute respiratory infection 3.38 4.69 3.69 2.90Intestinal worms 2.76 4.44 2.99 2.28Pyrex 2.30 2.58 2.16 2.37Gastritis 2.20 3.14 2.56 1.71Ear infection 1.56 1.89 1.45 1.61Chronic bronchitis 1.20 1.41 1.36 1.02Abdominal pain 1.05 1.40 1.13 0.93Sore eye complaints 1.02 1.89 1.22 0.71Note: Figures in parentheses indicat e total OPD visitsSource: DOHS (2003)Chapter 2: Rural Environment, Poverty, and Livelihood17
Malnutrition remains a serious obstacleto survival, growth, and development in Nepal.There are different forms of malnutrition. Themost common forms in Nepal are proteinenergymalnutrition, iodine deficiencydisorder, and deficiencies of iron andvitamins. The Nepal Demographic and HealthSurvey conducted in 2001 showed that 51% ofthe sample children (N = 6877) below 5 yearsof age were affected by stunting (short fortheir age), which can be a sign of early chronicunder-nutrition. The survey also found that46% of children below age 5 are underweight(low weight for age). In addition 9% arewasted (thin for their height), an indicator ofacute malnutrition. According to the survey(2001), one important cause of protein energymalnutrition in Nepal is that 30%–50% ofchildren are born with low birth weight(weight below 2.5 kg). Low birth weight alsoleads to an intergenerational cycle ofmalnutrition (DOHS 2003).Table 2.19: Incidence of Diarrhea and Acute Respiratory Infection(ARI) per ‘000 Population Below 5 years of AgeNumber of Diarrhea Number of ARIRegionPatientsPatientsMountain 195 215Hill 167 <strong>18</strong>0Terai <strong>18</strong>4 277Nepal 177 229ARI = acute respiratory infectionSource: DOHS (2003)Table 2.20: Distribution of Households by Main Fuel Used forCookingCow Dung/ TotalWoodRegionLeaves/ Solid Fuel Kerosene LPG(1)Straw (2) (1+2)Other aFuelMountain 99.7 0 99.7 0 0 0.3Hill 76.8 1.3 78.1 6.5 6.5 2.1Terai 57.0 31.9 88.9 3.6 3.6 2.8Rural 76.7 17.8 94.5 1.6 1.6 2.0Urban 30.6 4.8 35.4 19.9 19.9 3.9Nepal 69.1 15.7 84.8 4.7 8.2 2.3Improvement MeasuresLPG = liquefied petroleum gasa Other fuels include electricity, biogas, coal or charcoal, and other categories.Table 2.22 lists health indicators and their Source: NLSS (2004)status and target by the current Tenth Plan.Increasing the availability of essential health Table 2.21: Malnourished Children Below Age 3 (%)services from 70% to 90% by the end of theRegion Total Normal % MalnourishedTenth Plan (2007) necessitates increasing thenumber of health institutions in rural Hills and Mountain 55,432 45,438 <strong>18</strong>.0Mountains, given the scattered settlements. Hill 384,582 327,316 14.9The Expanded Programme on ImmunizationTerai 393,948 329,713 16.3is considered one of the most cost-Nepal 833,962 702,467 15.8effective health interventions. The presentSource: DOHS (2003)program covers all 75 districts of the countrywith appropriate interventions to achieve thetargets.The Ministry of Health has developed aTable 2.22: Status and Target of Health -Related Indicators, 2001Second Long Term Health Plan 1997–2017.The aim of this plan is to guide health sectordevelopment in improving the health of thepopulation, particularly those whose healthneeds are not now met. According to the plan,Health IndicatorsAvailability of essential health services (%)Pregnant mother attending four antenatal visits (%)Women of 15–44 age group receivi ng TT vaccines (%)Contraceptive prevalence rate (%)Status70.016.015.039.3Target90.050.050.047.0priority is to be given to health promotion and Use of condoms for safe sex (14 –35 years) (%) 35.0 35.0prevention activities based on primary health Total fertility rate (women of 15 –49 years) 4.1 3.5care principles. It identifies essential healthCrude birth rate per 1,000 34.0 30.0care services that address the most essentialBirth attendance by trained health workers (%) 12.7 <strong>18</strong>.0health needs of the population.Newborn infant mortality (per 1,000 live births) 39.0 32.0Further, the strategy includes not onlyInfant mortality (per 1,000 live births) 64.0 45.0curative care interventions but also preventivecomponents. The Convention on the Crude mortality rate (per 1,000) 10.0 7.0Rights of the Child states the right of the childto enjoy the highest attainable standard ofhealth and to have access to health services.In this sense integrated management ofchildhood illness has been successful inMaternal mortality rate (per 100,000)Child mortality (below 5 years old) per 1,000 live birthsLife expectancy at birth (years)Total expenditure to total government budget (%)415.091.061.95.2300.072.065.06.5Source: NPC (2002)<strong>18</strong> Environment Assessment of Nepal : Emerging Issues and Challenges
Ordinary Dug Well in the Terai RegionB. PradhanImproved Dug Well with Protective CoverB. Pradhanprotecting the rights of children. Today, this approachhas proved to be one of the most successfulstrategies for the survival of children in manycountries.Diarrheal diseases are a major public healthproblem among children under five. The NationalControl of Diarrheal Diseases Programme has beenaccorded high priority by the government andremains an integral part of primary health care.Improvement in diarrheal case management will bea primary strategy for reducing mortality amongchildren under five years of age. Standard diarrheacase management will be provided in healthinstitutes by establishing oral rehydration therapycorners in all health institutions. The main objectiveof the National Control of Diarrheal Diseases Programis to reduce mortality due to diarrhea anddehydration from the current 30,000 deaths per yearto a minimum and to reduce morbidity from 3.3episodes per child per year to a minimum.Rural SanitationRural sanitation refers to access of rural householdsto drinking water sources, drinking water coverage,types of toilet, and wastewater generation.Drinking WaterTable 2.23 shows the proportion of householdshaving access to different sources of drinking waterfor the respective regions as a whole. Most peopleliving in the Mountains and Hills are provided withtap or pipe water, whereas in the Terai tube wells arethe main source of drinking water. The nationalaverage of access to tap water is 53%. Tap water issaid to be safe water. In rural Nepal, most drinkingwater is provided through public taps. Other watersources such as wells, tube wells, water spouts, andrivers are commonly used by the rural poor.A Department of Water Supply and Seweragestudy in 2002 estimated the drinking water access forthe rural population (Table 2.24). By the end of 2007,it is estimated that 92% of the total rural populationwill be covered with improved drinking watersystems provided by different government programs.By 2015, all rural people in the country will haveaccess to a drinking water supply.Toilet AccessThe access of households to toilets in rural and urbanareas is shown in Table 2.25. In 2001, the most recentyear for which reliable statistics are available, 46% ofall households had access to toilets, more in the Hillsand less in the Mountains and Terai. Two types oftoilet facilities—flush and ordinary (pit)—areidentified by the census (CBS 2002b). People usingflush or modern toilets are less vulnerable to healthrisks than those using ordinary toilets. For the countryas a whole, only 23% of households had access tomodern toilets, and 23% had ordinary toilets.Mountain households had the lowest access (7.9%)to modern toilets. Overall some 40% of ruralTable 2.23: Household Accessibility to Drinking Water by Sources, NepalPercent of Total HouseholdsTotalRegionTap/Spout River/ OtherHouseholdsWell Tube WellPipeWater StreamMountain 285,217 72.2 6.24 0.0 17.1 3.4 1.0Hill 1,950,345 72.2 11.99 2.4 10.1 2.0 1.2Terai 1,938,895 30.8 6.48 58.6 1.1 0.6 2.5Nepal 4,174,457 52.9 9.04 28.4 6.4 1.5 1.8Source: CBS (2002b)Chapter 2: Rural Environment, Poverty, and Livelihood19
Table 2.24: Existing and Projected Rural Population Drinking Water CoverageRegion Population 2001Coverage(%)Population 2007Coverage(%)Population 2015Coverage(%)Mountain 1,461,327 77 1,564,008 92 1,717,433 100Hill 8,360,758 66 9,294,045 89 10,749,057 100Terai 9,686,970 72 11,316,490 94 13,957,008 100Nepal 19,509,055 71 22,174,543 92 26,423,498 100Source: DWSS (2002)Table 2.25: Toilet Accessibility by Region and Rural–Urban AreasRegionTotal ToiletHouseholds% ToiletCoverageToilet as % ofhhToilet as % ofRural Toilet hhToilet as % ofUrban Toilet hhModern Ordinary Total Ordinary Total OrdinaryMountain 115,157 40.4 7.9 32.5 41.6 82.2 65.4 68.4Hill 1,088,474 55.8 26.9 28.9 48.4 60.4 87.5 31.3Terai 722,121 37.3 20.6 16.6 32.6 48.9 64.1 32.1Nepal 1,925,752 46.1 22.7 23.4 40.3 57.6 77.1 32.1hh = householdsSource: CBS (2002b)households had toilets compared with 77% in urbanareas. In the Terai region 49% of rural householdswith a toilet had an ordinary toilet; whereas in theother two regions, the proportion was over 60%. Inthe Mountain region, 82% of households with a toilethad an ordinary toilet.Open defecation is common for householdsthat do not have toilets. This is the main source ofwaterborne diseases. Thus mere curative healthfacilities such as provision of health service units andother types of facilities will not control commondiseases related to poor sanitation. Health programand policy measures should focus on maximizingaccess to safe drinking water and toilet (sanitation)facilities and increasing awareness of people of theneed to use toilets. This will not only minimizeexpenses on health problems in the long run, butalso mitigate the sanitation-related poor environment,which again will curtail the ever-increasingcost of medical care.Wastewater GenerationWastewater refers to water that has been used and isno longer clean. Table 2.26 summarizes thewastewater situation in rural and urban areas ofNepal. The total wastewater generation for 2001 hasbeen estimated at 981 thousand cubic meters (m 3 )per day for the country as a whole based on Metcalfand Eddy (1999). The wastewater generation perhectare in rural areas is 60 m 3 ; it is 9 times as high inurban areas (530 m 3 ). Most of the large cities andtowns are in the Hill and Terai regions, and as a resultthe wastewater generated in the Hills and Terai ismuch higher than in the mountains. Environmentalpollution (rivers, ponds, groundwater, and air) due toincreasing wastewater generation is basically anurban problem. Compared with urban areas, thepollution due to wastewater is less significant in ruralareas. However, other factors such as opendefecation, industries, agri-pests, and fertilizers affectthe environment in rural areas.In urban areas of Nepal, kitchen, laundry, andbath wastewater are normally mixed with toiletwastewater and connected to the drain, which isthen directly discharged into the local river. Industrialwastewater is also directly discharged into rivers inmost cases. There is no recycling or reuse ofwastewater in urban areas 2 . However, reuse ofwastewater is made at the individual farmer level.Vegetable farming in Kathmandu Valley is oftenirrigated by household wastewater. The use ofdomestic wastewater is a tradition of local farmers.Domestic wastewater is usually accumulated inTable 2.26: Wastewater (Sewage) Generation ( ’000m 3 )RegionWastewater (ww) Urban Ruralgeneration/day ww/ha ww/haMountain 68.95 0.15 0.01Hill 437.89 0.65 0.06Terai 474.36 0.47 0.12Nepal 981.21 0.53 0.06ha = hectare, m 3 = cubic meter, ww = wast ewaterSource: Me tcalf and Eddy (1999)2A very small portion of the wastewater draining into the Bagmati River from Kathmandu is treated in the middle section at the Pashupati temple area, which is mainlyfor religious purposes; further downstream wastewater is discharged into the river without treatment.20 Environment Assessment of Nepal : Emerging Issues and Challenges
Poor Drainage System in a Terai Villageponds for some days to allow settling and afterwardsused in agriculture. Pollution of rivers by untreateddomestic and industrial wastewater has a directimpact on the local environment and health, as thewater is used for cleaning vegetables, bathing,washing clothes, and drinking for livestock.Sanitation SystemA sanitation system refers to liquid wastes beingconnected to underground drains (sewers). Slightlyover 12% of households have access to sanitaryfacilities (drains); but only about 4% of ruralhouseholds compared with 54% of urban households(Table 2.27). Much of the wastewater is dischargedinto open drainage systems and is not sanitary. In theTerai, because of the very low gradient, wastewatertends to become stagnant water, providing a goodplace for mosquito breeding. This is one of thereasons for the increase in vector-borne diseases inthe Terai. Sixty-five of the country’s 75 districts aremalaria-risk districts.SummaryThe policy measures and programs with respect tohealth and sanitation are described in Chapter 5 onwater resources.Health and sanitation conditions are measuredin terms of health indicators such as chronicmalnourishment among children under 5 years ofage, life expectancy at birth, and population withoutaccess to safe water. Rural areas have lower valuesfor these indicators than the national average. Theincidence of diseases like intestinal worms, ARI,gastritis, chronic bronchitis, and typhoid that occurdue to poor quality drinking water is generally high inNepal. Compared with the national average, thecomparative incidence of diarrheal disease is higherin the Mountains and Hills, whereas the comparativeincidence of skin disease is higher in the Terai. ARIdue to smoke pollution as a result of poor ventilationis high in rural areas.B. PradhanTable 2.27: Percentage of Households with Access toSanitary Facilities (Drains)RegionPoverty% of HouseholdsMountain 1.0Hill <strong>18</strong>.7Terai 7.4Rural 3.7Urban 54.4Nepal 12.1Source: NLSS (2004)Rural PovertyPoverty in Nepal is widespread. Although sourcesindicate that the level of poverty in Nepal has beenrising, the latest estimates indicate that it has nowdecreased. The poverty survey in 1976 showed that33% of the population fell below the poverty line andthat poverty was most prevalent in rural areas. In1978, the population below the poverty line wasestimated to be 36%, which again increased to 42%in 1985. The 1996 poverty survey (Table 2.28) alsoshowed the national poverty level at 42%, with 25%and 17% being poor and very poor, respectively (NPC2002). At present, the poverty level is estimated at31% according to the 2004 NLSS Report.Poverty in Nepal is largely a rural phenomenon.In 1996, 44% of the rural population lived in povertycompared with 23% in urban areas (Table 2.28). Theincidence of poverty was highest in the Mountainregions (56%). There is a wide variation in povertywithin rural areas. For example, the poverty rate washighest in the more remote rural areas of the midwesternand far-western Hills and Mountains, whereit was as high as 72%. The rural mid-western and farwesternTerai regions were also poorer (53%).Measured in terms of indicators like adultliteracy, life expectancy, population without access tosafe water, and human poverty index, poverty ismore widespread in rural and mountain than inurban areas. The condition of all five selectedparameters (Table 2.29) is better in urban areas thanin rural areas. Access to safe water, an importantindicator of poverty, is better in the Terai than thenational average.Poverty can also be described by its intensitymeasured in terms of poverty gap and povertyseverity related to the total population of the region(Table 2.28). In 1996, the figures for poverty gap andpoverty severity were 12% and 5% respectively for thecountry as a whole. The values for the Terai werelower than the national average, whereas those forChapter 2: Rural Environment, Poverty, and Livelihood21
Table 2.28: Income Poverty Indicators in 1996(Poverty Line: NRs 4 ,404/person/year )PovertyPoverty Gap/IncidenceSensitivityIntensity ofArea % Peopleof PovertyPovertyLiving Below(%)(%)Poverty LineMountain 56 <strong>18</strong>.5 8.2Hill 41 13.6 6.1Terai 42 9.9 3.4Urban 23 7.0 2.8Rural 44 12.5 5.1Nepal 42 12.1 5.0Source: NPC (2002) pp. 14 –20.the Hills and Mountains were higher (14% and 6%)and much higher (19% and 8%). These valuessuggest that poverty is much worse in the Hills andMountains than in the Terai. The percentages ofpoverty gap and poverty severity are greater for ruralareas than for urban areas.Upper social groups like Bahuns, Newars, andYadavas have much lower poverty levels than lowersocial groups. In general, the Janajati groups(indigenous ethnics) have higher poverty levels thanthe national average ranging from 45% to 59%, whilethe Dalits (scheduled castes) have poverty levels ashigh as 65%–68% (NPC 2002). The upper casteChhetris also have an above-average poverty rate at50%, while Muslims are relatively better off in termsof poverty incidence. The indigenous Limbus havethe highest rate of poverty with 71%.Table 2.30 shows various poverty and humandevelopment indicators for different caste and ethnicgroups. Compared with the national average, thethree upper social groups (Newars, Bahuns, andChhetris) have better levels of selected povertyindicators (life expectancy, adult literacy, mean yearsTable 2.29: Some Indicators of PovertyAreaAdultLiteracy(>15yrs)LifeExpectancy(yrs) atBirthPopulationwithoutAccess toSafe Water(%)HumanPovertyIndexHDI(Index= 1)Nepal 48.6 60.98 20.48 39.6 0.46Urban 68.3 64.53 11.46 25.2 0.61Rural 45.0 60.61 22.19 42.0 0.44Mountain 36.1 52.55 28.01 49.8 0.37Hill 52.3 65.50 27.70 38.8 0.51Terai 46.1 63.93 12.10 39.6 0.47HDI = Human Devel opment Index, yrs = yearsSource: UNDP (2004) pp. 141–161.schooling, and per capita income) and humandevelopment indices than other groups like theDalits, Madhise, and Muslims.The status of some development measures alsoindicates poverty level. The present national HumanDevelopment Index (HDI) value is estimated at 0.471,one of the lowest in the world, although it hasincreased from 0.403 in 1996. There is a big disparitybetween urban and rural areas because ofdifferences in availability of human developmentfacilities. The HDI in urban areas is 0.581 comparedwith 0.452 in rural areas, where most people reside(UNDP 2004). Interestingly, the increase in HDI wasless than 3% in urban areas compared with 17% inrural areas during the years 1996–2001. The HDI islowest in the mountains (0.386), followed by theTerai (0.478) and the Hills (0.512). HDI also variesamong the development regions. The HDI value forthe Mid-Western and Far-Western developmentregions is less than the national average.The Nepal Human Development Report 2004estimates that the human poverty index for Nepal is39.6, which is greater than for any of the other SouthTable 2.30: Poverty and Human Development by Caste and EthnicityIndicatorHuman Poverty IndicatorsNepalCaste and Ethnicity (1996) b2001 a 1996 b Bahun Chhetri Newar Madhise Dalit Muslim OtherLife Expectancy Years 60.9 55.0 60.8 56.3 62.2 58.4 50.3 48.7 54.4Adult Literacy (15+) (%) 48.6 36.7 58.0 42.0 54.8 27.5 23.8 22.1 27.6Mean Years Schooling 2.7 2.3 4.7 2.8 4.4 1.7 1.2 1.4 1.9Per Capita Income ( NRs) 15,162 7,673 9,921 7,744 11,953 6,911 4,940 6,336 73,12Human Development IndicesLife Expectancy Index 0.60 0.50 0.597 0.522 0.62 0.55 0.422 0.395 0.49Education Attainment Index 0.38 0.29 0.490 0.342 0.46 0.22 0.<strong>18</strong>6 0.178 0.22Income Index 0.43 0.17 0.237 0.<strong>18</strong>1 0.28 0.16 0.11 0.145 0.17Human Development Index 0.47 0.32 0.441 0.348 0.45 0.31 0.23 0.239 0.29National HDI Ratio 100 100 135.9 107.3 140.7 96.3 73.6 73.7 90.9HDI = Human Development IndexSource: a UNDP (2004); b NPC (2002) (data refer to 1996, the most recent data available for different castes and ethnicities).22 Environment Assessment of Nepal : Emerging Issues and Challenges
Asian countries except Bangladesh and Pakistan(UNDP 2004). The human poverty index in ruralareas (42.0) is significantly higher than that in urbanareas (25.2). The incidence is most pronounced inthe Mountains (49.8), followed by the Terai (39.6)and Hills (38.8).The human empowerment index (HEI), whichis a composite index of social, economic andpolitical indicators, is 0.463 across the country,indicating a low level of empowerment. The level ofeconomic development for the country is 0.337which is below the social empowerment level of0.406, while political empowerment stands at 0.646.Among the regions, the Terai has a better HEI value(0.476) than the Hills (0.451) or Mountains (0.359); ahigher economic empowerment index (0.392compared with 0.310 and 0.236); and higher politicalempowerment index (0.674, compared with 0.568and 0.526). The economic empowerment index ofthe Terai is 16% higher than the national average.However, the social empowerment index is highestin the Hills (0.476), followed by the Terai (0.362) andthe Mountains (0.315).The HEI for urban areas is 0.620 compared with0.439 for rural areas. Urban areas surpass rural areasin all three dimensions of human empowerment. Forinstance, social empowerment in rural areas (0.372)is just 60% of that in urban areas (0.604). In terms ofeconomic empowerment, the value for rural areas is0.304, which is about 59% that of urban areas (0.5<strong>18</strong>),due to higher per capita income and better access toeconomic infrastructure and employmentopportunities. The per capita income level in ruralareas is less than half the level in urban areas. Therural–urban disparity in political empowerment isless pronounced. The political empowerment scorein urban areas (0.737) is only 15% higher than that inrural areas (0.642). The overall HEI value is highest inthe central development region (0.497), decreasingin other development regions towards east and west.SummaryThe level and intensity of poverty are closely linked tothe pace and pattern of economic growth in urbanand rural areas and the income generatingopportunities associated with such growth. Ruralpoverty is worse, primarily because agriculturalgrowth—the primary source of income andemployment generation in the rural economy—hasstagnated in per capita terms over the past fewdecades. Even within rural areas, the poorersegments of the population have less access to fertileland, irrigation, modern inputs, credit, and marketingand road infrastructure. Similarly, a key determinantof the level and intensity of both income and humanpoverty is the limited or nonexistent access to basicsocial and economic infrastructure. The rural areasare badly underserved in terms of quality andcoverage of basic education, healthcare, drinkingwater, roads, and access to other infrastructure andmarkets.Poverty is also closely related to the degree ofsocial, political, and economic inclusion orexclusion. Women and ethnic groups by and largeare left out of the mainstream of developmentbecause they lack voice, empowerment,representation, and access to economicopportunities and resources. Similarly, remotedistricts further away from centers of power andinfluence are the most neglected. Another keydeterminant, which cuts across and exacerbates theimpact of these factors on the poverty pattern, isweak governance, which includes ineffectivegovernment, poor resource allocation, weakimplementation and service delivery performance,and corruption and leakages, among other factors.LivelihoodsMajor ActivitiesThe living condition of the people of Nepal isdetermined by the amount and type of resourcesavailable and by the ways the resources are utilized.Most people still depend on environmental resourcesfor securing livelihoods. The means of livelihood isgenerally related to employment opportunities,which are the outcome of investment anddevelopment efforts in utilizing the resources.Employment is linked to the process of development.The livelihood of people is reflected through theemployment structure and the proportion of peoplegainfully employed in different economic activities.It is evident that there was a gradual shift fromtraditional agriculture to non-agricultural sectorsbetween 1991 and 2001, the most recent year forwhich reliable statistics are available (Table 2.31).The agriculture, forestry, and fishery industry isthe largest in terms of employment in each region—the Mountains, Hill, and Terai—with the highestproportion (81%) in Mountain areas (Table 2.32).The major industries are conventionallyreclassified into three broad production sectors:primary, secondary, and tertiary. The primaryproduction sector includes agriculture, forestry, andfishery. The secondary sector comprises mining andquarrying and manufacturing and construction. Thetertiary sector consists of electricity, gas and watersupply; wholesale and retail trade; transport, storageand communication; finance and business services;personal and community services; and others. Thelatter two sectors combined can also be referred asChapter 2: Rural Environment, Poverty, and Livelihood23
Table 2.31: Change in Employment Structure by Major Industries (economically active pop ulation 10 years of age andabove)1991 2001ChangeIndustryNumber % Number % (%)Agriculture, forestry, and fishery 5,959,788 81.22 6,504,688 65.70 9.14Mining and quarrying 2,361 0.03 16,049 0.16 579.75Production and industry 150,051 2.04 872,252 8.81 481.30Electricity, gas, and water supply 11,734 0.16 148,217 1.50 1163.14Construction 35,658 0.49 286,419 2.89 703.24Hotels, restaurants, and finance 256,012 3.49 984,662 9.95 284.62Transport, storage, and communications 50,808 0.69 161,637 1.63 2<strong>18</strong>.13Real estate, renting, and business activities 20,847 0.28 76,687 0.77 267.86Public administration and social security 752,019 10.25 748,916 7.56 (0.41)Other 98,302 1.34 100,669 1.02 2.41Total population 7,337,580 100.0 9,900,196 100.0 34.92Source: CBS (2003) Volume I, pp. 341 –371.Table 2.32: Percentage Distribution of EconomicallyActive Population by Major Industrial Sectors and Region,2001Industry Mountain Hill TeraiAgriculture, forestry, and fishery 80.7 68.5 59.8Mining and quarrying 0.1 0.2 0.2Manufacturing 5.3 8.1 10.2Electricity, gas, and water supply 1.3 1.5 1.6Construction 1.2 2.2 4.0Commerce 6.2 8.9 11.8Transport and communication 0.6 1.4 2.1Finance and business activities 0.2 0.8 0.9Personal and community services 3.8 6.9 7.0Others 0.5 1.3 2.2Not Stated 0.2 0.3 0.2Source: CBS (2003) Volume I, pp. 341 –371.the “non-primary production sector”. The primarysector has dominated in terms of employment inboth rural and urban areas (Table 2.33). However, thepercentage share of primary sector employmentdecreased in both rural and urban areas from 1991 to2001.Though the primary production sector’scontribution to GDP is less than that of the nonprimaryproduction sector (Table 2.34, Figure 2.3),the share of the former (38% in 2001) is stillsignificant. The non-primary sector’s contributionincreased to 62% of total GDP ($5.6 billion) in 2001from 54% in 1991.The primary production sector remains animportant source of livelihood for most rural peopleof Nepal. Table 2.35 shows that 36.5% of allTable 2.33: Percentage Distribution of EconomicallyActive Population by Major Industrial Sector for Ruraland Urban Areas, 1991 –20011991 2001 CountrySectorRural Urban Rural Urban 1991 2001Primary 85.5 60.9 72.3 42.2 81.2 65.7Secondary 1.9 12.4 10.2 <strong>18</strong>.0 2.6 11.9Tertiary 11.4 26.1 17.4 39.6 15.0 22.2Unspecified 1.2 0.6 0.2 0.3 1.2 0.2Source: CBS (2003) Volume I, pp. 341 –371.households had agricultural land, livestock, andpoultry in 2001; households with only agriculturalland and livestock were 29%; and households withonly agricultural land were 9%. Households withoutany of these assets (land, livestock, or poultry)accounted for 19%. The share of agriculturalhouseholds with all three agricultural assets is largestin Mountain and Hill areas and that of householdswith land and livestock in Mountain and Terai regions(the most common group overall in the Terai).Employment and Income StatusEmployment source is classified into three majortypes: wage employment, self-employment, andother (NLSS 2004). Self-employment is the majorsource of income in Nepal, accounting for 47% oftotal household income. It is even more dominant inrural areas (50%) and in the Mountains (60%).Income from wage labor is most important in urbanareas, accounting for 35%. Wage income and othersare the second and third important sources for thecountry, rural areas, and all three ecological regions;while in urban areas income from other sources isnext to wage employment.24 Environment Assessment of Nepal : Emerging Issues and Challenges
Figure 2.3 Contributions by the Primary and NonprimaryProduction Sectors to National GDPSource: CBS (2003)Table 2.34: Contribution to GDP by Sector (%)Sector 1991 2001Agriculture, fisheries, and forestry 46.5 37.9Mining and quarrying 0.5 0.5Manufacturing 7.0 9.5Electricity, gas, and water 1.4 1.7Construction 10.5 9.5Trade restaurant and hotel 10.7 11.8Transport and communication 5.7 7.6Finance and real estate 9.5 10.0Community and social service 8.3 9.3Total 100.0 100.0GDP = gross domestic productSource: CBS (2003) Volume I, pp. 341 –371.Table 2.35: Households Having Agricultural Land, Livestock, and Poultry by Region, 2001AssetMountains Hills Terai TotalNo. % No. % No. % No. %Agricultural land only 17,444 6.12 142,744 7.32 226,053 11.66 386,241 9.25Livestock only 1,877 0.66 16,010 0.82 104,896 5.41 122,783 2.94Poultry only 945 0.33 8,024 0.41 15,371 0.79 24,340 0.58Land and livestock 91,989 32.25 460,488 23.60 636,117 32.82 1,<strong>18</strong>8,594 28.47Land and poultry 3,517 1.23 23,156 1.19 25,573 1.32 52,246 1.25Livestock and poultry 2,539 0.89 15,735 0.81 52,278 2.70 70,552 1.69Land, livestock, and poultry 150,975 52.93 922,689 47.29 453,339 23.39 1,527,003 36.58None 15,927 5.58 362,345 <strong>18</strong>.57 424,343 21.90 802,615 19.23Total 285,213 100.00 1,951,191 100.00 1,937,970 100.00 4,174,374 100.00Source: CBS (2002a)Income 3 sources according to NLSS 2004include farm income, non-farm income,remittances, consumption of own dwelling (or rentfree dwelling), and others (renting out nonagriculturalproperty like buildings or assets,earnings, savings and deposit accounts, shares,pension, and so on). Income from the farm sectoraccounts for 48% of total household income,followed by the non-farm sector (28%), remittances(11%), consumption of own housing (10%) andothers (4%) (Table 2.36). The farm sector is the mostimportant source of household income in all threeregions, in rural areas, and in the country as a whole.The Mountain area is the most dependent on thefarm sector, followed by the Terai.There is an increasing trend of income fromremittances. The proportion of households receivingremittances from abroad increased from 23% in1995/96 to 32% in 2003/04. There has been a significantchange in the share of remittance amounts by source.Table 2.36: Share of Household Income by Source (%)RegionFarmIncomeNonfarmIncomeRemittancesOwn HousingConsumptionOtherMountain 59 19 9 10 3Hill 45 28 11 12 5Terai 49 28 12 8 3Rural 55 23 11 8 3Urban 13 54 10 17 6Nepal 48 28 11 10 4Source: NLSS (2004) Vol. 2, Table 11.2 .Eight years ago, the remittance amount from withinNepal and India accounted for 75% of total transferincome. Now, the share of other countries includingthe Gulf countries accounts for more than half of thetotal remittance amount (NLSS 2004).3Income was defined as the flow of resources in a household in the past 12 months. The main components considered in the income measure are incomes from crops,non-crop farm, reported valuation of housing consumption of own dwelling, wage employment, non-farm employment, remittances, rental, and other sources.Chapter 2: Rural Environment, Poverty, and Livelihood25
In 2004, the average annual household income(average household size 5.3) was NRs 80,111,yielding an average annual per capita income of NRs15,162 (NLSS 2004). The average per capita incomein urban areas was NRs 32,573, compared with NRs12,124 in rural areas; it was higher in the Hills (NRs<strong>18</strong>,299) than in the Terai (NRs 12,975) and theMountains (NRs 12,295).Landholding Distribution and LandFragmentationLandholding distribution and land fragmentation canbe related to population growth and distribution.Rapid population growth has increased pressure onagricultural land, resulting in encroachment ofmarginal lands on fragile hill slopes. This has seriousenvironmental repercussions.Data on area and fragmentation of landholdingshave been derived from the National Census ofAgriculture (CBS 2004), the most recent sourceavailable. These data on cultivated area are based onnational census households; however, they do notmatch the data derived from mapping sources suchas satellite imagery, aerial photographs, andtoposheets (which have been used for computingland use categories of the country). According to theagriculture census (CBS 2004), the averagelandholding size for the country in 2001/02 was 0.79ha, down from 0.95 ha in 1991/92. The pressure ofpopulation on cultivated land has increasedconsiderably. This pressure is even more severe inHill areas, where the average landholding size is now0.66 ha (Table 2.37). Households in rural areas havean average agricultural landholding of 0.8 hacompared with 0.5 ha for urban areas.Average landholdings have decreased, mainlyas a result of a decrease in the number of parcelsheld by a family (CBS 2004 and Table 2.37). Theaverage parcel size and total number of parcels haschanged little over the years. Both the averageholding size and the average parcel size are largest inthe Terai. The average parcel size is smallest, and thenumber of parcels per holding largest in mountainareas, reflecting the fragmented nature of thelandscape.The distribution of cultivated land is highlyskewed. The 2001/02 agriculture census shows that25% of the total landholdings account for over 61% ofthe total cultivated land (CBS 2004a). Although theaverage landholding size was 0.79 ha, nearly 75% offarm holdings were smaller than 0.5 hectare, andaccounted for only 39% of all cultivated land. TheNLSS shows that 45% of farmers cultivate less than0.5 ha of land and 8% of farmers cultivate 2 ha ormore. Small farmers (less than 0.5ha) cultivate only13% of all agricultural land as compared with 31%cultivated by large farmers.Production PatternThe country’s cereal crops are paddy, maize, wheat,millet, and barley. Major cash crops includesugarcane, oilseed, and potato. The area underdifferent crops is shown in Table 2.38. The croppedarea is greater than the cultivated area becausesome areas carry two or even three different crops ina year. Paddy is the principal crop in terms ofcropped area, accounting for 45% of the totalcropped area of the selected crops in the country.Young Women Preparing a Field for Winter VegetableCrops in Kathmandu ValleyB. PradhanTable 2.37: Area and Fragmentation of LandholdingsDescriptionMountain Hill Terai Country1991/92 2001/02 1991/92 2001/02 1991/92 2001/02 1991/92 2001/02Number of landholdings ('000) 260.7 298.2 1357.7 1,586.4 1117.6 1,479.5 2,736.1 3,364.1Total area of holdings ('000ha) 176.9 2<strong>18</strong>.7 1047.3 1,038.6 1374.8 1,396.7 2,598.9 2,654.0Average holding size (ha) 0.68 0.73 0.77 0.66 1.23 0.94 0.95 0.79Number of parcels ('000) 1207.0 5317.7 4282.0 10,806.2 10,987.0Average parcels per holding 4.6 3.9 3.9 4.0 3.3Average parcel size (ha) 0.15 0.21 0.32 0.23 0.24ha = hectareSource: CBS (2004) p. 112.26 Environment Assessment of Nepal : Emerging Issues and Challenges
Maize and wheat are the second and third mostimportant crops in terms of cropped area. Thesethree cereal crops have different positions in thedifferent regions. In terms of cropped area, paddy isthe most important crop in the Terai (61%); andmaize the most important crop in the Hills (38%) andMountains (29%). Likewise, paddy is the secondmost important crop in the Hills and wheat in theMountains and Terai.Among the cash crops, the Terai has the largestcropped area of oilseeds, and Hill areas the largestcropped area of potato. Sugarcane has the nextlargest cropped area in the Terai, and oilseed in theHills. Cropping intensity, measured by the totalcropped area divided by the total cultivated area, isgreater in the Terai (1.23) than in the Hills (1.11) orMountains (0.72).Figure 2.4 shows the trends in cultivated area ofcereal and cash crops from 1996 to 2002. The area ofmajor cereal crops changed marginally from 2,942thousand ha in 1996 to 3,030 thousand ha in 2000 andto 3,010 thousand ha in 2002 (CBS 2004). Thecultivated area of the three major cash cropsoilseeds, potato, and sugarcane increasedconsistently from 1996 to 2002.Despite increased production of crops, thecountry is in food deficit by 41,198 tons (Table 2.39).The Agricultural Perspective Plan estimated that 41out of 75 districts were food deficient, with thesituation in the Mountains in terms of total foodrequirement the worst. The livelihood groupsidentified as food deficient are marginal farmers(with landholdings less than 0.5 ha) in all regions;rural service providers; agricultural laborers; potters;and urban squatters. The calorie supply for Nepal is2448 kilocalories/person/day (FAO 2004). NLSSindicates that 31% of Nepalese households have lessthan adequate food consumption, and 67% justadequate (CBS 2004a). Food inadequacy is muchhigher in rural areas (34%) than in urban areas (17%).Table 2.38: Cultivated Area of Selected Crops by Region (ha)CropMountain Hill Terai Totalha % ha % ha % ha %Paddy 40,430 20.4 396,820 28.2 1,030,000 61.3 1,467,250 44.69Wheat 42,100 21.3 239,980 17.1 289,<strong>18</strong>0 17.2 571,260 17.40Maize 57,700 29.2 535,800 38.1 160,590 9.6 754,090 22.97Millet 25,120 12.7 138,500 9.9 13,020 0.8 176,640 5.38Barley 10,910 5.5 15,410 1.1 3,340 0.2 29,660 0.90Sugarcane 100 0.1 2,360 0.2 34,950 2.1 37,410 1.14Oilseeds 1,840 0.9 28,790 2.0 123,940 7.4 154,570 4.71Potato 19,550 9.9 47,130 3.4 <strong>18</strong>,900 1.1 85,580 2.61Cropped Area 197,750 100.0 1,404,920 100.0 1,680,310 100.0 3,282,980 100.00Cultivated Area 275,948 1,267,961 1,367,864 2,911,773Cropping Intensity 0.72 1.11 1.23 1.13ha = hectareSource: CBS (2001) pp. 86–175.Figure 2.4: Trends in Cultivated Area of Selected Crops,Nepal (1996-2002)Table 2.39: Fo od Production and Requirement (tons )Region Food Supply Food Required Food BalanceMountain 152,162 277,315 (125,153)Hill 932,331 1,112,563 (<strong>18</strong>0,202)Terai 1,843,793 1,579,636 264,157Country 2,928,286 2,969,514 (41,198)Source: CBS (2002a)Source: CBS (2004)Chapter 2: Rural Environment, Poverty, and Livelihood27
Mountain areas have the most food inadequatehouseholds (35%), followed by the Terai (34%) andHills (28%).There is a correlation between the level of foodinsecurity and the agricultural conditions of farmersin food deficit districts. The problems are mostsevere in remote mountainous areas where thecropping intensities and crop yields are the lowest,population of livestock per household is the highest,and the opportunities for high-value agriculturalproduction and access to off-farm employment aremost limited. The livestock on which these foodinsecurepeople depend most heavily are lowyielding due to poor health, resulting in lowproductivity, and high morbidity and mortality rates(NLSS 2004).The NLSS indicates that households growingvegetables (both winter and summer) have used thelargest amount of improved seeds (33%) followed byonion (<strong>18</strong>%) and potato (16%). Cereal crops are lessimportant in terms of use of improved seeds. Thepercentage of agricultural households usingimproved seeds is less in rural areas than urbanareas in all selected crops—paddy, wheat, maize,potato, onion, and vegetables. Paddy growers usedthe highest percentage (66%) of chemical fertilizeramong other agricultural households, followed bywheat (56%), maize (34%), potato (22%), and othercrops. Fertilizer use is less among agriculturalhouseholds in rural areas than in urban areas (NLSS2004).SummaryIn recent years Nepal’s poverty situation hasimproved significantly at national, rural, and urbanlevels. However, poverty remains a complex andmultidimensional phenomenon. Poverty is deeper,more intense, and more severe in rural areas than inurban areas as measured by parameters like adultliteracy, life expectancy, population without access tosafe water, and the human poverty index. Likewise,the intensity of poverty measured in terms of povertygap and poverty severity is greater for rural areas thanfor urban areas. Poverty is greater among thedeprived communities of rural areas.There is a big disparity between rural and urbanareas in terms of human development facilities. TheHDI in rural areas is approximately 22% lower than inurban areas and the incidence of poverty 68% higher.The HEI for rural areas is 41% lower than that forurban areas. Urban areas surpass rural areas in termsof social, economic, and political dimensions ofhuman empowerment. The low level of ruraleconomic empowerment is due to limited access toproductive assets and lack of gainful employmentFarmyard Manure for the Next Crops in the Countrysideof Kathmanduopportunities. The low level of social empowermentof rural areas is due to attributes like poor access tosocial infrastructure (education, health, andcommunication media) and income-earningopportunities. As a result of hardship and inaccessibility,and limited access to economic infrastructure,productive assets, and employment outsideagriculture, Mountain areas lag behind other regionsin all three dimensions of human empowerment andtherefore rank among the lowest levels of economicdevelopment. The level of political empowerment isrelatively better than that of social and economicempowerment, in all areas: rural or urban, andregions. However, the current level of both economicand social empowerment remains far too low toeffectively address the overarching goal of povertyreduction on a sustained basis.Rural households derive their incomes largelyfrom agriculture through self-employment and wageemployment, and they are most dependent on theagricultural sector for their livelihoods. This alsosuggests that opportunities for non-agriculturalemployment are limited in rural areas. Hill areasprovide relatively better opportunities for nonagriculturalemployment than the Terai or theMountains, whereas wage agricultural employmentis highest in the Terai, indicating that there aresignificant numbers of marginal farmers or landlesspoor people in the Terai.Disparities occur not only between rural andurban areas and among the regions, but alsobetween upper and lower social classes. However,past development efforts have remained largelyunsuccessful in attaining equitable and inclusivedevelopment of deprived areas and communitiesinto the national mainstream. A major element of theTenth Plan’s poverty reduction strategy is to begin toclose this gap as rapidly as possible bymainstreaming deprived communities and regions inthe development process. The existing mismatchbetween socioeconomic and political empower-B. Pradhan28 Environment Assessment of Nepal : Emerging Issues and Challenges
ment also indicates a need for more balancedinterventions on all three fronts of sustainableempowerment and poverty reduction.Livelihood security comes from both economicsecurity and environmental security. In the context ofNepal, economic security overall has improved witha decline in the level of those living below the povertyline. However, when the data are disaggregated byregion and income groups, it seems that conditionsregarding food security might have worsened forsome. The conflict situation has worsened Nepal’soverall economic situation and environmental status.BibliographyAdiga, P.B. 1998. “Some Environmental Concerns to beAddressed in the Nepal Irrigation Sector Project.”WECS Bulletin 9(1): 19–22.Amatya, V.B., and G.R. Shrestha. 1998. “Review on Policiesand Their Implications on Renewable EnergyTechnologies.” In Renewable Energy Technologies: ABrighter Future, edited by K. Rijal. Kathmandu:International <strong>Centre</strong> for Integrated MountainDevelopment.Central Bureau of Statistics (CBS). 2001. Statistical YearBook of Nepal 2001. Kathmandu.———.2002a. National Census of Agriculture. Kathmandu.———.2002b. Population Census 2001. Kathmandu.———.2003. Population Monograph of Nepal, Volumes Iand II. Kathmandu.———.2004. Hand<strong>book</strong> of Environment Statistics 2003.Kathmandu.Central Department of Geography (CDG). 2001. “PhysicalDevelopment of Human Settlements and EmergingTowns along the Banepa-Bardibas HighwayCorridor.” Study report prepared by CDG, TribhuvanUniversity, for Department of Urban Developmentand Building Construction, Ministry of PhysicalPlanning and Works, Kathmandu.———.2004. National Concept of Compact Settlement inNepal. Kathmandu: Tribhuban University CentralDepartment of Geography/Department of UrbanDevelopment and Building Construction.Department for International Development (DFID). 1998.Gaining Ground with Bio-Engineering. Kathmandu.Department of Education (DOE). 2000. School LevelEducational Statistics of Nepal 2000. Kathmandu.Department of Health Sciences (DOHS). 1999. AnnualReport 1998/1999. Kathmandu.———.2003. Annual Report 2001/2002. Kathmandu.Department of Roads (DOR). 2000. EnvironmentalAssessment in the Road Sector of Nepal (Policy<strong>Document</strong>). Kathmandu.———.2002. Nepal Road Statistics. Kathmandu.Department of Water Supply and Sewerage (DWSS). 2002.Rural Water and Sanitation Project Nepal.Kathmandu. Available: http://www.fao.org/faostat/faostat2_en.aspFood and Agriculture Organization (FAO). FAOSTAT onlinestatistical service. Rome. Available:http://www.fao.org/faostat/faostat2_en.aspHis Majesty’s Government of Nepal. 1999. Local SelfGovernance Act 1999. Kathmandu: Ministry ofLaw and Justice.IUCN (The World Conservation Union). 2002. People andConservation: Improving Livelihoods andEcosystems. Kathmandu.Japan Forest Technology Association (JAFTA). 2001.“Information System Development Project for theManagement of Tropical Forest.” Activity Report ofWide Area Tropical Forest Resources Survey(Kingdom of Nepal), Japan Forest TechnologyAssociation, Kathmandu.Intermediate Technology Development Group (ITDG).2004. Smoke, Health and Household Energy:Participatory Methods for Design, Installation,Monitoring and Assessing Smoke AlleviationTechnologies, Vol. 1. Kathmandu.Kenting Earth Science (KES). 1986. “Land ResourceMapping Project: Land Utilisation Report.”Department of Survey/Kenting EarthScience/Canadian International DevelopmentAgency, Kathmandu.Metcalf and Eddy. 1999. “Urban Water Supply Reforms inthe Kathmandu Valley.” Wastewater ManagementAssessment, CEMAT, Kathmandu.Ministry of Agriculture and Cooperatives (MOAC). 2001.Statistical Information on Nepalese Agriculture.Kathmandu.Nepal Demographic and Health Survey (NDHS). 2001.Nepal Demographic and Health Survey 2001.Kathmandu: His Majesty’s Government of Nepal,Ministry of Health, New Era, and ORC Macro.Nepal Health Research Council (NHRC). 2004. SituationalAnalysis of Indoor Air Pollution and DevelopmentGuidelines for Indoor Air Quality Assessment andHouse Building for Health. Kathmandu.Nepal Living Standards Survey (NLSS). 2004. Nepal LivingStandards Survey 2003/2004: Statistical Report,Volumes 1 and 2. Kathmandu: His Majesty’sGovernment of Nepal, Central Bureau of Statistics.National Planning Commission (NPC). 2002. Tenth Plan(2002–2007). Kathmandu.Pradhan, P.K. 2004. Rural-Urban Relations with SpecialReference to Nepal. Kathmandu: Rural UrbanPartnership Programme, United NationsDevelopment Programme, and His Majesty’sGovernment of Nepal, Ministry of LocalDevelopment.Chapter 2: Rural Environment, Poverty, and Livelihood29
Schaffner, U. 1987. “Road Construction in the NepalHimalaya: the Experience from the Lamosangu-JiriRoad Project.” ICIMOD Occasional Paper No. 8,International <strong>Centre</strong> for Integrated MountainDevelopment, Kathmandu.Sijapati, S., B. Pradhan, and U. Parajuli. 2004. IrrigationStrategy for Nepal in the Context of Arsenic Threat:Preliminary Perspectives from the Narayani IrrigationCommand Area. Kathmandu: Food and AgricultureOrganization.United Nations Development Programme (UNDP). 2001.Nepal Human Development Report 2001:Poverty Reduction and Governance. Kathmandu.———.2004. Nepal Human Development Index Report2004. Kathmandu.30 Environment Assessment of Nepal : Emerging Issues and Challenges
Chapter 3Land Resources and LandDegradationLand ResourcesLand is a nonrenewable (fixed stock) resource,although it has a renewable capacity to supportmost forms of biological life. Land, on whichactivities such as agriculture, forestry, and pasturedepend, constitutes about 97% of Nepal’s total area.But not all land can be used; the country’stopography is rugged with over three-quarters of thetotal area made up of mountains and inter-mountainvalleys. The Terai plain makes up less than one-thirdof the total area but has the largest cultivated areaand population. The Hills, which have traditionallyhad the bulk of the population, constitute the largestarea but are geologically fragile; over time this area’srelative share of the population has reduced in favorof the Terai.Nepal is an agrarian country with over 60% of itseconomically active population dependent onagriculture, so agricultural and forest lands are veryimportant. Forest covers the largest part of the landarea (37%) and is a major source of fuelwood as wellas an important factor protecting biodiversity, water,and other watershed resources. The Land ResourceMapping Project (LRMP 1986) and Japan ForestTechnology Association (JAFTA 2001) are two of themajor sources of forest data, although they are notdirectly comparable in their classification of landuses and survey techniques. The information for thefirst source was derived from analysis of aerialphotographs together with ground truthing, while thelatter was derived from the digital analysis of satelliteimages. These are the best available sources for dataon distribution of land resources by district, and forthe purposes of this report, their data were madecomparable by generating new broad land-useclassifications. Data available at district level havebeen aggregated into the Mountain, Hill and Terairegions. When interpreting these data, it should beremembered that not only were differentmethodologies used but also the figures do notdifferentiate in terms of crown cover or othermeasures of forest health. For example, even amarked level of deforestation would not be apparent,if crown cover remained above 10%.The people:land ratio is used to examine thepressure of population on land resources availablefor cultivation; for 2001 it was 5.7 persons per hectare(pph), compared with 5.6 pph in 1981 (CBS 2003)—an insignificant change during the last two decades.The Mountain zone has the lowest ratio with 3.3 pph,followed by Terai (6.0 pph) and Hill (6.2 pph) zones.The people:land ratio ranges from 1.6 pph forSolukhumbu to 383.7 pph for Dolpa (both mountaindistricts). However, this is a crude method forassessing the population and land resourcerelationship. It does not consider the quality of landand the ways land resources are used.Economic (agricultural) density measures theratio between the share of total population and theshare of total agricultural production by weight. Table3.1 shows that the economic density (ED) is highestfor the Mountains and lowest for the Terai.Secondary Growth TreesLand Use and Land Cover ChangeThe distribution of land according to land use types isshown in Table 3.2. Agricultural land is an importantresource, it occupied 23.5% of total land uses in 1986increasing to 28% in 2000. Expansion of agriculturalland is a major problem, as it continues to expand toICIMOD fileChapter 3: Land Resources and Land Degradation31
Table 3.1: Agricultural Economic Density, 2001RegionAgriculturalProduction(tons) a Population b Share ofPopulation (SP)Share of AgriculturalProduction (SA)ED =100Mountain 597,290 1,687,859 0.073 0.052 140.7Hill 3,900,035 10,251,111 0.443 0.338 130.9Terai 7,033,000 11,212,453 0.484 0.610 79.4Nepal 11,530,325 23,151,423ED = economic densitySource: a MOA (2002), b CBS (2002)SP SA Table 3.2: Distribution of Land Uses by RegionLand Use Category1986 a 2000 b Change 1986–2000Area Area Area(ha) (%) (ha) (%) (ha) (%)Agriculture 3,461,069 23.52 4,150,979 28.10 689,910 19.93Forest (including shrub) 6,211,522 42.20 6,788,292 46.12 576,770 9.29Other 5,045,509 34.28 3,778,829 25.67 (1,266,680) (25.11)Nepal 14,7<strong>18</strong>,100 100 14,7<strong>18</strong>,100 100ha = hectareNote: To make the LRMP and JAFTA sources comparable, three broad land use categories were obtained. According to the LRMP definition, shrubland has beenincluded in the forest category; no change was made in the agricultural category in either source; and other land uses such as grazing, water bodies, snow, rocky andbarren land, and built -up areas have bee n included under the “ other” category.Source: a LRMP (1986); b JAFTA (2001)meet the growing demands of the population. Eachyear, the increasing population is forced to remain inagriculture because of very limited opportunities innon-farm activities.Table 3.2 shows that total forest coverageincluding shrub apparently increased between 1986and 2000, however this may be the result of thedifferent forest survey methods used rather thanreflecting a real change (see above). Although moreland is being used for agriculture overall, the mostfertile lands are being converted to non-agriculturaluses for urban areas, industries, road construction,and biodiversity conservation or buffer zoneconservation. Large cities are encroaching uponprime agricultural land. This increment could beIntercropping between TreesICIMOD filecausing the decrease in the “other” land usecategory (Table 3.2).The overall share of agricultural land apparentlyincreased from 24% in 1986 to 28% in 2000 althoughit declined in the Hills (Table 3.3). The overall percapita agricultural land declined slightly from 0.19 hato 0.<strong>18</strong> ha, but the main decline was in the Hills whilein the Mountain region it increased.The share of forest land apparently increasedfrom 42% in 1986 to 46% in 2000 as a result ofincreases in the Mountains and Hills; the Terai forestarea declined (Table 3.3). The overall per capitaforest area declined from 0.34 hectare (ha) in 1986 to0.29 ha in 2000, although there was a slight increasein the Hill region.At the national level, both forest and agriculturalland resources have increased, which could be dueto a decrease in the area devoted to other land uses,but the per capita area of both resources hasdecreased, mainly because of population growth.Land DegradationLand degradation generally refers to loss of utility orpotential utility of land or to the reduction, loss, orchange of features of land or organisms that cannotbe replaced (Barrow 1991). Land is degraded whenit suffers a loss of intrinsic qualities or a decline in itscapabilities.32 Environment Assessment of Nepal : Emerging Issues and Challenges
Table 3.3: Change in Agricultural and Forest Lands by RegionRegionAgricultural Land(%)Per Capita Agricultural Land(ha)Forest Land(%)Per Capita Forest Land(ha)1986 a 2000 b 1986 a 2000 b 1986 a 2000 b 1986 a 2000 bMountain 5.33 10.02 0.19 0.31 27.50 31.03 0.99 0.95Hill 33.37 28.06 0.24 0.17 50.06 62.89 0.36 0.38Terai 41.57 56.17 0.16 0.17 50.43 38.88 0.20 0.12Nepal 23.52 28.20 0.19 0.<strong>18</strong> 42.20 46.12 0.34 0.29ha = hectareNote: The population for de nsity computation of agricultural and forest resources in 1986 and 2000 is based on the 1991 and 2001 population censusesrespectively.Source: a LRMP (1986); b JAFTA (2001)Environments and ecosystems are increasinglymore controlled or disrupted and degraded byhuman activities. Landslides, topsoil erosion,siltation, and salinization are different forms of landdegradation. Visible forms of land degradationinclude dust storms, deep gullies, and landslides.Figure 3.1: Land Degradation and Financial Loss Due toFloods and LandslidesCauses of Land DegradationThe magnitude of land degradation in a placedepends on the local geology, land type, landform,land use, rainfall intensity, and human activity. Landdegradation results from any causative factor orcombination of factors that reduces the physical,chemical, or biological status of land and which mayrestrict the land’s productive capacity. Landdegradation is due to (a) natural (biogeophysical)causes, (b) human causes, or (c) a combination ofboth. Owing to the complex features of the mountainterrain, the nature of land degradation varies greatlyin Nepal.Landslides are the most important factor in landdegradation in Nepal. Landslides occur almost everyyear, particularly in the sloping areas of highmountains and low hills during the monsoon season.The consequences of landslides include topsoilerosion; damaged and destroyed roads, trails, andbridges; loss of land, lives, and property; and siltationin low-lying areas resulting in unproductive land(Figure 3.1). About 1.8 million ha (13%) of the land inthe Mountains is estimated to be severely degradedby landslides (CBS 1998).Table 3.4 provides information on soil erosionrates for different land uses, rock types, and slopelevels in the country. The soil erosion rate is higher inthe unmanaged land use category and on steepslopes than in the managed land use category.Similarly, intensity of soil loss is found less incultivated lowlands than in rain-fed sloping terraces,ranging from as low as 7.8 tons/ha/year in theforested Siwalik hills to as much as 570 tons/ha/yearin the unforested midhills (CBS 2004). In the middleHills of Nepal the rate of soil loss in grassland is 0.7-Source: CBS (1998)Bare Land Exposed to Erosion, MustangB. PradhanChapter 3: Land Resources and Land Degradation33
Table 3.4: Estimated Soil Erosion Rates at Selected Sites in NepalSiwalik RangeMiddleMountainha = hectareSource: CBS (2004) Table 4.36.Location and CharacteristicsLand UseErosion Rate(tons/ha/year )Eastern Nepal: south aspect, sandstone foot Forest to grazinghills7.8–36.8Far West Nepal: south aspect , sandstone, Degraded forest 20.0foot hills of SurkhetGully land 40.0Degraded, heavily grazed gully land 200.0Central Nepal: Mahabharat Lek, steep slope, Degraded forest and agricultural land 31.5–40.0metamorphic and sedimentary rocks Gully land 63.0–420.0Degraded forest and shrub land 27.0–45.0Kathmandu Valley: northern foothills Overgrazed shrub land 43.0Severe gully land 125.0–570.0Kathmandu Valley: south Dense forest (75%) 8.0Pokhara Valley: Phewa Tal wate rshed Protected pasture 9.2Overgrazed grass land 22.0–347.0Gully, overgrazed grass land 29.08.7 tons/ha/year, which is less than the 2.5–16.4tons/ha/year over cultivated terraces. Likewise therate of land loss in open degraded areas is 25–40tons/ha/year compared with 3–25 tons/ha/year fromcultivated outward sloping terraces (ICIMOD 1998).However, erosion rates in excess of 200 tons/ha/yearare common in grazing lands below 1,000 maslwhere there is overgrazing, which causes gullyerosion (Carson 1992).Owing to weak geological formations such asshallow and coarse lands and loosely compactedrocks, the Churia hills are more vulnerable to rainfallthan the mountain areas. As a result, the bare slopesof the Churia hills are readily exposed to degradationevery rainy season. The meteorological data showthat the Churia hills receive much more intenserainfall than the northern high mountains. IntenseGlacial Lake Outburst Flood EventsThe periodic or occasional release of large amounts ofstored water in a catastrophic outburst flood is referredto as a glacial lake outburst flood (GLOF). GLOF events aresevere geomorphological hazards and their floodwaterscan wreak havoc on all human structures located in theirpath. Much of the damage created during GLOF events isassociated with the large amount of debris thataccompanies the floodwaters. Damage to settlements andfarmland can take place at very great distances from theoutburst source. In Nepal, GLOFs have caused extensivedamage to major infrastructure like roads, bridges,trekking trials, and villages, as well as incurring loss ofhuman life (WECS 1996). The government hasundertaken some mitigation steps to minimise the riskfrom one lake by establishing a telemetric early warningsystem in Tsho Rolpa and lower areas that could beaffected. The open canal constructed to lower the lakelevel of Tsho Rolpa Glacial Lake has been operating sinceJune 2000.Source: Mool et al. (2001)soil loss from the Churia hills takes place during thepre-monsoon season when there is less vegetativecover. About 60–80% of all annual soil loss occursduring the pre-monsoon season (DSCWM 1999).The mountain terrain is rugged andcharacterized by unstable, steep slopes, making itvulnerable to exogenous factors. The torrentialmonsoon rainfall that occurs within a short span oftime is an important cause of soil erosion. Differentforms of mass wasting such as landslides, slumps,rock falls, and river cuttings also contribute tosedimentation in the valleys, plains, and river basinsand cause degradation of soil fertility.The Himalayas (covering 15% of Nepal’s area)are also susceptible to land degradation from glaciallake outburst floods (GLOF). Since the second half ofthe 20th century, the high mountains have beenexperiencing melting of their large glaciers, resultingin the formation of a large number of glacial lakesbehind the unstable “dams” formed from the nowexposed end moraines. A slight disturbance canbreak the balance of the dam, resulting in an abruptrelease of a great amount of water and generatingfloods that can cause serious damage toinfrastructure, houses, and the environmentdownstream. A recent study identified 27 potentiallydangerous lakes in the Nepal Himalayas, and foundthat GLOF events had occurred in 10 of them in pastyears (Mool et al. 2001). Nepal experienced its mostcatastrophic glacial lake outburst from the Dig Tshoin 1985.Anthropogenic activity is equally significant forland degradation. Deforestation, overgrazing,inappropriate use of agro-chemicals, productionintensification, shifting cultivation with a shortenedcycle, development work, maldistribution oflandholdings, industrial waste, and others are allimportant causes of land degradation.34 Environment Assessment of Nepal : Emerging Issues and Challenges
Clearing forests for cultivation to meet the foodrequirements of the growing population, particularlyover the sloping areas of the middle Hills, hasresulted in accelerated soil erosion, decliningproductivity, and sedimentation in downstreamareas and the Terai plains (Zimsky 1999). Forestresources have also been pressured by increasingnumbers of livestock, from 14.9 million head(equivalent to 9,790 thousand livestock units (LU) in1984 to 17.6 million head (11,226 thousand LU) in1998. The increasing livestock population hasincreased the demand for fodder and leaf litter fromthe forest, causing land erosion especially in the midHill region.Land degradation due to desertification hasbeen seen over about 10,000 ha of dry and cold landin the western <strong>Himalayan</strong> districts such as Dolpa andMustang. This is mainly due to scanty vegetation onmarginal land grazed by an excessive number oflivestock.Agricultural land is subject to ever-greaterintensification of use through double and multiplecropping to produce more food for the increasingpopulation. Soil micronutrients are depleting due tooveruse, inadequate supplements, and imbalancedapplication of fertilizers. For instance, the most recentdata available (DOA 2000) show low or mediumnitrogen content in 48% and 40% of of 9,827 farmlandsamples analyzed; 64% of 7,520 farmland samples hadlow organic matter and high to medium potassiumcontent and 35% had low phosphorous content andoverall deficiency in micronutrients such as zinc,manganese, molybdenum, copper, iron, and boron.These results indicate the highly nutrientdeficient status of farmland. As a result, productivityof crops has declined. The impact appears to bemuch more serious among poor farmers who mostlycultivate marginal lands on steeper slopes. The yieldsof maize and millet declined by more than 4% perannum between 1977 and 1997, while those of paddyand wheat increased by 16–37% per annum, duemainly to increased use of agro-chemicals (MOA1999). The use of high yielding seeds has increasedthe yield of crops per unit of land, but has resulted inless production of crop residues and greater uptakeof soil nutrients. This has forced farmers to dependmore on fertilizers than on manure, as well as to usedifferent types of insecticides and pesticides.Consumption of fertilizers (nitrogen, phosphate, andpotassium) increased from 7 kg/ha per year in 1980to 25 kg/ha per year in 1993.Average use of fertilizer by district ranges fromless than 10 kg/ha to more than 100 kg/ha. Thefertilizer use by Nepalese farmers is lowest amongthe South Asian countries. The use of pesticides is onthe increase. In 1998, the most recent year for whichreliable data are available, about 250 types ofpesticide, 40 types of herbicide, and various differentfungicides were used to minimize the loss ofagricultural production to pests and insects (MOF1999). However, despite the use of pesticides, cropyields have not increased significantly even thoughthe land ecology has been degraded. In commercialfarming, the national average consumption rate ofpesticides was estimated at 650 g/ha. In 1997, thePesticides Registration Office at the Department ofAgriculture estimated that about 60 tons of differentpesticides were imported into Nepal.Land ownership patterns are another cause ofland degradation. The agricultural statistics (CBS2004) indicate that the marginalized and smallfarmers with landholdings below one hectareaccount for 69% of all farmers, but these farms coveronly 31% of the total landholding area. As describedearlier, there has been an increase in the number offarmland holdings, while the average holding sizehas decreased.The land system in and around major urbanareas is affected by solid waste disposal. Productionof municipal waste increased from 0.144 million tonsin 1984 to 0.330 million tons in 1997 (CBS 1998; morerecent statistics are not available). Production oftoxic and hazardous waste increased from 270 to 512tons over the same time interval (Tuladhar 1999).This waste is disposed on land surrounding towns orin water bodies without any treatment.Land degradation is often seen as a side-effectof development work such as construction of roadsand irrigation canals along hill slopes, which havecontributed to landslides and land erosion. Laban(1979) estimated that 5% of all landslides in Nepalare associated with roads and trails. Theconstruction of roads is on the rise, and after roadsare built they are usually ravaged by recurrentlandslides and rock falls during the monsoon season.Stone quarrying can also lead to landslides andsoil erosion; however, no hard data are available.Impacts of Land DegradationOne of the direct impacts of land degradation is theloss of topsoil, which together with organic matterand plant nutrients influences soil fertility. Loss of soilat the rate of 5 tons/ha is equivalent to a loss of 75kg/ha of organic matter, 3.8 kg/ha of nitrogen, 10kg/ha of potassium, and 5 kg/ha of phosphorous inthe middle hills of Nepal (Carson 1992). Thecountry’s major rivers carry away thousands of tonsof sediment annually, but a large part of this occursnaturally and a significant part is composed ofriverbed load, embankment erosion, and similarcomponents.Chapter 3: Land Resources and Land Degradation35
B. PradhanImpacts of land degradation like landslides andland erosion are the most pressing problems inNepal. These occur every year during the rainyseason. While landslides and land erosion mostlyoccur in the Hills and Mountains, floods occur in thevalleys and the Terai plains. Floods wash away landor deposit debris, but in some situations floodingadds alluvium which is good for soil fertility.The loss of life and property as a result of floodsand other natural disasters is discussed below.Land Degradation ControlMeasuresLand degradation is an important factor hinderingagricultural production in Nepal. Governmentmeasures to conserve the land resource and itsproper planning and development includeestablishing the Department of Soil Conservation andWatershed Management in 1974, and formulation ofthe Soil and Watershed Conservation Act (1982) andits Regulations (1985) to protect watersheds. Butthese legal instruments are very restrictive andtherefore have not been implemented. At presentDSCWM is introducing a process to amend theselaws.Human Pressure on Land—Terraced Fields used for CropsCommunity forestry has been a successfulpolicy initiative in controlling land degradation. Itsaims are to manage forest resources and use offorest products by involving local communities.According to the Department of Forest, by February2000 more than 650,000 ha of public forests had beengiven to local forest user groups to be managed ascommunity forests. Local control of communitymanagedforests has led to increases in productivityand biomass because of strict protection from fires,free grazing, and uncontrolled cutting. Theseprotection activities have encouraged naturalregeneration of forest cover and helped stabilizegentle slopes. Because of the increased forest cover,the water regime (both yield and quality) hasimproved at the micro-watershed level (Mathema etal. 1998).The Agricultural Perspective Plan has identifiedfertilizer input as a major contributing factor toaccelerating agricultural growth. The Ninth Plan(NPC 1999) recognized that there is now a need tohave sound land management programs to maintainland quality and fertility. The Plan also envisagedformulation of a Fertilizer Act and the establishmentof a Fertilizer Unit at the Ministry of Agriculture,though these have not yet come to pass.Nepal has signed various internationalconventions and treaties related to conservation ofland. The UN Convention to Combat Desertification(June 1994) was signed by Nepal on October 12,1995, and obliges Nepal to combat desertificationand to prepare a national action plan includingprograms for poverty reduction, which is closelyrelated to land degradation.Natural Disasters and VulnerabilityPhysical changes are a part of nature, and humanshave learned to cope with these changes quite well.However, time and again these events turn veryviolent and then tragedy strikes resulting in hugesuffering and loss of lives and assets. If the Himalayasare a part of these natural events, the floods in thesouthern plains are also an integral part of this cycleof change.As human activities increase significantly evenin environmentally sensitive areas, people becomevulnerable to all sorts of natural events. Whatyesterday was seen as a normal natural event istoday poised to be a natural disaster because of theimpact on humans as steep slopes and flood plainsare settled, as heavy construction is undertaken inhighly seismic zones without adequate safeguards,and as natural systems are altered by construction,pollution, and excessive harvesting of resources.Clearly natural processes will not stop or alter tosuit human needs, although many “natural” changesare also now understood to be anthropogenic. Wehave only one planet and our survival depends on allthe life support systems being able to functionadequately. Natural events are an integral part of thisprocess, and it is humans who should change theirbehavior and make the necessary adaptations. Thechallenge for poor countries like Nepal is to developthe capability first to understand the ongoingchanges and then to be able to alter activities asneeded both in the short and long term.Tables 3.5 and 3.6 show examples of losses oflives and property by type of disaster and year. In36 Environment Assessment of Nepal : Emerging Issues and Challenges
Table 3.5: Loss of Lives and Property by Different Types of Disasters in Nepal in 2002Type of DisasterPeopleDeaths Missing InjuredAffectedFamiliesLivestockLossHousesDestroyedCattle ShedDestroyedEstimatedLoss(NRs ‘000)Floods andLandslides441 21 265 39,309 2,024 <strong>18</strong>,<strong>18</strong>1 775 4<strong>18</strong>,915Fire 11 0 6 1,387 100 1,604 37 94,739Epidemics 0 0 0 0 0 0Windstorm 3 0 227 70 45 4,847Hailstorm 0 0 0 0 0 7,000Lightning 3 0 16 12 2 1 0 63Earthquake 0 0 0 0 0 0Total 458 21 287 40,935 2,126 19,856 857 525,564Source: CBS (2004) Tables 5.19 –5.20.Table 3.6: Disaster Casualties 1995 -2002YearDeathsPeopleInjuredLivestockLossHomesDestroyedAffectedFamiliesLand Affected(ha)Estimated Loss(million NRs)1995 873 1,937 2,053 10,275 134,210 41,870 1,9331996 895 1,523 2,480 30,014 58,320 6,060 1,5791997 1,160 1,120 1,191 4,825 46,050 6,060 4101998 1,190 117 1,179 15,082 36,980 320 1,2301999 1,466 146 65 4,304 17,840 <strong>18</strong>0 5092000 377 162 1,017 6,886 24,900 880 1,1412001 415 132 665 6,103 15,900 — 5262002 458 287 2,126 19,856 40,930 10,070 525— = not available, ha = hectareSource: CBS (2004) Tables 5.19 –5.20.2002, 458 deaths were attributed to different naturalcalamities with financial losses amounting to some$7 million (Table 3.5). The impacts are greater whenpeople have no opportunity to choose alternativelivelihoods or dwelling sites. In two earlier episodesin 1984 and 1993, 363 and 1,336 deaths of peoplewere caused by landslides and floods and financiallosses were incurred amounting to $1.9 million and$99.1 million (DPTC 1997).Nepal is highly vulnerable to droughts, floods,earthquakes, landslides, forest fires, storms andhailstorms, avalanches, glacial lake outburst floods,and the effects of global warming. Of the 75 districtsin the country, 49 are prone to floods and/orlandslides, 23 to fire, and one to wind storms. A totalof 64 out of 75 districts are prone to disasters of sometype according to the Department of Narcotics andDisaster Management. Many of these naturaldisasters cannot be stopped. However, to minimizethe human and other losses that are incurred, betterunderstanding of traditional coping mechanisms andtheir modification to suit present reality has becomean urgent necessity at the local, district, and nationallevels. The threats to very costly infrastructure arevery real and every known precaution is necessary.Even the practice of environmental impactassessment is quite recent and has a long way to go.Settlement and building guidelines should beproperly developed and enforced to improvepreparedness against earthquakes and floods. Thereis still no close monitoring of the different naturaldisasters, and without a proper understandingresponses will be limited in scope and content.BibliographyBarrow, C.J. 1991. Land Degradation: Development andBreakdown of Terrestrial Environments. London:Cambridge University Press.Biodiversity Profiles Project (BPP). 1995. Biodiversity Profileof the High Mountains and High Himal PhysiographicZones. Biodiversity Profile Project Publication No. 14,Kathmandu: His Majesty’s Government of Nepal,Department of National Parks and WildlifeConservationChapter 3: Land Resources and Land Degradation37
Carson, B. 1985. “Erosion and Sedimentation Processes inthe Nepalese Himalaya.” ICIMOD Occasional PaperNo.1, International <strong>Centre</strong> for Integrated MountainDevelopment, Kathmandu.———.1992. “The Land, the Farmer and the Future—ALand Fertility Management Strategy for Nepal.”ICIMOD Occasional Paper No. 21, International<strong>Centre</strong> for Integrated Mountain Development,Kathmandu.Central Bureau of Statistics (CBS). 1998. A Compendium onEnvironmental Statistics 1998. Kathmandu.———.1999. Statistical Year Book of Nepal. Kathmandu.———.2002. Population Census 2001. Kathmandu.———.2003. Population Monograph of Nepal, Vol. II.Kathmandu.———.2004. Hand<strong>book</strong> of Environment Statistics 2003.Kathmandu.Department of Forest Resources and Survey (DFRS). 1999.“Forest Resources of Nepal (1987–1998).”Publication No. 74, Department of Forest Resourcesand Survey, Kathmandu.Department of Agriculture (DOA). 1999. Annual Report ofLand Science Programs 1998/1999. Kathmandu.———. 2000. Annual Report of Land Science Programs1999/2000. Kathmandu.Disaster Prevention Training Center (DPTC). 1997. AnnualDisaster Review 1996. Kathmandu: Water InducedDisaster Prevention <strong>Centre</strong>.Department of Soil Conservation and WatershedManagement (DSCWM). 1999. “Erosion ProcessMonitoring at Tistung of Kulekhani Watershed.”Annual Report 1998, His majesty’s Government ofNepal, Department of Soil Conservation andWatershed Management, Kathmandu.International <strong>Centre</strong> for Integrated Mountain Development(ICIMOD). 1998. “Land Erosion Studies in JhikhuKhola and Yarsha Khola Watershed.” AnnualTechnical Progress Report 1997, His Majesty’sGovernment of Nepal, Department of SoilConservation and Watershed Management andInternational <strong>Centre</strong> for Integrated MountainDevelopment, Kathmandu.Japan Forest Technology Association (JAFTA). 2001.“Information System Development Project for theManagement of Tropical Forest.” Activity Report ofWide Area Tropical Forest Resources Survey(Kingdom of Nepal), Japan Forest TechnologyAssociation, Kathmandu.Laban, P. 1979. “Landslide Occurrence in Nepal.” IWMWorking Paper 13, Integrated WatershedManagement, Torrent Control and Land UseDevelopment Project, Food and AgricultureOrganization, His Majesty’s Government of Nepal,and United Nations Development Programme,Kathmandu.Land Resource Mapping Project (LRMP). 1986. “LandUtilisation Report.” His Majesty’s Government ofNepal, Survey Department/Land Resource MappingProject, Kathmandu.Mathema, P., K.B. Shrestha, and K.M. Sthapit. 1998.“Community Forest Management in Nepal:Implications for Policy and Human ResourceDevelopment.” Paper presented at the RegionalWorkshop on Participatory Forest Management:Implications for Policy and Human ResourceDevelopment, 7–12 May, The People’s Republic ofChina.Ministry of Agriculture (MOA). 1999. Statistical Informationon Nepalese Agriculture 1998/1999. Kathmandu.———.2002. Statistical Information on NepaleseAgriculture 2000/2001. Kathmandu.Ministry of Finance (MOF). 1999. Economic Survey(FY1998/1999). Kathmandu.Mool, P.K., S.R. Bajracharya, and S.P. Joshi. 2001. Inventoryof Glaciers, Glacial Lakes and Glacial Lake OutburstFloods, Monitoring and Early Warning System in theHindu Kush-<strong>Himalayan</strong> Region. Kathmandu:International <strong>Centre</strong> for Integrated MountainDevelopment.National Planning Commission (NPC). 1999. Ninth Plan(1997–2002). Kathmandu.Ries, J. 1991. “Man Made Land Erosion in the HighMountain Region: A Case Study of Bamti/Bhandar.”In Land Fertility and Erosion Issues in the MiddleMountains of Nepal, pp. 135–151, edited by P.B. Shah,H. Schreier, S. Brown, and K.W. Riley. Kathmandu:International <strong>Centre</strong> for Integrated MountainDevelopment and UBC.Trade Promotion <strong>Centre</strong> (TPC). 1998. Nepal OverseasTrade Statistics. Kathmandu.Tuladhar, B. 1999. Hazardous Waste Management Nepal:Country Report. Kathmandu: World HealthOrganization.Wagley, M.P. 1995. “Status of Watershed Management inNepal.” In The Status of Watershed Management inAsia, edited by P.N. Sharma, and M.P. Wagley.Kathmandu: Food and Agriculture Organization.Water and Energy Commission Secretariat (WECS). 1996.Report on the Investigations of Tsho Rolpa GlacierLake, Rolwaling Valley. Kathmandu: Water andEnergy Commission Secretariat/Japan InternationalCooperation Agency.Wymann, S. 1991. “Land Use Intensification and LandFertility in Agricultural Land: A Case Study in theDhulikhel Khola Watershed.” In Land Fertility andErosion Issues in the Middle Mountains of Nepal, pp.253–259, edited by P.B. Shah, H. Schreier, S. Brown,and K.W. Riley. Kathmandu: International <strong>Centre</strong> forIntegrated Mountain Development.Zimsky, M. 1999. “National Biodiversity Action Plan.” Draftreport. His Majesty’s Government of Nepal, Ministryof Forest and Soil Conservation, Kathmandu.38 Environment Assessment of Nepal : Emerging Issues and Challenges
Chapter 4Forestry and BiodiversityForestryForest Resources and Their UseThe forest in Nepal is defined as all lands havingtrees with more than 10% crown cover (DFRS1999). Covering 37% of the country’s total area(JAFTA 2000), the forest is, Nepal’s largest naturalresource. Forest types range from sub-tropicalhardwood to softwood. The forest has threeimportant functions: production of goods (firewood,fodder, timber, and herbs), protection of the naturalenvironment, and regulation of atmosphericconditions. Forest production enhances theeconomy of the community, while the protection andregulation functions are concerned with ecologicalconservation.The forest is the principal source of fuelwood.According to the Ministry of Finance (MOF 2003, p.70, Table 10.1), energy consumption in Nepal isexcessively dependent on fuelwood, whichrepresents 75% of the total fuel consumption (8,416thousand tons of oil equivalent). In rural areas woodconsumption exceeds 94% of the total fuelconsumption, compared with 39% in urban areas(see Table 2.5). Terai forests provide most of thisfuelwood since they are easily accessible. Excessiveuse of fuelwood, particularly in rural areas, is due tolack of alternative energy sources. For instance, only2.3% of rural households use kerosene comparedwith 36% of urban households.The forest is also used as grazing land forlivestock. The livestock population including cattle,pigs, goats, and sheep reached 17.6 million head(11,226 livestock units) in 1998 from 14.9 millionhead (9,790 livestock units) in 1985, while the grazingarea (1,757,000 hectares [ha]) has remained more orless constant over the last 20 years (UNEP 2001). Theincreased numbers of livestock mainly depend onforest for grazing.Finally, the forest area has been used forinfrastructural development such as roads, schools,public places, institutional buildings, humansettlements, and so on. More than 120,000 ha offorest have been cleared for infrastructuredevelopment (DFRS 1999).Change and Distribution of Forest AreasAccording to the most recent survey, based onsatellite imagery (JAFTA 2001), the country now has37% forest coverage and 9% shrub area, making up atotal of 46% (Table 4.1). The percentage of total areacovered by forest and shrub is highest in the Hills(50% and 13%), followed for forest by the Terai andthe Mountains. The Hills have 57% of the total forestresources in the country.DeforestationD. JoshiTable 4.1: Distribution of Forest Resources by Region, 2000Forest Shrub Total Forest ResourcesAreaRegion(ha)Area % of Area % of Area % of(ha) region (ha) region (ha) countryMountain 5,<strong>18</strong>1,700 1,<strong>18</strong>1,631 22.8 426,363 8.2 1,607,994 23.7Hill 6,134,500 3,085,885 50.3 771,842 12.6 3,857,727 56.8Terai 3,401,900 1,237,545 36.4 85,026 2.5 1,322,571 19.5Nepal 14,7<strong>18</strong>,100 5,505,061 37.4 1,283,231 8.7 6,788,292 100ha = hectareSource: JAFTA (2001)Chapter 4: Forestry and Biodiversity39
The trend of forest coverage in the country isshown in Table 4.2. The table shows the finding ofthe different surveys regarding overall forestresources in Nepal. However, comparisons of thefindings from the different sources are difficult as thedefinitions and methodologies used are not directlycomparable (see discussion in Chapter 3) . Thiscreates serious problems for any comparativeanalysis of the changing nature of forest resources inNepal.Community ForestTable 4.2: Change in Forest and Shrub Cover (%)Forest Resources 1986 a 1994 b 2000 cForest 37.4 29.0 37.4Shrub 4.8 10.6 8.7Total 42.2 39.6 46.1Source: a LRMP (1986); b DFRS (1999); c JAFTA (2001)Table 4.3: Proportion of Forest Area by Region (ha)Forest Per Capita Forest Per CapitaArea per Forest Area per ForestRegion100 ha Area 100 ha Area(1994) a (1994) a (2000) b (2000) bMountain 2.3 0.08 22.8 0.70Hill 39.68 0.29 50.3 0.30Terai 35.17 0.14 36.4 0.11Total 29.00 0.23 37.4 0.24ha = hectareSource: a DFRS (1999) cited in UNEP (2001), p.63. b JAFTA (2001)Table 4.3 shows the change in forest coverageby area and person in the three regions between1994 and 2000; there are no consistent patterns inforest, regional forest endowments, or per capitaavailability. The table suggests that there may bemarked differences in the definition or recognition of“forest” in mountain disticts between the twosurveys.ICIMOD fileFactors of Forest Change and ImpactsForest surveys carried out from 1986 to 1994 provideinformation on forest area change and its causes,while the Japan Forest Technology Association(JAFTA 2001) forest survey only indicates the changein forest area. The following analysis looks at thecauses of change between 1986 and 1994 (Table 4.2),as there are no data for analysis of the subsequenttrends.Forest depletion refers to the diminishing offorests in quantity and quality. Quantity refers to thegross area covered by the forest whereas qualitysignifies the density of trees in the forest area.Between 1986 and 1994, the total forest areadecreased considerably. The loss can be attributed to(i) uncontrolled use of forest products, (ii) increasingpressure of livestock, (iii) transboundary smuggling oflogs, and (iv) inappropriately designed forest policies.Most rural people (83%) depend on forestfuelwood for cooking, because alternative energysources for cooking and heating are limited in ruralareas. Consumption of fuelwood alone constituted94% of the total energy output. The fuel consumptionfor household and industrial biomass was estimatedto be 15.4 million tons in 2000 compared with 11.3million tons in 1985. Per capita annual fuelwoodconsumption in the Hills is estimated to be 640kilogram (kg) compared with 479 kg in the Terai. Thetimber demand at national level was projected to beabout 2.5 million cubic meters (m 3 ) by 2000. Rapidpopulation growth, which has remained at over 2%per year since 1961, is considered to be the mostimportant factor behind diminishing forest resourcesin Nepal. In the Terai, migration is a major factor inforest encroachment. There are several reasons fordwindling Terai forests.Between 1986 and 1991, 99,400 ha of Teraiforests were cleared (CBS 1998), much of which wasconverted into cultivated area. During the early1990s, many of the forest areas of Jhapa and Morangdistricts in eastern Nepal were encroached upon bythe Bhutanese refugee camps.A Finnish International Development Agencystudy (FINNIDA 1993) showed a decline in thegrowing stock of sal (Shorea robusta) forest from 101to 72 m 3 /ha and from 76 to 58 m 3 /ha for other Teraihardwood forests. The Nepal Australia CommunityForestry Project indicated that the thinning of forestin the upper slopes of the Hills was due to overcutting of fuelwood and lopping trees for fodder(Tamrakar 1996).Degradation of Terai forest all along the Indo-Nepal border is mainly due to transboundarysmuggling of logs into India. This activity intensifiedwith the increase in price of logs in India(Rajbhandari 1997).40 Environment Assessment of Nepal : Emerging Issues and Challenges
Some of the government forest policies, such asthe Private Forests Nationalisation Act 1957 and theLand Tax Act of 1977, were unfavorable forconserving forest resources. These policies insteadallowed local people uncontrolled access to bothpublic and private forests in their areas (Perdo 1993;Shah 1997).Forest depletion has direct impacts on localenvironmental degradation. The average annualdeforestation rate of 1.7% is high considering Nepal’sfragile hill ecosystem. Wyatt-Smith (1982) andShepherd (1985) estimated that 3 ha of forest wouldbe required to sustain 1 ha of agricultural land oreach person would require about 1.65 ha of forest forthe country as a whole. The diminishing forest areahas further burdened rural women, who areresponsible for collecting firewood and fodder andfetching drinking water, besides other householdchores. They have little time for other productiveactivities (Zimsky 1999). Forest depletion contributesto environmental degradation such as landslides, soilerosion, floods, soil depletion, loss of biodiversity,reduction in water flow from upstream areas, andincreasing siltation of water bodies in low-lyingareas.Conservation of forest resources is fundamentalfor stabilizing the systems that help sustain all typesof ecological processes essential for human existenceand wellbeing. Alternative livelihood activitiesshould be made available to rural people to reducetheir dependence on forest resources. In addition,effective public awareness programs about forestconservation and its importance need to be initiatedthrough different communication media and schoolcurricula. Research needs to be carried out fordesigning effective public awareness programs.Development Efforts in ForestConservation and ManagementThe Government has introduced different programsfor conserving and managing forest resources. Oneeffort is the community forestry program initiated in1978, which has emphasized sustainablemanagement and development of forests throughcommunities’ involvement as forest user groups. By1999, the Government had handed over a total ofabout 0.7 million ha of state-owned forests to over10,532 community forestry user groups fordevelopment, conservation, management, andsustainable use. A total of six million people haddirectly benefited from being members of usergroups by 2000. Leasehold forest managementthrough user groups is another program. In 1993, 270ha of state-managed forest was handed over to usergroups for leasehold forestry, and this increased toover 6,550 ha in 2000.Some forest areas have been declaredprotected areas such as national parks, wildlifereserves, and conservation areas. The coverage ofprotected areas increased from 0.976 million ha in1984 to 2.476 million ha in 1998. The AlternativeEnergy Promotion Center was created to developprograms for providing alternative energy resourcesand technology to reduce dependency on traditionalenergy sources such as fuelwood. This center, incollaboration with INGOs and the private sector, hasinitiated biogas plants to replace fuelwood forcooking and lighting, thereby helping to conserveforests. The number of biogas plants has increasedfrom about 200 in 1975 to 90,000 in 2002 in 66 districtsof the country (ENPHO/MOPE 2002). Likewise, theimproved cooking stove program has been designedto increase the efficiency of firewood use and toreduce smoke. Over 90,000 improved stoves ofvarious types are being distributed throughout thecountry (ENPHO/MOPE 2002).Forest conservation and development in Nepalhas been promoted through different Governmentacts and legislation since 1957. Some of these arelisted below. Nepal has also signed variousinternational conventions and treaties related to theconservation of forests and biodiversity.(i)(ii)Acts(a) Private Forests Nationalisation Act 1957(b) Forestry Act 1963(c) Forest Protection (Special Arrangements) Act1967(d) Soil and Watershed Conservation Act 1982(e) National Parks and Wildlife Conservation Act1973 and Amendment (NPWC) 1993(f) Forest Act 1993 and Amendment 1999(g) Forest Regulations 1995(h) Environment Protection Act 1996Policies and Strategies(a) National Forestry Plan 1976(b) National Conservation Strategy 1988(c) Forestry Sector Policy 1989(d) Nepal Environmental Policy and Action Plan1993(e) Master Plan for the Forestry Sector 1989–2010(f) Policy <strong>Document</strong>: Environmental Assessmentin the Road Sector of Nepal 2000(g) Nepal Biodiversity Strategy 2002(iii) Regulations and Guidelines(a) Environmental Impact Assessment Guidelinesfor the Forestry Sector 1995(b) Buffer Zone Regulations 1996(c) Environment Protection Regulations 1997Chapter 4: Forestry and Biodiversity41
BiodiversityState of BiodiversityNepal’s great variation in topography—altitudesranging from 60 to 8,848 meters above sea level(masl) over a small distance of 190 km from south tonorth—has resulted in a great diversity of climate andvegetation ranging from subtropical to cold desert.Nepal has been endowed with a rich variety of plantsand animals. The different biological species play arole not only in establishing symbiotic relationshipsamong themselves but also have great economicvalue. People’s relationship with their surroundingshas changed over time, affecting the biodiversity ofthe landscape.With an area of only 0.1% of the global surfacearea (147,<strong>18</strong>1 km 2 ), Nepal hosts some of the mostspectacular natural areas in the world. Nepalpossesses over 2% of the world’s flowering plants,about 9% of the world’s bird species, and about 4% ofthe world’s mammalian species (see Appendix 4.2).In terms of species richness, Nepal is in 11th positionin Asia and 25th position at the global level.“Ecosystem” refers to a unit that includes allorganisms (populations, communities, habitats, andenvironments) in a given area interacting with allcomponents of the physical environment. Nepal has1<strong>18</strong> types of forest ecosystems spread over fourphysiographic regions (Table 4.4), <strong>18</strong>1 species ofmammals, 844 species of birds, <strong>18</strong>5 species of fish,143 species of reptiles and amphibians, over 5,884species of flowering plants, and about 2,287 speciesof fungus and lichens (CBS 2003) (see Appendices4.1 and 4.2).Table 4.4: Ecosystems in Protected AreasZoneNumber ofEcosystemsEcosystems inPAsTerai 10 10Siwalik 13 5Middle Hill 52 33Highland 38 30Others 5 2Total 1<strong>18</strong> 80PA = protected areaSource: CBS (2003)Over 400 species of agro-horticultural cropshave been reported in Nepal including 200 species ofvegetables (NAA 1995). Of these, around 50 specieshave been domesticated for commercial andhousehold consumption. Fifteen fruits with morethan 100 varieties, 50 vegetables with 200 varieties,and 10 varieties of potatoes are cultivatedcommercially. Some wild genotypes have also beenidentified and domesticated by local people becauseof their economic value.Sixteen protected areas (together with six BufferZones) have been established for the protection offlora and fauna (Figure 4.1). These protected areasare in the form of national parks (9), conservationareas (3), wildlife reserves (3), and a hunting reserve(1) and are intended to provide protection to diversespecies of plants and animals in climates rangingfrom sub-tropical to cold desert. The protected areasmake up about 17% of the country’s total area. Ofthese, the Sagarmatha National Park and the RoyalChitwan National Park have been included in theWorld Natural Heritage List; and the Koshi TappuWildlife Reserve, Bishajari Tal (Chitwan), JagdishpurJalasha Reservoir (Kapilbastu), and Ghodaghodi Tal(Kailali) have been designated as Ramsar sites.Factors Diminishing BiodiversityWildlife and biodiversity are an important naturalresource in Nepal, as well as an indicator ofenvironmental quality. Loss of wildlife andbiodiversity means degeneration of environmentssuch as forest and water bodies. Any human or otherintervention can cause environmental imbalance,with unfavorable implications for these naturalecosystems. The preservation of these uniqueecosystems and the sustainable use of productsobtained from them remains an environmentalchallenge for the country.Forests are the most important naturalecosystem in Nepal. Much of the former forest areahas been converted to cultivated land, built up area,roads and other infrastructure-related uses.Deforestation has a significant impact on flora andfauna. Nepal’s threatened animal species constitute3.8% of the world’s threatened mammals and 2.3% ofbirds (CBS 2003). Clearing and burning forests,draining and filling wetlands, converting naturalecosystems into agricultural land, and meeting thedemand for fuelwood, fodder, litter, medicinal plants,and animals for meat and other requirements hasresulted in a huge loss of biodiversity.Habitats have suffered due to loss, alteration,over-extraction or illegal collection of species,poaching or hunting of wild animals, over-grazing,fire, and commercial trade. The economic value ofendangered or rare species in the world market isvery high. Illegal trade of wildlife products such asrhino horn, tiger skin and bone, ivory, fur, and antlersis a serious problem in and around protected areas.In two decades, the country lost 76 rhinos due topoaching (DNPWC 2001). Likewise, the populationsof musk deer, red panda, bears, and many otherspecies have declined in the mountains (Shresthaand Joshi 1996). Due to increased pressure on their42 Environment Assessment of Nepal : Emerging Issues and Challenges
Figure 4.1: Protected Areas in NepalRussell’s Viper (Vipera russelli)usage, many species of plants, butterflies, fish,insects, birds, and mammals have been listed asthreatened, vulnerable, or rare (Shrestha and Joshi1996; Suwal et al. 1995). Out of 32 rare plant specieslisted, 8 are already extinct (CBS 2003).Efforts Towards Biodiversity ConservationThe Government has established the Department ofNational Parks and Wildlife Conservation andcreated a network of protected areas. After creationof the protected area network, there has been anincreasing trend in the population of wild animals.The rhino population increased from 60 in the lateIUCNRhododendron Dalhusiae1960s to 612 in 2000, the last year for which reliablestatistics are available (DNPWC 2000). Similarly, acontinued conservation effort in protected areas hasimproved the habitat and increased the number ofwildlife such as endangered tiger, musk deer, andmany other species (DNPWC 2000). Translocationand reintroduction of some species has reduced therisks of loss of these animals from being in only onearea. However, species outside protected areas arestill under great pressure. Wildlife species such asgreater one-horned rhinoceros (Rhinocerosunicornis) have been translocated from one park toanother to set up other viable populations.IUCN ICIMODChapter 4: Forestry and Biodiversity43
The Government has given legal protectionstatus to 13 plants, 26 mammals, 9 birds, and 3 reptilespecies. Almost all these faunal species and about 20plant species are included in the CITES (Conventionon International Trade in Endangered Species ofWild Fauna and Flora) appendices.Different alternative energy sources to replaceor reduce fuelwood use such as back-boilers,kerosene depots, small hydropower plants, solarwater heaters, and space heaters have beenintroduced in Mountain areas (such as AnnapurnaConservation Area Project [ACAP] and Sagarmathaareas); and biogas, electricity, kerosene, improvedcooking stoves, and solar power in the Terai. StudiesLong-Billed Vulture (Gyps indicus)Freshwater Gangetic Dolphin (Platanista gangetica)Wetland areaIUCNIUCN IUCNshow that these have reduced fuelwood consumptionand thereby increased conservation of forests(DNPWC 1999; Lama and Lipp 1994; Wells andBrandon 1992).The Government has formulated acts andregulations to safeguard the biodiversity of thecountry. Some of these have been listed above. TheNational Planning Commission in collaboration withThe World Conservation Union (IUCN) is toimplement a national conservation strategy, whichhas biodiversity conservation as a key component. In1993, these two organizations developed the NepalEnvironmental Policy and Action Plan. This planidentified four priority actions for biodiversityconservation. In addition, Nepal has signed differentinternational conventions such as the RamsarWetland Convention, World Heritage Convention,and CITES to show its commitment to theconservation of biodiversity.A buffer zone approach has been implementedaround the borders of the Royal Chitwan NationalPark, Royal Bardia National Park, Langtang NationalPark, Sheyphoksundo National Park, Makalu BarunNational Park, and Sagarmatha National Park to solvepark-people conflicts and protect park animals, aswell as to ease the biotic pressure on core areas andto promote sustainable management of naturalresources. This conciliatory approach is aimed atmotivating local communities to undertakeparticipatory management of forest resourcesthrough user groups. This program refunds 50% ofthe total revenue of protected areas, which thecommunities can use for their socioeconomicbetterment. This provision has demonstrated thedirect benefit of protected areas as a long-termmeasure for conservation of biodiversity resourcesthrough government-community partnership.Wetlands like rivers, lakes, reservoirs, villageponds, paddy fields, and marshlands are rich inbiodiversity and different indigenous communitiesoften have cultural attachments to them (Table 4.5).Wetlands cover some 5% (743,500 ha) of the landarea of the country (MOFSC 2003). There are a totalof 242 designated wetlands: 163 in the Terai and theremainder in the Hill and Mountain regions.Nepal’s wetlands are home to 193 of 841recorded bird species. Terai wetlands alone have <strong>18</strong>7bird species, of which <strong>18</strong>0 are found in the KoshiTappu Wildlife Reserve. In addition to birds,wetlands are home to a number of fish species,reptiles, and amphibians. Other wild animals such asrhinoceros (Rhinoceros unicornis), wild buffalo(Bubalus bubalis), swamp deer (Cervus duvaucelli),Gangetic dolphin (Platanista gangetica), and otter(Lutra lutra) also depend on wetlands. Wetlands areprobably the last refuges of some wild relatives of44 Environment Assessment of Nepal : Emerging Issues and Challenges
Table 4.5: Wetland Types in NepalWetland TypeEstimated Area(ha)Percent ofTotalRivers 395,000 53.12Lakes 5,000 0.67Reservoirs 1,380 0.19Village ponds 5,<strong>18</strong>3 0.70Paddy fields 325,000 43.71Marshland 12,000 1.61Total 743,563 100.00ha = hectareSource: M OFSC (2003)cultivated plants, and also have significant value forfishing, irrigation, and religious and recreational(boating, rafting) use. Many indigenous communitiesdepend on wetland resources for their survival.Accordingly, Nepal has sought to conserve thewetland ecosystem and ensure the participation oflocal communities for sustainable use of itscomponents (MOFSC 2003). This policy recognizeswetlands management as an essential component ofan ecosystem approach to natural resourcemanagement and has identified participatorywetlands management, classified wetlands from amanagement perspective, and developed othercomponents of sustainable development.Ecotourism development is an integral part ofthe protected area system in Nepal. The primeobjective of ecotourism has been to promote asymbiotic relationship between tourism and theenvironment, with a particular focus on uplifting thelocal host economy. This concept is also applied invillage communities sited in and around protectedareas.Through ecotourism, tourists get opportunitiesto observe and learn. Its potential contribution tocultural conservation and long-term sustainability ofcommunities and natural resources is huge.Ecotourism is considered a form of sustainabletourism that benefits the community, environment,and local economy. This may be achieved throughvarious means such as employment for local peopleor programs in which tourists contribute money tocommunity activities. In Nepal, the ACAP providesone of the best examples of ecotourism. Under thisproject, several village sites have been identified forcommunity-based ecotourism development.The ACAP, covering an area of 7,629 km 2 in thewestern <strong>Himalayan</strong> region, covers one of the threeconservation areas of Nepal. ACAP was created in1986 under the King Mahendra Trust for NatureConservation and gazetted as a Conservation Area in1992. The main aim of ACAP is to balance naturalresource conservation and sustainable communitydevelopment. The area is characterized by bothbiodiversity and cultural diversity. ACAP has beensuccessful in gradually changing traditionalsubsistence activities into a framework of soundresource management, supplemented byconservation, development of alternative energyprograms (such as micro hydroelectricity, biogasplants, solar power, kerosene depots, and fuelwoodsaving technology) to minimize the negative impactsof tourism and to enhance the living standards oflocal people. It follows the principles of maximumpeople’s participation, sustainability, and a catalyticrole. The focus in Jomsom, Manang, and Ghandruk,which are popular trekking areas, is on integratedtourism management and agro-pastoralism, wherelocal communities are involved in tourism-basedincome generating activities.The Annapurna Conservation Area has been aprime destination for trekkers ever since it wasopened to visitors. Of Nepal’s total 100,828 trekkers in2001, 65% visited the Annapurna area. ACAP isauthorized to collect entry fees from visitors, and therevenue from trekking has been used to create anendowment fund with the objective of achievingfinancial self-sustainability. The fund is used fornatural resource conservation and communitydevelopment, which has brought positive results tothe livelihoods of the people of the Annapurna area.An understanding of conservation and thesustainable use of natural resources has proved to bea crucial catalyst for sustaining development. ACAPhas since become a model for conservation anddevelopment not only for other parts of the countrybut also for the rest of the world. Many national parksand protected areas in Nepal have either adopted orrefined the ACAP model (ACAP 2002).SummaryThe forest is the most important natural resource,and the most important natural ecosystem, in Nepal.Forests are the principal source of fuelwood andfodder, and are also used for grazing and building ofroads, public buildings, and other infrastructure. Anychange—decrease or increase—in the forests canaffect wildlife, biodiversity and water sources, all ofwhich depend upon forests. Analysis of forestresources in Nepal has been based on differentsources and methods. These sources and methodshave shown a change in forest coverage—adecrease from 1986 to 1994 followed by an increaseup to 2000, but the surveys used differentmethodologies and techniques and it is difficult todraw any firm conclusions. Anecdotal evidence andlocal observations show that depletion of forest areais most common in areas with relatively betterChapter 4: Forestry and Biodiversity45
Different ways of maintaining biodiversity: in protected areas (Shey Phoksundo National Park, top) and throughindigenous agroforestry practices (shifting agriculture field, bottom)Elizabeth Kerkhoff IUCN46 Environment Assessment of Nepal : Emerging Issues and Challenges
access for people, as the majority of rural people stilluse forests as sources of fuelwood and fodder. A verycritical issue that has emerged is that of the lack ofcomparability of forest data. Unless comparable datais made available that covers all aspects of forestresources, it will be very difficult to designappropriate interventions for the different regions.BibliographyAnnapurna Conservation Area Project (ACAP). 2002.“Information on the ACAP Activities.” AnnapurnaConservation Area Project, Pokhara.Biodiversity Profiles Project (BPP).1995. Biodiversity Profileof the High Mountains and High Himal PhysiographicZones. Biodiversity Profiles Project Publication No.14. Kathmandu: His Majesty’s Government of Nepal,Department of National Parks and WildlifeConservation.Central Bureau of Statistics (CBS). 1998. A Compendium onEnvironment Statistics 1998. Kathmandu.———.2002. A Hand<strong>book</strong> of Environment Statistics, Nepal2002. Kathmandu.———.2003. Population Monograph of Nepal, Vol. II.Kathmandu.———.2004. Hand<strong>book</strong> of Environment Statistics 2003.Kathmandu.Department of Forest Resources and Survey (DFRS). 1999.“Forest Resources of Nepal (1987–1998).”Publication No. 74, Department of Forest Resourcesand Survey, Kathmandu.Department of National Parks and Wildlife Conservation(DNPWC). 1999. Annual Report(1998–1999). Kathmandu.———.2000. Rhino Count 2000. Kathmandu.———.2001. Annual Report (2000–2001). Kathmandu.Department of Health Services (DOHS). 1999. AnnualReport (1997–1998). Kathmandu.Department of Plant Resources (DPR). 1999. Flora ofNepal: Management <strong>Document</strong>. Kathmandu.Disaster Prevention Training Center (DPTC). 1997. AnnualDisaster Review 1996. Kathmandu: Water InducedDisaster Prevention <strong>Centre</strong>.Environment and Public Health Organization(ENPHO)/Welink/Ministry of Population andEnvironment (MOPE). 2002. State of Rural Energy inthe Mountains, Nepal. Kathmandu.Environment Protection Council (EPC). 1993. NepalEnvironment Policy and Action Plan. Kathmandu.Finnish International Development Agency (FINNIDA).1993. Changes in the Terai Forests of Nepal(1964–1990). Kathmandu: His Majesty’s Governmentof Nepal, Department of Forest Resources andSurvey.Gurung, H. 1989. “Regional Patterns of Migration in Nepal.”Papers of the East-West Population Institute, No.113,East-West Institute, Hawaii.His Majesty’s Government of Nepal. 1997. “The Communityand Private Forestry Program in Nepal.” InternalReport, Department of Forest, Community andPrivate Forestry Division, Kathmandu.———.2000. “Institutionalizing Biodiversity Registration:Report on the National Workshop on BiodiversityRegistration in Nepal.” His Majesty’s Government ofNepal, National Planning Commission/Ministry ofForest and Soil Conservation.———.2001. Nepal Gazette. Section 51 and No. 36, andSection 53 and No. 31. Kathmandu: His Majesty’sGovernment of Nepal Press, (31 December 2001(2058/9/16), and 17 November 2003 (2060/8/1).Japan Forest Technology Association (JAFTA). 2001.“Information System Development Project for theManagement of Tropical Forest.” Activity Report ofWide Area Tropical Forest Resources Survey(Kingdom of Nepal), Japan Forest TechnologyAssociation, Kathmandu.King Mahendra Trust for Nature Conservation (KMTNC).1994. A Decade of Conservation and Development(1984–1994). Kathmandu.Lama, T.T., and J.R. Lipp. 1994. Annual Progress Report.Kathmandu: King Mahendra Trust for NatureConservation.Land Resource Mapping Project (LRMP). 1986. “LandUtilisation Report.” His Majesty’s Government ofNepal, Survey Department/Land Resource MappingProject, Kathmandu.Manushi. 1996. Socio-economic and Environmental Impactof the Presence of Bhutanese Refugees on the LocalCommunity in Eastern Nepal. Kathmandu: UnitedNations High Commission for Refugees.Ministry of Agriculture (MOA). 1999. Statistical Informationon Nepalese Agriculture 1998/1999. Kathmandu.Ministry of Finance (MOF). 1999. Economic Survey(FY1998/1999). Kathmandu.———.2003. Economic Survey (FY2002/2003). Kathmandu.Ministry of Forest and Soil Conservation (MOFSC). 1988.Master Plan for the Forestry Sector. Kathmandu.———. 1996. “Forestry Sector Policy.” Draft report, HisMajesty’s Government of Nepal, Ministry of Forestand Soil Conservation, Kathmandu.———.2002. Nepal Biodiversity Strategy. Kathmandu.———.2003. National Wetlands Policy. Kathmandu.Ministry of Home Affairs (MOHA). 1999. “Loss of Lives dueto Flood and Landslides.” Unpublished, in records ofthe Ministry of Home Affairs, Kathmandu.Ministry of Population and Environment (MOPE). 1997.Combating Desertification. Kathmandu.———.1997. Environment Protection Act 1996 andEnvironment Protection Regulations 1997.Kathmandu.Chapter 4: Forestry and Biodiversity47
———.2004. State of the Environment Nepal (Ecotourism).Kathmandu.Nepal Agriculture Association (NAA). 1995. Plant GeneticResources Profiles Study. Kathmandu: NepalAgriculture Association and Japan InternationalCooperation Agency.National Planning Commission (NPC). 1974. “Draft Reporton Land Use and Erosion Control.” Report of theTask Force. His Majesty’s Government of Nepal,National Planning Commission, Kathmandu.———.1997. The Survey of the Government’s Ninth Plan(1997–2002). Kathmandu.Perdo, R.D. 1993. “Back to the Future: Nepal’s New ForestryLegislation.” Journal of Forestry (June).Pradhan, H.B. 2000. A Study on the Change in ForestResources of the Koshi Hills in the Eastern HillDistricts. Kathmandu: Nepal-United KingdomCommunity Forestry Project.Pradhan, P. 1998. Development of a GIS Database Systemfor Refugee Programs in Eastern Nepal: Status ofEnvironmental Conditions and Impacts Assessment.Bangkok: United Nations Environment Programme,Regional Resource Center for Asia Pacific.Rajbhandari, M.D. 1997. “A Draft Programme <strong>Document</strong> onForest Resource Information System.” Reportsubmitted to Finnish International DevelopmentAgency, Kathmandu.Shah, S.B. 1997. “Analysis of Forestry Sector Policy andLegislation.” Draft Report submitted to His Majesty’sGovernment of Nepal, Department of Forest,Kathmandu.Shepherd, K.R. 1985. “Management of the Forest andAgricultural Systems Together for Stabilization andProductivity in the Middle Hills of Nepal.” Paperpresented at the International Workshop onWatershed Management in the Hindu Kush-Himalaya Region, Chengdu, China. Kathmandu:International <strong>Centre</strong> for Integrated MountainDevelopment.Shrestha, M.K. 1998. Royal Chitwan National Park: Twenty-Five Years of Conservation. Kathmandu: HisMajesty’s Government of Nepal, Department ofNational Parks and Wildlife Conservation/ Visit NepalYear 1998 Secretariat/ World Wide Fund for Nature(WWF)—Nepal Programme.Shrestha, T.B. 1999. Nepal Country Report on BiologicalDiversity. Kathmandu: The World ConservationUnion (IUCN).Shrestha, T.B., and R.M. Joshi. 1996. Rare, Endemic andEndangered Plants of Nepal. Kathmandu: WorldWide Fund for Nature (WWF)—Nepal Programme.Tamrakar, R.M. 1996. “A Comparative Study of Land UseChanges in the Upper Catchment Area ofSindhupalchok District Between 1978–1992.”Unpublished Consultancy Report submitted to theNepal Australia Community Forestry Project,Kathmandu.United Nations Environment Programme (UNEP). 2001.Nepal: State of Environment 2001. Bangkok: UnitedNations Environment Programme, RegionalResource Center for Asia Pacific.Uprety, B.K. 1997. Natural Biodiversity: InstitutionalStrengthening and Collection of EnvironmentalStatistics in Selected DMCs. Kathmandu: HisMajesty’s Government of Nepal, Central Bureau ofStatistics.Water and Energy Commission Secretariat (WECS). 1995.“The Energy Resource Base of Nepal.” WECS Report,No. 2/1/010595/5/11, No. 480. Kathmandu.———.1996. Energy Synopsis Report: Nepal 1994/1995.Kathmandu.———.1998. WECS Bulletin. 9(1). Kathmandu.———.1999. WECS Bulletin, 10 (1 and 2). Kathmandu.Wells, M., and K. Brandon. 1992. People and Park: LinkingProtected Area Management with LocalCommunities. Washington, DC: World Bank/WorldWildlife Fund/United States Agency for InternationalDevelopment.Wilson, E.O. 1988. “The Current State of BiologicalDiversity.” In Biodiversity edited by E.O. Wilson andF.M. Peter, pp. 3–<strong>18</strong>.Wilson, E.O. 1992. The Diversity of Life. New York andLondon: W.W. Norton & Company.Wyatt-Smith, J. 1982. “The Agricultural System in the Hillsof Nepal: the Ratio of Agriculture to Forestland andthe Problem of Animal Fodder.” APROSC OccasionalPaper 1, Agricultural Projects Service Center,Kathmandu.Yonzon, P.B., and M.L. Hunter. 1991. “Cheese, Tourist andRed Pandas in Nepal Himalayas.” ConservationBiology 5(2): 196–206.Zimsky, M. 1999. “National Biodiversity Action Plan.” Draftreport, His Majesty’s Government of Nepal, Ministryof Forest and Soil Conservation, Kathmandu.48 Environment Assessment of Nepal : Emerging Issues and Challenges
Appendix 4.1: Forests and Other Ecosystems by RegionRegionMajor EcosystemsNumber Sub-region Ecosystem TypeTerai 10 + 3 = 13 Upper Tropical EasternRegionTropical riverine forestSal (Shorea robusta ) forestLower Tropical WesternRegionTerai tropical sal forest ( Shorea robusta, Terminalia tomento sa, ...)Khair-sossoo (Acacia - Dalbergia) riverine forestSamalia malabarica, Trewia nudiflora - riverine forestBhabar light s al forestPseudo steppe with Gramineae (tropical elephant grasses)Lower Tropical EasternRegionOtherSiwaliks 13 + 1 = 14 Upper Sub-tropicalWestern RegionUpper and Lower Sub -tropical Wes tern RegionUpper Tropical WesternRegionMiddle Hills 52 + 2 = 54Upper Tropical EasternRegionTerai tropical s al forestTropical mixed wet forestTropical dense forest with Terminalia sps .Cultivated areasTerai cultivated areasWater bodiesUpper Siwalik chir pine-oak forestSiwaliks chir-pine forestAlnus nitida riverine forestTropical hill sal forest in large valleysTroical riverine forest ( Albizzia lebbek , Toona ciliata ..)Sal forest in inner valleys ( Shore robusta , Terminalia tomentosa ),Mesophytic tropical forest on southern slopes of the SiwaliksHygrophytic tropical forest on northern slopes of the SiwaliksSiwalik tropical deciduous forestTropical hill sal forestDense forest with Shorea robusta, Lagerstroemia parviflora ….Dense forest with Terminalia tomentosa , T. belerica ...Dun valleys s al forestLower Tropical LevelWestern RegionOtherDun cultivated areasMontane Western Region Mesophytic montane oa k-rhododendron forestMixed blue pine -oak forestMixed hygrophytic oak -hemlock-fir forestOpen and dry montane blue pine forestBlue pine-spruce forestJuniper forest ( Juniperus indica )Rhododendron -hemlock-oak forestHemlock forest ( Tsuga dumosa )Mountain oak forest ( Quercus semecarpifolia )Blue pine-spruce-fir forestSpruce mountain forest ( Picea smithiana )Montane Eastern Region Lithocarpus pachyphylla forestRhododendron forestDeciduous mixed broad -leaved forestMixed broad-leaved forest ( rhododendron-acer-symplocus-lauraceae)Daphniphyllum himalayense forest with a few Rhododendron grandeCollinean Western Region Blue pine-cypress forestCypress forest with dwarf barberryCollinean oak forest ( Quercus leucotrichophora , Q. lanata)Mixed blue pine -oak forestMixed oaks-laurels forest with shrubsMixed hygrophytic broadleaved forest with oaksCedar forest ( Cedrus deodara )Open blue pine forest ( Pinus wallichiana )Collinean oak -mixed broadleaved forest ( Quercus lanata )Aesculus, Juglans riverine fores tDeciduous broadleaved forest (Alnus, Juglans, Acer)Continued on next pageChapter 4: Forestry and Biodiversity49
Appendix 4.1: Table continuedMajor EcosystemsRegionNumber Sub-region Ecosystem TypeMiddle HillsCollinean Central Region Hygrophytic Quercus lamellosa forest(cont.)Collinean Eastern Region Hygrophile forest with Quercus lamelloseHygrophile forest with Castanopsis tribuloidesMesohygrophile forest with Quercus glaucaMesohygrophile forest with Quercus lanata and Pinus excelsaSub-Tropical Eastern Eugenia tetragona , Ostodes paniculata forestRegionUpper Sub-tropical Mixed chir pine - oak forest ( Pinus roxburghii , QuercusWestern Region leucotrichophora )Quercus glauca , Alnus nepalensis , Betula alnoides riverine forestOpen Olea cuspidata forestSub-tropical mixed broadleaved forestQuercus incana and Schima wallichii forestUpper Sub-tropical Hygrophytic Schima wallichii , Castanopsis tribuloides forestCentral RegionMountains 38 + 1 = 19Upper Sub-tropicalEastern RegionUpper and Lower Sub -tropical Western RegionUpper and Lower Sub -tropical Central RegionUpper and Lower Sub -tropical Eastern RegionOtherNival levelUpper Alpine L evelLower Alpine LevelUpper Sub-Alpine LevelWestern RegionUpper Sub-Alpine LevelCentral RegionCastanopis tribuloides forest with Schima wallichii ..Castanopsis hystrix forest with C. tribuloides ..Alnus nepalensis forestChir-pine forest with grasses and EngelhardriaMixed chir pine broadleaved forestAlnus nepalensis riverine forestEuphorbia royleana steppe in inner valleysGrasses - Artemesia steppeHygrophytic Schima wallichii forestSchima wallichii , Castanopsis indica hygrophile forestSchima wallichii , Pinus roxburghii mesohygrophile forestPinus roxburghii xerophile forest with Phyllanthus emblicaSchima wallichii , Lagerstroemia parviflora hygrophile forestPokhara cultivated areasWater bodiesGlaciers, snow, rockAlpine meadow with Gramineae and CyperaceaXerophytic mat patches , scarcely vegetated rocks , and screeMesophytic mat patches , scarcely vegetated rocks , and screeMesophytic and hydrophytic mat patches and scarcely vegetatedrocksAlpine meadows on the southern side of the Himalaya sDry alpine vegetati on on the northern side of the HimalayasHigh altitude discontinuous vegetation cushion plantsMeadows and mat patchesScarcely vegetated rocks and scree of upper alpine levelMeadows and land communitiesRhododendron mesohygrophyti c scrublands -Juniperus ... meadowsRhododendron mesohygrophytic scrublands ( R. anthopogon , R.nivale ...)Juniper mesohygrophytic scrublands ( J. indica, R. recurva, J.squamata)Xerophytic closed alpine mat and scrubMesophytic closed alpine mat and scrubShrub lands with patches of abundant Rhododendron anthopogon,R. nivaleMesophytic closed sub -alpine mat and scrub ( R. anthopogon )Rhododendron -birch forest ( Betula utilis, R. campanulatum )Birch-blue pine open fore stNorth <strong>Himalayan</strong> alpine vegetationContinued on next page50 Environment Assessment of Nepal : Emerging Issues and Challenges
Appendix 4.1: Table continuedRegionMajor EcosystemsNumber Sub-region Ecosystem TypeMountains(cont.)Upper Sub-Alpine LevelEastern RegionBetula utilis forest with rhododendron and Abies spectabilisRhododendron shrub landsRhododendron -juniper shrub landsTotal 1<strong>18</strong>Source: BPP (1995)Lower Sub-Alpine LevelWestern RegionLower Sub-Alpine EasternRegionSteppic Formations - NorthWest RegionOtherMesophytic fir forest with oak and rhododendronHygrophytic fir -hemlock-oak forestFir forest ( Abies spectabilis )Abies spectabilis forest with rhododendronLarix griffi thiana forestLarix griffithiana and L. potanini forestLarix potanini forestHigh altitude cushion plant formationCaragana vericolor and Lonicera spinosa steppeCaragana gerardiana and Lonicera spinosa xerophytic steppeCaragana brevispina and Artemisia steppeCaragana pygmaea and Lonicera spinosa xerophytic steppeMyricaria-Hippophae-Salix riverine thicketsSophora moorcroftiana and Oxytropis mollis steppeWater bodiesChapter 4: Forestry and Biodiversity51
Appendix 4.2: Protected Plant and Wildlife SpeciesTable A4.2.1: Protected Plant Species and Forest Products (Pursuant to Section 70 (kha) of the Forest Act 1993)Scientific Name Local Name FamilyStatusIUCN CITESPlants banned for collection, use, sale, distribution, transportation and exportDactylorhiza hatagirea Panch ounle Orchidaceae IIJuglans regia (only bark) Okhar JuglandaceaePicrorhiza scrophulariiflora a Kutki ScrophulariaceaePlants banned for export except processed in the country and permission issued from DOF along with thDPR or HPPCLAbies spectabilis Talis patra Pinaceaee recommendation ofCinnamomum glaucescens Sugandakokila LauraceaeLichens spp.JhyauNardostachys grandiflora Jatamansi ValerianaceaeRauvolfia serpentina Sarpaganda harbaruwa Apocynaceae VETaxus baccata subsp. Wallichiana Loth salla ValerianaceaeIIValerianna jatamansi Sugandabala Valerianaceae IIForest products banned for export except processed in the country through boiling and extraction method and permissionissued from DO F along with the recommendation of DPR or HPPCLAsphaltum (rock exudate)SilajitBan on export except processed in the country through steaming and packaging, and permission issued from DOF along withthe recommendation of DPR or HPPCLCordyceps si nensis Yarcha gumba ClavicipitaceaeTimber trees banned for felling, transportation, and export for commercial purposesAcacia catechu Khayer LeguminosaeBombax ceiba Simal Bombacaceae TDalbergia latifolia Satis sal FabaceaeJuglans regia (only from national OkharJuglandaceaeforests)Michelia champaka M. kisopa Chanp MagnoliaceaePterocarpus marsupium Bijaya sal Fabaceae EShorea robusta Sal DipterocarpaceaeCITES = Convention on International Trade of Endangered Species of Wild F auna and Fl ora; DOF = Department of Forest ; DPR = Department of Plant Resources;HPPCL = Herbs Production and Processing Company Limited ; IUCN = The World Conservation Union, Ex = extinct, E = endang ered, T = threatened , V = vulnerable;Notes: CITES Appen dix I = Species threatened with extinction; Appendix II = Species not yet threatened but which could become endangered if trade is notcontrolled; Appendix III = Species that are protected by individual countries within their borders and for which cooperat ion of other convention signatories is sought.a Species to be specified and recommended for export by DPR, and availability to be considered by DoF before issuing license for export.Source: His Majesty’s Government of Nepal ( 2001)52 Environment Assessment of Nepal : Emerging Issues and Challenges
Table A4.2.2: Status of Protected Wildlife under the National Parks and Wildlife Conservation Act 1973Scientific Name Local Name Common Name StatusMammals IUCN CITESAilurus fulgens Habrey Red panda V IAntilope cervicapra Krishna sagar Black buck V IIIBos gaurus Gauri gai Gaur bison V IBos mutus Yak/Nak Wild yak E IBubalus arnee Arna Wild water buffalo E IIICanis lupus Bwanso Grey wolf V ICaprolagus hispidus Hispid kharayo Hispid hare E ICervus duvauceli Barasinghe Swamp deer E IElephas maximus Hatti Asiatic elephant E IFelis lynx Pahan biralo o Lynx E IIHyaena hyaena Hundar Striped hyaena EMacaca assamensis Assamese rato bander Asamese red monkeyManis crassicaudata Salak Indian pangolin IIManis pentadactyla Salak Chinese pangolin IIMoschus chrysogaster Kasturi <strong>Himalayan</strong> forest musk deer E IOvis ammon Nayan Great Tibetan sheep IPanthera tigris Bagh Bengal tiger E IPanthera uncia Hiun chituwa Snow leopard E IPantholops hodgsoni Chiru Tibetan antelope IPardofelis nebulosa Dhwanse chituwa Clouded leopard V IPlatanista gangetica Souns Gangetic dolphin V IPrionailurus bengalensis Chari bagh Leopard cat IPrionodon pardicolor Silu Spotted lingsang IRhinoceros unicornis Gainda Asian one-horned rhinoceros E ISus salvanius Sano (Pudke) bandel Pigmy hog Ex (?) ITetracerus quadricornis Chauka Four-horned antelope V IIIUrsus arctos Himali rato bhalu Brown bear IBirdsBuceros bicornis Raj dhanesh Great-horned hornbill ICatreus wallichii Cheer Cheer pheasant E ICiconia ciconia Seto saras White storkCiconia nigra Kalo saras Black stork IIEupodotis bengalensis Khar mujur Bengal florican E IGrus grus (G. antigone) Saras Common crane IILophophorus impejanus Danfe Impeyan pheasant ISypheotides indica Sano khar mujur Lessor florican E IITragopan satyra Monal Crimson-horned pheasant IIIReptilesGavialis gangeticus Ghadial gohi Gharial E IPython molurus Azingar Asiatic rock python V IVaranus flavescens Sun gohoro Golden monito r lizard I ICITES = Convention on International Trade in Endangered Species of Wild Fauna and Flora; IUCN = The World Conservation Union, V = vuln erable, E = endangered,Ex = extinctNotes: CITES Appendix I = Species threatened with extinction; Appendix II = Species not yet threatened but which could become endangered if trade is notcontrolled; Appendix III = Species that are protected by individual countries within their borders and for which cooperation of other convention signatories is sought.Source: MOFSC (2002)Chapter 4: Forestry and Biodiversity53
Table A4.2.3: Nepal's Share in Plant Species in the WorldGroupsNepal World Species c Nepal’sShare (%)Species a Endemic species bNonflowering plantsAlgae 687 3 26,000 1.7Fungi 1,822 16 69,000 2.6Lichen 465 39 20,000 2.7Bryophytes 853 30 16,600 6.1Pteridophytes 380 8 11,300 3.2Non-flowering t otal 4,207 2.7Flowering plants total 5,884 246 220,529 2.4Source: a CBS (2003); b MOFSC (2002); c Wilson (1988; 1992)World Species c Nepal’sTable A4.2.4: Nepal’s Share in Animal Diversity in the WorldGroupsNepalSpecies a Endemic species b Share (%)ArthropodsInsects 5,052 5 1,000,000 0.44Butterflies and Moths 2,893 30 112,000 2.6Spiders 144 108 73,400 0.2Freshwater fishes <strong>18</strong>5 8 <strong>18</strong>,150 0.1HerpetofaunaAmphibians 43 9 4,<strong>18</strong>4 1.0Reptiles 100 2 6,300 1.6Birds 844 2 9,040 9.3Mammals <strong>18</strong>1 1 4,000 4.5Source: a CBS (2003), B MOFSC (2002); c Wilson (1988; 1992)54 Environment Assessment of Nepal : Emerging Issues and Challenges
Chapter 5Water ResourcesIntroductionWater is the most plentiful natural resource inNepal. The major sources of water areglaciers, rivers, rainfall, lakes, ponds, andgroundwater. Of these, rivers are the largest source interms of water volume and potential development.There are over 6,000 rivers in the country with anestimated total length of 45,000 kilometers (km)(DHM 1998). All large rivers are fed by snowmelt fromthe Himalayas and hence they are a renewable waterresource. The country has 660 lakes of more than 1hectare (ha). Big lakes are used for irrigation,hydropower generation, fishing, and others. About75% of the total annual rainfall (average 1,700 mm)falls during the summer monsoon season(June–September) during which major agriculturalactivities take place. Groundwater remains animportant source of water, particularly in the Terairegion and Kathmandu Valley.Surface Water DischargeSurface water is the major source of drinking waterin Nepal (WECS 2004). The major rivers of Nepal arethe Koshi, the Gandaki, the Karnali, and theMahakali, all of which originate in the Himalayas.Table 5. 1 shows the catchment area and dischargeof selected major rivers. The Koshi river basin is thelargest, covering a catchment area of 60,400 km 2 , ofwhich 46% lies in Nepal and the remainder in TibetAutonomous Region of the People’s Republic ofChina. It has an average runoff equivalent to 1,409cubic meters per second (m 3 /sec) at Chatara. Some23% of Nepal’s population live in this river basin. TheGandaki river basin in the central region includesabout 90% of the river’s total catchment area. TheKarnali and the Mahakali river basins lie in the westof Nepal. Some 22% of Nepal’s population live in theKarnali basin, which has a population density of 92persons per km 2 . The Mahakali River acts as theborder between Nepal and India. About 34% of itscatchment area lies in Nepal.The Babai, Bagmati, Kamala, Kankai, and WestRapti are medium-sized rivers originating from theMahabharat range. These rivers, like the <strong>Himalayan</strong>rivers, are perennial. The innumerable southernrivers originating from the Siwalik hill range areshallow and mostly dry up during the dry season.These rivers are used by the managed irrigationschemes of small-scale farmers for seasonalsupplementary irrigation. They often swell andoverflow due to monsoon rains, destroying land andlives. The forests once covering most of the Siwalikhills have become degraded (Chapter 4). Every yearflooding affects the Siwalik land including the forests.A study by The World Conservation Union (IUCN2000) indicates that due to forest degradation,surface runoff rates have increased in areas exposedTable 5.1: Water Discharge of Rivers, NepalRiver Basin1. <strong>Himalayan</strong> riversTotalCatchment Area(km 2 , estimated)in NepalAverageDischarge (m 3 /s)Annual Discharge(billion m 3 /year)Koshi 60,400 27,863 1,409 45.0Gandaki 34,960 31,464 1,600 50.0Karnali 43,679 41,058 1,397 44.0Mahakali 15,260 5,<strong>18</strong>8 573 <strong>18</strong>.02. Mahabharat rivers 17,000 461 14.53. Siwalik rivers 23,150 1,682 53.0Total 145,723 7,122 224.5km 2 = square kilometer, m 3 /s = cubic meters per second, m 3 /year = cubic meters per yearSource: WECS (2004)Chapter 5: Water Resources55
to intense weathering, and percolation rates havedecreased. The Siwalik watershed areas are nowimpoverished and water recharge into the soil hasbeen reduced. During the rainy season, the heavyrainfall coupled with the soft rock results inmaximum sediment loads to rivers and streams. Adecline in the level of the groundwater table hasbeen reported, and desertification has begun in theTerai due to deforestation in the Siwalik range. In theSiwalik area of eastern Nepal, forest coveragedeclined by nearly 13% between 1979 and 1999, and68 ha of land was damaged as a result of landslides(IUCN 2000).Use of Water ResourcesTable 5.2 shows the water availability and use bysectors in 1995 and 2001. The country has about 224km 3 of annual renewable water, and the annual percapita water supply in 2001 was 9,600 m 3 , down from11,000 m 3 in 1995 (DHM 2001). In 1995, the totalannual withdrawal of water for consumptive uses(domestic, agriculture, and industry) was 14 km 3 andper capita annual withdrawal of water was 690 m 3 .Although the total annual withdrawal of waterincreased in 2001, most of the increase went toagriculture, while the percentage used for domesticpurposes decreased (UNEP 2001). Agriculture usedabout 96% of the total withdrawal in 2001, mostly forirrigation, with the domestic sector’s share less than4%. The use of water by the industrial sector isinsignificant. The estimated total annual waterrequirement for irrigation in the cultivated area is 67km 3 , which makes up nearly 30% of the total waterpotential of 224 km 3 .Current annual withdrawal of groundwater isabout 0.756 km 3 for irrigation and 0.297 km 3 fordomestic uses (WECS 2004). Groundwater is thebest alternative source of water supply, particularly inthe Terai region and Kathmandu Valley. The totalTable 5.2: Water Availability and Use by Sectors, NepalDescription 1995 a 2001 bTotal annual renewable water resource(km 3 /year)224.0 224.0Per capita renewable water resource('000 m 3 /year)11.0 9.6Total annual withdrawal (km 3 /year) 14.0 <strong>18</strong>.5Per capita annual withdrawal (' 000m 3 /year)0.69 0.8Withdrawal (percent) Domestic 3.8 3.6Industry 0.3 0.3Agriculture 95.9 96.1km 3 /year = cubic kilometer s per year, m 3 /year = cubic meters per yearNote: 1 billion m 3 = 1 km 3 .Source: a UNEP (2001); b WECS (2004)ground water potential of the country is 12 km 3 , ofwhich 5.8 to 11.5 km 3 can be extracted annuallywithout any adverse effects. However, the level ofgroundwater in Kathmandu Valley is alreadydropping due to overexploitation, as described in thenext section. The Bhabar zone with dense forestcover, a contiguous area of the Terai, is the rechargearea for the Terai’s groundwater.In addition to these uses, river water is also usedfor generating hydropower. The country has 83,000megawatts of potential hydropower generation, ofwhich 42,000 megawatts are economically viable. Atpresent, total electricity generation is around 559megawatts (WECS 2004). Further, microhydropowerplants are operated in several parts of the Hill and theMountain regions, although their contribution to totalhydropower generation remains small at 1.2%. Localstreams and rivulets are also important sources ofenergy for agro-processing in the Hill and Mountainregions. Operation of water mills (ghattas) forgrinding grain has existed for centuries; it isenvironmentally sound though not veryeconomically profitable. There are about 25,000water mills in Nepal (MOPE/REDP 2002).Sources, Quantity, and Quality ofDrinking WaterThe quantity and quality of water directly andindirectly affect human activity, health, andsanitation. These in turn depend on the watersources. Normally a person requires two liters ofwater per day for basic physiological processes(WHO 1996). Water quality refers to the suitability ofwater to sustain living organisms. For humans, it isused for drinking, bathing, washing, irrigation, andindustry. Changes in water quality are reflected in itsphysical, biological, and chemical conditions, andthese in turn are influenced by natural andanthropogenic activities.Sources of Drinking WaterNepal is a mountainous country with diversephysiographic regions, and thus different sources ofdrinking water are available for people in differentareas (Table 5.3). Tap water is the most importantsource, providing drinking water to almost 53% of allhouseholds. Tap water refers to water piped directlyfrom a source as well as to centrally distributed andpretreated water. The second most important sourceis tube wells. These two sources are important inboth urban and rural areas. The relative share of tapwater in urban and rural areas is 65% and 51%,respectively, followed by tube wells with 23% and56 Environment Assessment of Nepal : Emerging Issues and Challenges
Table 5.3: Type of Water Sources Used by HouseholdsDrinking Water Total Households % of Total U/R hh % of Total M/H/T Households (hh)Source Number % Urban Rural Mountain Hill TeraiTap water 2,209,760 52.9 65.4 50.6 72.2 72.2 30.8Tube well 1,<strong>18</strong>4,156 28.4 23.1 29.4 0.0 2.4 58.6Well 377,241 9.0 5.9 9.6 6.2 12.0 6.5Stone spout 267,<strong>18</strong>0 6.4 3.3 7.0 17.1 10.1 1.1River 61,400 1.5 0.5 1.7 3.4 2.0 0.6Other 74,721 1.8 1.8 1.8 1.0 1.2 2.5Households 4,174,457 100.0 664,505 3,509,952 285,217 1,950,345 1,938,895hh = households , M/H/T = Mountain, Hill, or Terai, U/R hh = urban or rural householdsSource: CBS (2002) Table 1 .Table 5.4: Household Access to Drinking Water Sources (%)RegionPiped to HousePiped Outside ofHouseCovered Well Open Well Other TotalMountain 10.5 61.8 1.2 2.5 24.1 100Hill 23.5 46.3 4.1 4.6 21.5 100Terai 6.2 8.5 74.6 5.1 5.6 100Rural 6.7 32.5 39.6 4.9 16.2 100Urban 53.3 14.3 25.3 3.4 3.9 100Nepal 14.4 29.5 37.2 4.7 14.2 100Source: NLSS (2004)29%. While tap water is the dominant source in theMountains and Hills, tube wells dominate in theTerai. All the sources of water listed in Table 5.3 areused by some households in all three regions, excepttube wells which are not available in the Mountains.Access to Drinking Water SupplyAccording to the latest survey (NLSS 2004), the shareof households with access to piped water in 1995/96was 32%, which increased to 53% in 2003/04 (Table5.4). The latter consists of households with waterpiped to the house (14%) and households with pipedwater outside of the house (30%). About 39% of allrural households have access to piped watercompared with 68% in urban areas. Access to pipedwater is lowest in the Terai; 75% of Terai householdshave access to covered wells (tube well), whereas62% of the households in the Mountains have accessto piped water outside the house (community tap).Other water sources include rivers, streams, andponds.Water QuantityTable 5.5 summarizes the water supply and demandcondition within and outside Kathmandu Valley, aswell as water treatment and leakage problems ingeneral. The share of total production capacity ofdrinking water in the region outside KathmanduValley increased from 31% in 1999 to 42% in 2001. Therelative demand and average daily production ofwater show a similar situation. The Valley’s water tapconnections constitute slightly over three fifthscompared with two fifths of the outside valley area,but the relative share of the latter increased between1999 and 2001. Treated water represents about 50%(NWSC 2001).To date, about 72% of the country’s totaldrinking water demand has been met (NPC 2002).Access to safe drinking water in rural areas hasincreased compared with that in urban areas due tothe relative decrease in rural population growthcompared with urban population growth. Each yearthe drinking water demand grows, and as a result,pressure on the existing output of water is intense.Over the last few decades, the population has grownat a rate of over 2% per annum. The area ofagricultural land has also increased, demandingadditional irrigation water. Natural factors such aslandslides and floods have also put pressure onwater resources by damaging reservoirs andirrigation canals.The pressure on drinking water sources isintense in large cities due to rapid urbanization. Forexample, most of the surface water sources inKathmandu Valley have been tapped for waterChapter 5: Water Resources57
Table 5.5: Water Supply and Water Treatment Plant sTable 5.6: Water Quality of Major Rivers During Dry SeasonSample Sites of Major Rivers inTDS DO BODpHDifferent Parts of Nepal(mg/l) (mg/l) (mg/l)Mahakali at Pancheswar, far west 8.8 110.0 5.0
Other sources of drinking water also show poorquality. All the sources of water shown in Table 5.7are used for drinking purposes in Kathmandu Valley.None of the groundwater sources such as dug wells,deep tube wells, and stone spouts, or surface waterincluding ponds and rivers, or even piped water werefound to be consistently free from fecalcontamination. The degraded quality of groundwaterin the Valley is due to polluted surface water,leachate, and sewage.Groundwater is the main source of drinkingwater in the Terai region, meeting over 90% of thedemand. But a recent study carried out by the NepalRed Cross Society (NRCS 2003) indicated that all 20Terai districts of Nepal have shown arseniccontamination in groundwater. According to theWHO guidelines, water from about one third of thetotal 29,804 tube wells tested is not acceptable forhuman consumption as it contains arsenicconcentrations over 10 parts per billion (ppb).According to the Nepal Interim Standard of 50 ppb,water from 7% of the tube wells tested is notacceptable for consumption (Table 5.8). Based onwater analysis of sample tube wells in four Teraidistricts (Nawalparasi, Parsa, Bara, and Rautahat),NRCS (2003) has found an arsenicosis prevalencerate of 2.2% among the risk population who areconsuming water above 50 ppb. It is estimated thataround 0.5 million people in the Terai are living at riskof arsenic poisoning (>50μg/L).Table 5.9 shows the mineral and bacteriologicalcontents of water from tube wells at selected sites inthe Terai region. The concentration of iron andmanganese is on the whole higher than the WHOstandard. The water is also not free from coliformbacteria.The reports show that the quality of both surfaceand groundwater sources in different parts of Nepalis degraded. This is the result of contamination bydomestic and industrial waste, human-inducednatural disasters, and agro-chemicals, and the effectsof changes in land use patterns. All domestic sewersare discharged directly into rivers without treatment.Although this is primarily an urban problem, it alsoaffects neighboring rural areas. Industrial waste isalso a major cause of surface water pollution—40%of the country’s 4,271 industrial units are reported tobe water-polluting industries (CBS 1998). In terms ofrelative contribution of BOD load, the major pollutingindustries include vegetable oil, distillery, andleather. The average use of chemical fertilizers, suchas nitrogen, phosphorous, and potassium (NPK) perhectare has increased tremendously from 7.6 kg in1975 to 26.6 kg in 1998. However, the concentrationof these nutrients is within the permissible level forriver water quality. Finally, landslides, soil erosion,Table 5.7: Bacteriological Water Quality of Different Water Sources, Kathmandu ValleyFecal Coliform/100 ml Dug Well Tube wellValue as % of Sample Units (n =16)Deep aWellSpringStoneSpoutPondRiverPipeWaterWHOGuidelineValue0 0 60 80 40 20 0 0 60 01–100 40 30 15 30 40 0 0 20101–1,000 30 5 5 30 40 0 100 20>1,000 30 5 0 0 0 100 0 0ml = milliliter, n = number, WHO = World Health OrganizationSource: Pradhan (2000); a NWSC (2000)Table 5.8: Arsenic Sample Tests in Nepal by Different AgenciesSource of DataArsenic (ppb)10-50 >50Total Sample sTested% of SamplesTestedDWSS 6,769 2,023 1,217 10,009 33.58NRCS 6,536 2,709 503 9,748 32.71RWSSSP/ FINNIDA 3,131 306 191 3,628 12.17NWSC 16 14 0 30 0.10NEWAH 235 85 29 349 1.17Plan International 2,778 2,171 70 5,019 16.84RWSSFDB 887 122 12 1,021 3.43Total Samples Tested 20,352 7,430 2,022 29,804 100.0% 68.29 24.9 6.78 100ppb = parts per billion , DWSS = Department of Water Supply a nd Sewerage, FINNIDA = Finnish International Development Agency , NEWAH = Nepal Water forHealth, NRCS = Nepal Red Cross Society, NWSC = Nepal Water Supply Corporation, RWSSFDB = Rural Water Supply and Sa nitation Fund Developme nt Board,RWSSSP = Rural Water Supply and Sanitation Sector ProgramSource: Sijapati et al. (2003)Chapter 5: Water Resources59
Table 5.9: Water Quality of Shallow Tube Wells in the Terai RegionSites (District)Chloride(mg/l)Ammonia-N(mg/l)Nitrate-N(mg/l)Iron(mg/l)Manganese(mg/l)Coliformcfu/100mlPanchgacachi (Jhapa) 15.4 0.70 0.2 6.0 0.8 11.1Baijnathpur (Morang) 16.4 0.50 0.2 4.5 0.5 15.9Bayarban (Morang) 17.6 0.50 2.4 6.0 0.6 0.5Takuwa (Morang) 21.0 1.00 1.0 10.4 0.4 45.9Shreepur Jabdi (Sunsari) 37.2 0.90 0.2 8.0 0.6 25.5Bandipur (Siraha) 195.6 0.70 3.5 0.4 0.4 1.0Naktiraipur (Saptari) 54.5 1.20 0.3 12.0 1.3 16.0WHO Standard 250.0 1.24 10 3.0 0.5 nilcfu = coliform units, mg/l = milligram per liter, WHO = World Health OrganizationSource: ENPHO (1990)and floods have often caused turbidity of river water.In the absence of proper protection, drinking watersources are polluted due to the floods duringsummer rainfall, which add turbidity and variousnutrients to the river water.SanitationSanitation can be measured in terms of availability ofsewerage and toilet facilities. Access of householdsto sanitation facilities increased from 6% in 1991 to25% in 1999 and 46% in 2001. However, the majorityof the population still practices open defecation. Thisis the major reason for the contamination of watersources, particularly in rural areas. There is a markedvariation in access to sanitation between rural andurban areas. In urban areas, access to sanitationincreased from 34% in 1991 to 67% in 1999, but inrural areas only from 3% to <strong>18</strong>% (NPC 1992; NPC1997; RWSSP 1999).On the basis of water use per person per day,NPC (1997) estimated the wastewater generated tobe 90% of the total per capita water consumption ofboth rural (45 liters per capita) and urban (60 litersper capita) areas. This means an estimated totalwastewater generation per day of 807 million liters inrural areas and 174 million liters in urban areas. Asthere are no treatment plants outside the valley, thiswastewater is assumed to be discharged directly intoTable 5.10: [Theoretical] Sewerage Coverage in NepalDescription 1999 2000 2001Total Length of Sewers (km) 220 225 232Interceptors 33.7 38.7 40Laterals <strong>18</strong>6.3 <strong>18</strong>6.3 192Number of Treatment Plants 4 4 4Population Served 390,000 400,000 420,000Population Coverage (%) 40 40 40Source: NWSC (2001) p. 11.water bodies. There are effectively no wastewater orsewage treatment facilities in Nepal. Nominally thereare four treatment plants in the country, all in thecities of Kathmandu Valley, but of these four, one ispartly functioning and the remaining three are notfunctioning at all (Table 5.10). Thus in parts ofKathmandu Valley, there are sewerage lines, but thesewerage is discharged directly into the river. In 2001it was planned to bring the defunct seweragetreatment station at Dhobighat into operation andconstruct an additional sewer line to extend theservice in urban areas. However, as of 2006, thetreatment station is still not in operation. In othercities and towns, there is storm drainage but nosewerage system.Public Health ImpactsWater pollution is the most serious public healthissue in Nepal. There is a vital connection betweenwater and health. The rivers have become majorplaces for urban solid waste disposal and dumping,and for industrial effluents, all of which areresponsible for deteriorating the river water qualityand contributing to waterborne diseases. In majorurban areas, particularly in Kathmandu Valley,vegetables are cleaned with polluted river water, andduring the dry summer season polluted river water isused for bathing and washing clothes, which mayhave adverse effects on human health. Theinadequate amount of drinking water is alsoresponsible for disease.The total treatment capacity of drinking water inNepal is much lower than the average amount ofwater produced (NWSC 2001). This means that thequality of drinking water is substandard. As noted inChapter 2, water-related diseases are among the topten leading diseases in the country. Of these,waterborne diseases (such as diarrhea, dysentery,cholera, and typhoid, resulting from consumption of60 Environment Assessment of Nepal : Emerging Issues and Challenges
contaminated water) and water-washed diseases(due to poor sanitation such as worm infestation andskin diseases) account for <strong>18</strong>% and 27% of the totaloutpatient department (OPD) visits in the countryrespectively (DOHS 2005). The proportion of OPDvisits related to waterborne diseases ranges from ashigh as 24% in Dailekh and Arghakhanchi (hilldistricts) to 14% (Bhaktapur, Lalitpur, Jhapa, Parsaand Rupandehi). The proportion of visits related towater-washed diseases was highest in Parsa (Teraidistrict) at 40%, and lowest in Dadeldhura (hilldistrict) at 12%. These water-related diseases aregenerally caused by poor sanitation and poor waterquality (DOHS 2005). Recent data from theDepartment of Health Services (2005) show that theincidence of diarrhea among children under fiveyears of age is 222 per 1,000, up from 131 per 1,000 in1996 (DOHS 1996). The reported mortality rate due todiarrhea was 0.34 per 1,000 children under five yearsof age in 1996, but has been reduced to 0.05 (DOHS2005). This indicates a greater focus on curativeaspects of the health services than on improvementsin the quality of the water supply. The hospitalrecords for Sukraraj Tropical Infectious DiseaseHospital in Kathmandu show about 16% of all deathsas due to waterborne diseases (STIDH 2004).Figure 5.2 shows the incidence of waterborneand water-washed diseases among outpatient visitsto hospitals (DOHS 2003). Waterborne diseases referto diseases due to consumption of contaminatedwater such as diarrhea, dysentery, and cholera;whereas water-washed diseases are due to poorsanitation conditions. The state of these two types ofwater-related diseases is usually used to describe thesanitation and health of any area. Among the regions,the proportion of water-related diseases is highest inthe Terai.The combined effects of land, soil, water, andair degradation on public health are significant,Figure. 5.2: Proportion of Water-related Diseases toTotal Outpatient Department Visits, NepalOPD = Outpatient DepartmentSource: DOHS (2003)particularly for the rural poor. These effects have agreat impact on their livelihood activities, becausethe poor already suffer from poor health as a result ofinadequate diets, low income, and degraded livingareas.WetlandsNepal’s wetlands provide habitat for a number ofendemic and threatened biological species, as wellas for humans. Many ethnic groups rely on wetlandresources for their livelihood. Wetlands are thereforevaluable for the overall socioeconomic developmentof the country. Unfortunately, most of the wetlandsand their rich biological resources, especially thosein the Terai, are facing several threats due to thegrowing demand of the population for land and avariety of products and services. The threats includesiltation, eutrophication, overexploitation of wetlandresources, over fishing, hunting and poaching,overgrazing, illegal harvesting of wetland resources,encroachment, water pollution, developmentalactivities in adjoining areas, drainage, introduction ofinvasive species, and floods. Due to conflicts amongthe local people in claiming the resources in andaround wetlands, and the absence of an effectivemechanism to ensure the efficient localmanagement of these valuable resources, valuablebiological species are gradually becoming extinct.Wetlands also provide habitat for thousands ofwater birds every year flying over an arduous 2,500-mile migratory journey from Siberia. Unfortunately, acrucial wetland resting point for these migratingflocks is drying up. The Koshi flood plain is flowingbelow its original capacity, at a level that is barelyable to support the local birdlife population, let alonethe 50,000 waterfowl that make up a spectacularmigratory showcase in the Koshi River during thewinter months each year (IUCN 1997).The conservation of Nepal’s wetlands shouldalso call for promoting collaborative efforts such ascommunity forestry programs and buffer zonemanagement programs that have been successful inmanaging natural resources in the country.Aquatic BiodiversityNepal is rich in aquatic floral and faunal biodiversity.Aquatic fauna species include fish, amphibians, andreptiles. Among aquatic fauna species, 34 arethreatened and 61 are insufficiently known (Shrestha1997). In Ilam in the eastern hills, katle(Neolissocheilus hexagonolepis) and silver mahseer(Tor tor) are reported to be endangered andthreatened, respectively (MOFSC 2002). Three fishChapter 5: Water Resources61
species are reported to be endangered, five speciesthreatened, and seven species restricted in theGandaki River, west Nepal (Shrestha 1999). Over 100dolphins (Platanista gangetica) were sightedrecently in the Karnali River in western Nepal andaround 20 more at the confluence of the Pathariyaand Mohana rivers, the tributaries of the KarnaliRiver, which lies 12 km southwest of Tikapur (Kailalidistrict) in the western Terai region (MOFSC 2002).The indigenous fish stocks have been decliningdue to over-fishing, harmful fishing practices(electro-fishing, dynamiting, use of chemicals),pollution, and development work (Shrestha 1999).Development works like river damming orhydropower projects have major impacts on riverecology and aquatic flora and fauna. TheGovernment has made environmental impactassessments (EIAs) compulsory since 1993 under theEIA National Guidelines for all hydroelectric projectsabove 5 MW.Compared with fish, there are very few studieson characteristic features of aquatic insects in Nepal.It is not yet known how many aquatic insects andanimals are threatened or extinct.There is a close association between quality ofwater and abundance and type of aquatic animals. Ingeneral, as the intensity of organic pollutionincreases the diversity of animals decreases andsensitive organisms are replaced by pollutiontolerantanimals. The rivers of Nepal flow throughdiverse geographic environments and possess avariety of aquatic macro-invertebrate species. Mostof them are pollution indicators and can be used todetermine the quality of river water. The diversity andabundance of benthic macro-invertebrates indicatesthe specific characteristic features of different sites ofa river. As the quality of a water body changes, theaquatic macro-invertebrates in that particular areaTable 5.11: Aquatic Macro -invertebrates inKathmandu Valley and the CountryNumberAquatic Macro -invertebrateKathmandu NepalColeoptera 15 <strong>18</strong>1Diptera 55 202Ephemeroptera 33 29Megaloptera 1 —Odonata 5 2Oligochaeta 5 —Trichoptera 14 59Gastropoda 7 —Heteroptera 7 —Plecoptera 9 67Hirudinea 2 —— = not availableSource: Pradhan (1998); Sharma (1998)will also change. They are either washed away or diedepending upon their sensitivity to pollution.Therefore, benthic macro-invertebrates are veryimportant in terms of classifying the quality of awater body. For example, the headwater region ofthe Bagmati River and its tributaries in KathmanduValley are rich in aquatic biodiversity, but poor wherethe rivers flow through the core city area because oforganic pollution. Table 5.11 shows the comparativepicture of aquatic macro-invertebrates inKathmandu Valley and Nepal as a whole. Thisinformation can provide a baseline for future studiesfor comparison in terms of decrease or increase inthe types of taxa, although as yet, no efforts are beingmade in this direction.Efforts in Water Supply andSanitation Improvement andManagementAttempts by government, nongovernment,community, and private organizations are underwayto better develop, manage, conserve, and utilizewater resources in Nepal, either through indigenousefforts or through economic and technical assistancefrom international and bilateral agencies. Two majorefforts are noteworthy.(i) The Water Resources Act 1992 is of greatsignificance, as it vests ownership of all waterresources with the State. Private ownership isdisregarded. The Act has appropriately recognizeddrinking water as the first priority in terms of order ofuse, followed by irrigation, farming enterprises likeanimal husbandry and fisheries, hydroelectricpower, cottage industry, water transport, and others.(ii) The National Water Resources Strategy 2002aims at developing and managing water resourcesfor sustainable use, while ensuring conservation andprotection of the environment in a holistic andsystematic manner. The strategy not only takes intoaccount water uses such as hydropower andirrigation but also recognizes other uses in areassuch as tourism and fisheries. The current Tenth Plan(2002–2007) considers the river basin approach asthe basis for the development and management oflarge rivers.Drinking water is the basic minimum need of allhuman beings. Provision of convenient, safe, andadequate drinking water is the declaredcommitment of His Majesty’s Government of Nepal.The Tenth Plan document states a goal of meeting85% of the total water demand by the end of the planperiod (2007) with gradual improvements in servicelevels, providing appropriate sanitation services in62 Environment Assessment of Nepal : Emerging Issues and Challenges
ural and urban areas through community awarenessprograms, and reducing infant mortality by bringingabout a reduction in water-related diseases. Thefollowing efforts are underway to increase people’saccess to drinking water: (i) Rainwater harvestingprograms in feasible areas; (ii) Community basedwater supply and sanitation sector projects,particularly in the mid and far-western regions; (iii)Rural water supply project and water resourcesmanagement programs by national and internationalNGOs in different areas; (iv) Community based ruralwater supply and sanitation programs; (v) A smalltown water supply and sanitation program; (vi) Awater quality improvement program; and (vii) Asanitation education and hygiene promotionprogram.In addition, the Irrigation Policy 2003 hasadopted many significant initiatives to exploitgroundwater for irrigation, particularly in the Terairegion. The policy has also addressed the issue ofarsenic contamination in groundwater used forirrigation.Analyzing the National Water Supply SectorPolicy’s objectives, policies, and programs related todrinking water leads to several observations. First,they emphasize enlarging the drinking watercoverage, but mere emphasis will not be adequateunless the quality (potable) and quantity (per capita)aspects of drinking water are considered. These twoaspects of water are vital in terms of health andsanitation. Second, the health and sanitationeducation program to reduce water-related diseaseswill not be effective unless the water sector defines aNepalese potable water standard. Further, the livingstandards of general rural communities must beraised by providing income-generating activities. Thiswill enable them to pay ever-increasing water andsanitation tariffs. However, this issue is not onlyrelevant to the drinking water sector, but interlinkedwith many other sectors related to water, sanitation,and health. It requires a coordinated effort to bemade at national, sub-national, and local levelsbecause water-related diseases relate to all of them.BibliographyBanskota M., and S.R. Chalise. 2000. Water of Life:Perspectives of Water Harvesting in the HKH.Kathmandu: International <strong>Centre</strong> for IntegratedMountain Development.Central Bureau of Statistics (CBS). 1998. A Compendium onEnvironment Statistics 1998. Kathmandu.———.2002. Population Census 2001. Kathmandu.CEMAT. 2000. “Report on Surface Water Quality MonitoringWorks of Kathmandu Valley.” Urban Water SupplyReforms in the Kathmandu Valley Project,Kathmandu.Chaudhari, R.P., and R.L. Singh. 1996. Flora of the TeraiRegion of Nepal: with Particular Emphasis onWetlands. Kathmandu: The World ConservationUnion (IUCN).Department of Hydrology and Meteorology (DHM). 1998.Hydrological Record of Nepal: Stream FlowSummary. Kathmandu.Department of Health Services (DOHS). 1996. AnnualReport 1994/1995. Kathmandu.———.1999. Annual Report 1997/1998. Kathmandu.———.2003. Annual Report 2001/2002. Kathmandu.———.2005. Annual Report 2003/2004. Kathmandu.Department of Water Supply and Sewerage (DWSS). 2002.A Study on Health Effects of Arsenic ContaminatedDrinking Water in Terai Districts, Nepal. Kathmandu:Environment and Public Health Organization/HisMajesty’s Government of Nepal, DWSS/UnitedNations Children’s Fund.Environment and Public Health Organization (ENPHO).1990. Water Quality Assessment for Terai TubewellProject. Kathmandu.Environment and Public Health Organization(ENPHO)/Welink/Ministry of Population andEnvironment (MOPE). 2002. State of Rural Energy inthe Mountains, Nepal. Kathmandu.Gyawali, D. 2001. Water in Nepal. Kathmandu: HimalBooks.IUCN (The World Conservation Union). 1997. Koshi TappuWetlands: Nepal’s Ramsar Site. Kathmandu.———.2000. Conservation Status of Siwalik Area of IlamDistrict. Kathmandu.Joshi, A.R., and D.P. Joshi. 1991. “Endemic Plants of NepalHimalaya: Conservation, Status, and FutureDirection.” Mountain Environment and Development1(2): 1–35.Metcalf and Eddy. 2000. “Groundwater and Wastewater.”Seminar Paper prepared for the Melamchi WaterSupply Development Board, Kathmandu.Ministry of Agriculture and Cooperative (MOAC). 2002.Statistical Information on Nepalese Agriculture2001/2002. Kathmandu.Ministry of Forest and Soil Conservation (MOFSC). 2002.Nepal Biodiversity Strategy. Kathmandu.Ministry of Population and Environment (MOPE)/Renewable Energy Development Programme(REDP). 2002. State of Rural Energy in the Mountains,Nepal-2002. Kathmandu: His Majesty’s Governmentof Nepal, Ministry of Population and Environmentand United Nations Development Programme, RuralEnergy Development Programme.Chapter 5: Water Resources63
Ministry of Water Resources (MOWR). 1999. Assessment ofWater Resources and Water Demand by UserSectors in Nepal. Kathmandu.National Planning Commission (NPC). 1992. Eighth Plan(1992–1997). Kathmandu.———.1997. Ninth Plan (1997–2002). Kathmandu.———.2002. Tenth Plan (2002–2007). Kathmandu.Nepal Living Standards Survey (NLSS). 2004. Nepal LivingStandards Survey 2003/2004: Statistical Report,Volumes 1 and 2. Kathmandu: His Majesty’sGovernment of Nepal, Central Bureau of Statistics.Nepal Red Cross Society (NRCS). 2003. Assessment of theEffects of NRCS Arsenic Mitigation Measures on theHealth of Arsenicosis Patients in Four TeraiDistricts—Nawalparasi, Parsa, Bara, and Rautahat—Nepal. Kathmandu: Environment and Public HealthOrganization/ Nepal Red Cross Society/Japan RedCross Society.Nepal Water Supply Corporation (NWSC). 1999. WaterSupply and Coverage in Urban Area of Nepal.Kathmandu.———. 2000. Annual Report. Kathmandu.———. 2001. Annual Report. Kathmandu.Pradhan., B. 1998. “Water Quality Assessment of theBagmati River and its Tributaries, Kathmandu Valley,Nepal.” Unpublished Ph.D. Dissertation, University ofNatural Resources and Life Sciences, Vienna.Pradhan., B. 2000. “Assessing Drinking Water Quality inKathmandu Valley, Nepal.” Health Prospect NewVision for New Century Vol. 2 No. 2, Nepal PublicHealth Society/Institute of Medicine, Kathmandu.Rai, K. 2004. Hydropower Development in Nepal—LocalResponses to Technology and Formal Institution.Available: http://www.tropentag.de/2004/abstracts/full/176.pdfRural Water Supply and Sanitation Project (RWSSP). 1999.RWSSP Rural Water Supply and Sanitation ProjectPhases I, II and III. Kathmandu: His Majesty’sGovernment of Nepal, Ministry of LocalDevelopment.Sharma. S. 1998. An Inventory of the Aquatic Insects ofNepal Used as Bio-indicators of Water Pollution.Kathmandu: University Grants Commission.Shrestha, T.K. 1999. “Overview on Fish.” In Nepal CountryReport on Biological Diversity, pp. 52–59, edited byT.B. Shrestha. Kathmandu: The World ConservationUnion (IUCN). Available:http://www.biodiversityasia.org/bpsp/images/listof~2.docSijapati, S., B. Pradhan, and U. Parajuli. 2004. IrrigationStrategy for Nepal in the Context of Arsenic Threat:Preliminary Perspectives from the Narayani IrrigationCommand Area. Rome: Food and AgricultureOrganization.Stanley. 1994. Report on the Bagmati Basin WaterManagement Strategy and Investment Program.Kathmandu: Stanley International/Mott-Macdonald/EAST Consultant.Sukraraj Tropical Infectious Disease Hospital (STIDH).2004. Records of Waterborne Disease 2004.Kathmandu.United Nations Environment Programme (UNEP). 2001.Nepal: State of Environment 2001. Bangkok: UnitedNations Environment Programme, RegionalResource Center for Asia Pacific.Upreti, B.R. 2004. “Resource Conflicts and ConflictResolution in Nepal.” Mountain Research andDevelopment 24(1): 60–66.Uprety, B.K. 2003. Environmental Impact Assessment:Process and Practice. Kathmandu: ShikharSamundra Offset.Water and Energy Commission Secretariat (WECS). 1999.Annual Report 1999. Kathmandu.———.2004. “National Water Plan.” Draft report, Water andEnergy Commission Secretariat, Kathmandu.World Health Organisation (WHO). 1996. Guidelines forDrinking Water Quality: Health Criteria and OtherSupporting Information. Geneva.64 Environment Assessment of Nepal : Emerging Issues and Challenges
Chapter 6Energy ResourcesIntroductionThe availability and use of energy is necessaryfor survival and prosperity. It is basic to anysociety’s development and economic growth.Energy is used for many purposes in daily life and inthe process of social and economic development,and the amount of energy consumed is an indicatorof level of development and standard of living. Grossnational income per capita is higher where percapita energy consumption is also higher. Thisindicates the link between prosperity and energy usein the present world—rich countries use a lot ofenergy. Nepal’s per capita energy consumption isone of the lowest in the world as well as in SouthAsia, reflecting the low level of development andprosperity (Table 6.1).Expanding economic activity and populationgrowth are the two basic factors behind increases inenergy consumption. In a country like Nepal, whereeconomic growth is necessary and populationgrowth is high, energy demand will continue to risein the years to come. Energy consumption patternsand the rise in demand, their sources, and ways inwhich they are harnessed and utilized haveimplications for the environment and naturalresources, which ultimately affect overalldevelopment.Sources and Consumption PatternsSourcesNepal’s energy supply is primarily based on threesources.Traditional (biomass). This includes fuelwood,agricultural residues, and animal waste. Biomass isthe traditional source of energy in Nepalese society,which is predominantly rural and agricultural. Peoplein rural areas do not have to pay for biomass—it iseither available free from nature (fuelwood collectedfrom a nearby forest) or is a byproduct of agriculturalactivities (agricultural residues and animal dung). Inthe past, there was an abundant supply of biomassfrom the forest and agricultural activities. TheTable 6.1: Energy Consumption and Per Capita IncomeCategoryGNI($)Energy UsePer Capita(kg oilequivalent)ElectricPowerConsumptionPer Capita(kWh)World Average 5,120 1,686 2,159South Asia Average 460 469 331Countries in Different Income GroupsLow Income 430 5<strong>18</strong> 317Middle Income 1,850 1,339 1,447High Income 26,490 5,423 8,421Selected CountriesNorway 38,730 5,896 24,881Switzerland 36,170 3,875 7,474United States 35,400 7,996 11,714Japan 34,010 4,099 7,237United Kingdom 25,510 3,982 5,653Singapore 20,690 7,058 7,178China, People’sRepublic of960 896 893India 470 515 365Bangladesh 380 153 94Nepal 230 357 61kg = kilogram, kWh = kilo watt-hour, GNI = gr oss national incomeNote: GNI per capita is gross national product (GNP) divided by population.Source: IBRD/WB (2004)situation has been changing in recent times due toincreases in population, long-term decline in forestareas (despite recent increases), and rising demandfor energy. Biomass is becoming scarce and biomasssources are under increasing pressure, withpotentially adverse consequences on agriculture andthe environment. However, rural people continue touse biomass as an energy source because they haveno other options and they do not have to pay for it.Commercial. Commercial energy, also knownas conventional energy, is traded in the market and inNepal this comprises coal, electricity suppliedthrough the national grid, and petroleum products.Hydropower is the main source of electricity inNepal.Chapter 6: Energy Resources65
Definition, Forms, and UnitsEnergy is the capacity of matter to do work in relation toforces acting on it. Five forms of energy are oftendistinguished: (i) Mechanical, (ii) Electromagnetic, (iii)Thermal, (iv) Chemical, and (v) Nuclear. Energy conversiontakes place among and within these forms in the process ofhuman production and consumption, as well as in nature;for example burning fuels to produce heat convertschemical energy to thermal energy (i.e., burning woodreleases stored chemical energy, but all is not converted toheat; if heat is the desired form of conversion, conversionto other forms are losses). The efficiency of conversion fromone form to another depends on the extent to whichunwanted dissipation can be avoided. Unwanted dissipationin the process of conversion and use is energy lost.The most common energy sources are biomass, solar,fossil, hydropower, wind, and wave. The sources can beclassified as renewable or nonrenewable depending onwhether they can supply continuously or will be exhausted.The primary source of energy available to us is the sun. Theconcept of renewable and nonrenewable energy is a relativeone—it is basically a distinction about time and spacescale.Energy is measured and expressed in various ways.Joule (J) is the internationally recognized unit for energy.Energy production and use involves conversion of energyfrom one form to another: the rate of conversion (or rate ofdoing work) is defined as power, which is commonlymeasured in watt (W): 1 W is 1 J per second. Electricalappliances have power ratings quoted as W or kW, such asa 40-W electric bulb. Kilogram of oil equivalent issometimes used to bring energy consumption from differentsources to a single, common unit and to express it in aneasily understandable manner.Source: Blunden et al. (1991)Alternative energy. Biogas, micro-hydro, solar,and wind energy come under this heading. Biogas isa more efficient way of utilizing some biomass(animal dung) as energy. Hydropower (includingmicro-hydro), biogas, solar, and wind energy arerenewable; within their re-generation capacity, thesecan supply energy indefinitely.Nepal’s indigenous energy resources includebiomass, hydroelectricity, solar, and wind. Coal andpetroleum products are imported, as the country hasno known economically exploitable fossil fuelreserves. The potential of known indigenous energyresources in Nepal is estimated to be 1,970 milliongigajoule (GJ) annually on a sustainable basis (WECS1996), which would be 15 times the estimated totalconsumption. This indicates that there is sufficientpotential energy supply from indigenous sources. Ofthe total sustainable potential, water resourcesrepresent the largest fraction (75%), with forestscontributing 12%, and the rest coming from othersources.Consumption PatternsIn 2002, Nepal’s total energy demand was 8,883thousand tons of oil equivalent. Energy consumptionincreased at an average rate of 2.5% per annumbetween 1993 and 2002. The annual per capitaenergy consumption is 347 kg of oil equivalent (CBS2004).The energy consumption pattern by sourcebetween 1993/94 and 2002/03 is shown in Table 6.1.Energy consumption is dominated by traditionalsources, which accounted for about 87% of the totalenergy consumption in 2002/03, although itspercentage of total consumption has been slowlydeclining (Table 6.2). Of the traditional sources,fuelwood accounted for 89%, agricultural residuesfor 4%, and animal waste for 6%. Fuelwoodcontributed 75% of the total energy consumed in2002/03. This indicates the pressure on the traditionalsources, primarily on the forests.The share of commercial and alternativesources has been increasing, although at a slowpace. From 1993/94 to 2002/2003, consumption ofcommercial energy increased from 7.5% to 12% ofthe total energy consumed, and the contribution ofalternative energy increased from about 0.1% to0.5%.The energy consumption by sector is shown inTables 6.3 and 6.4. The residential sector consumed90.6% of all energy consumed in 2003, followed bytransport (3.9%), industry (3.4%), commercial (1.2%),agriculture (0.8%), and others (0.1%). Although theamount of energy consumed has increased, theshare of energy consumed by different sectors hasremained more or less unchanged over the lastdecade.The residential sector mainly consumestraditional fuels, whereas the “other” sectorconsumes commercial fuels. Residential consumptionaccounts for around 98% of the traditional fuelsconsumed in the country. Cooking is the mainresidential use of energy in rural areas, where themajority of people live, and fuelwood is the mainsource (household cooking consumes 65% of allrural energy). The residential sector consumes 99%of total fuelwood consumption. In urban areas,kerosene, liquefied petroleum gas (LPG), orelectricity is used for cooking (MOPE 2003). Nepalimports all petroleum products and coal, most ofwhich is consumed by automobiles and industries.Nepal’s energy supply and consumptionpatterns are overwhelmingly dominated bytraditional biomass sources and residential uses,respectively. The principal use of biomass energy in66 Environment Assessment of Nepal : Emerging Issues and Challenges
Table 6.2: Energy Consumption Pattern by Source 1993/94 –2002/03Energy Consumed (‘000 toe)Percentage of Energy ConsumedYear Traditional Commercial Other Total Traditional Commercial Other Total1993/94 5,933 483 6 6,422 92.4 7.5 0.1 1001994/95 6,059 582 8 6,649 91.1 8.8 0.1 1001995/96 6,<strong>18</strong>5 651 11 6,847 90.3 9.5 0.2 1001996/97 6,268 691 15 6,974 89.9 9.9 0.2 1001997/98 6,403 769 21 7,193 89.0 10.7 0.3 1001998/99 6,540 811 25 7,376 88.7 11.0 0.3 1001999/00 6,681 1,044 29 7,754 86.1 13.5 0.4 1002000/01 6,824 1,095 34 7,953 85.8 13.8 0.4 1002001/02 6,996 1,169 39 8,204 85.3 14.2 0.5 1002002/03 7,240 1,003 39 8,282 87.4 12.1 0.5 100toe = tons of oil equivalentSource: MoF (2003)Table 6.3: Energy Consumption by Sector ( ‘000 GJ)Sector 1994 1995 1996 1997 1998 1999 2000 2001 2002 2003Residential 254,853 260,951 267,542 274,341 281,533 287,815 295,159 301,143 314,655 320,268Industrial 9,231 11,084 11,771 6,417 6,921 7,522 15,717 12,998 12,537 11,969Commercial 2,206 2,558 2,840 3,179 2,919 3,215 3,708 4,128 4,921 4,081Transport 6,682 7,839 8,721 11,942 13,546 14,849 12,798 13,592 12,025 13,850Agricultural 535 640 690 966 1,099 711 2,968 3,152 2,776 2,888Other 206 243 262 293 322 342 355 409 454 484Total 273,712 283,315 291,827 297,139 306,339 314,454 330,706 335,421 347,369 353,541GJ = gigajoulesSource: Water and Energy Commission Secretariat, Kathmandu, 2005. Unpublished data file.Table 6.4: Share of Energy Consumption by SectorSector1994 2003% %Residential 93.1 90.6Industrial 3.4 3.4Commercial 0.8 1.2Transport 2.4 3.9Agricultural 0.2 0.8Other 0.1 0.1Total 100.0 100.0Source: Water and Energy Com mission Secretariat, Kathmandu , 2005.Unpublished data file.rural Nepal is burning in traditional cooking stoves oropen fires. This is very inefficient, as most of the heatgenerated is lost. It is possible to increase theefficiency by introducing better technologies such asimproved cooking stoves.HydropowerNepal is rich in water resources. The gradientprovided by the mountain topography, monsoon rain,and <strong>Himalayan</strong>-fed rivers offer great potential forhydropower development (Tables 6.5 and 6.6). Thehydropower potential in Nepal is estimated to be83,000 megawatts (MW), of which 42,000 MW iseconomically feasible at present. A substantialproportion of the potential is based on reservoirprojects.The National Water Plan (2002–2027) estimatesthat the maximum domestic demand for power by2027 will be less than 7,000 MW even under a highgrowthscenario—this is only about 17% of theeconomically feasible potential. This indicates thatNepal will have substantial surplus potential for theforeseeable future, and in theory the surplus couldbe exported to neighboring countries, particularly toIndia and Bangladesh where there are energyshortages.Nepal has been keen to encourage hydropowerdevelopment. The Water Resources ACT 1992,Hydropower Development Policy 1992 and 2001,Electricity Act 1992, and Environment Protection Act1996 are milestones in this direction. However,despite the great potential and the Government’semphasis on developing hydropower, theChapter 6: Energy Resources67
Table 6.5: Hydropower PotentialRiver BasinTheoreticalPotentialEconomicallyFeasibleGW % GW %Sapta Koshi 22.35 27 10.86 26Sapta Gandaki(Narayani)20.65 25 5.27 13Karnali and Mahakali 36.<strong>18</strong> 43 25.10 60Southern Rivers 4.11 5 0.88 2Total 83.29 100 42.13 100GW = giga wattSource: WECS (1995); USAID -SARI (2002)Table 6.6: Summary of Hydroelectric DevelopmentOpportunitiesCategoryNumber ofProjectsIdentifiedTotalCapacity(MW)TotalGenerationPotential(GWh/y)10–100 MW(medium)157 6,200 38,000100–300 MW(medium)47 7,815 42,056300–1,000MW (large)20 9,437 45,723> 1,000 MW(large)5 19,463 50,985Total 229 42,915 176,764GWh/y = gigawatt -hour per year , MW = megawattSource: WECS (2002)contribution of hydroelectricity to the overall energyproduction has so far been very small—only about1% of the total energy need is met by hydropower.Power produced by the hydroelectric plantsconnected to the national grid mainly supplyelectricity to urban areas and their peripheries. At theend of the Ninth Plan (1997–2002), the national gridsupplied electricity to an estimated 33% of Nepal’spopulation, and an additional 7% had access toelectricity generated from alternative energy sourceslike micro-hydro and solar (NPC 2002). A large part ofthe rural population is deprived of electricity.Some of the factors contributing to the low levelof hydropower development are lack ofinfrastructure and capital, high cost of technology,political instability, lower load factor due to lowproductive end-use of electricity, and high technicaland non-technical losses. Despite its huge potentialand acknowledged importance in nationaldevelopment, hydropower development has beenlacking. The main concerns related to hydropowerdevelopment in Nepal include the following.High TariffNepal’s electricity tariff is comparatively high. In2004, the average tariff in Nepal was NRs 6.7 perkilowatt-hour (kWh) ($0.091 per kWh), among thehighest in the developing countries of Asia. Themarginal rate for domestic energy consumptionabove 250 kWh/month is NRs 9.9 per kWh (US$0.134cents per kWh), which is equivalent to or higher thanthe tariff in many developed countries (NEA 2005).The reasons for the high tariff include highproduction costs, high transmission and distributionlosses due to technical losses and theft, inefficiencyin management, and non-payment (or payment inarrears) from public sector customers. Further, theNepal Electricity Authority (NEA) has beenpurchasing power from independent powerproducers at rates higher than its own currentaverage cost of production. Power purchaseagreements between independent power producersand NEA are on a ‘’take or pay” basis that requiresNEA to pay for all energy produced in all seasonswhether it is utilized or not, and the power purchaseagreements are based on US dollar rates. The tariff ischarged based on cost of production and with theintention of recovering costs, although Nepalreceived significant foreign finance as soft loans andgrants. All of these factors result in high tariffs.The cost of hydropower development in Nepalis high (typically NRs 5 per KWh for run-of-riverplants), which is generally attributed to the fragile,unstable geology of hydropower sites (as well asremoteness of the sites which require building costlyroads and infrastructure for access as part of theproject cost), limited manufacturing capabilityrelated to hydropower plants (or grant or loanconditions tied to purchasing equipment from thecountry providing the grant), extensive employmentof high-cost international contractors andconsultants, and heavy reliance on bilateral andmultilateral financing(WECS 2002, WECS 2004,USAID-SARI, 2002).Slow DevelopmentAlthough the first hydroelectric power plant in thecountry was established in 1911 at Pharping, by 2003Nepal’s total installed capacity had reached only 546MW (about 1.3% of the feasible potential), whichincludes 144 MW hydropower produced by the eightindependent power producers. In addition tohydropower, six thermal power plants owned by theNEA produce 57 MW. Thus total installed capacity inthe country available in the integrated nationalpower system is 603 MW.NEA’s monopoly until 1992 is cited as a reasonfor the slow development of hydropower in Nepal.Recent policies adopted following restoration of themultiparty system allow private sector developmentof hydropower, and since then several projects havebeen constructed by domestic and international68 Environment Assessment of Nepal : Emerging Issues and Challenges
private companies. Now some 21% of the installedcapacity comes from the private sector. TheGovernment’s emphasis on large, export-orientedprojects is another reason for the slow developmentof hydropower. In the past, the Government gavepriority to mega-power projects such as the Karnali,Arun, and Pancheswor, with the aim of exportingpower to India rather than meeting Nepal’s ownneeds. However, development of these projects hasbeen hampered because there was no ensuredexport market in the absence of a power purchaseagreement with India. There appears to be a “buyersmonopoly”, as India is the only potential market andIndia has been unwilling to pay commercial rates forenergy or to put an economic value to the otherbenefits, such as flood control, that India can derivefrom developing hydropower projects in Nepal.Problems with DamsAlthough much of the hydropower potential in thecountry can be exploited through run-of-the-riverprojects, a portion requires construction of dams.Development of dams is seen as a means to providewater for consumption, clean energy, and floodcontrol. However, experience in the construction,operation, and maintenance of dams is in its infancy.Development of large hydro dams is complex in thisgeologically unstable area, and in light of the poorinfrastructure in many mountain areas. Concerns areoften voiced about the impact on local populationsand the environment (see Energy and Environmentsection below). Small- and medium-scale damprojects of up to 100 MW are sometimes suggestedas a more environmentally friendly alternative tolarge hydro projects (Gubhaju 1994; WCD 2001). Thisdebate, and the complex construction requirements,have also slowed hydropower development in thecountry.Inadequacy in Linking HydropowerDevelopment with National DevelopmentHydropower is termed “white gold”, and itsdevelopment can play a vital role in the developmentof Nepal. Although hydropower’s importance innational development is acknowledged by all, effortsto develop it appear to lack a long-term vision, plans,and strategy that clearly identify linkages withnational development goals. As an example,hydropower development could be linked withindustrial and electric transport development anddevelopment of rural areas. Much of the debatehowever, concentrates on issues of export versusdomestic consumption, small versus big projects,and reservoir versus run-of-river projects rather thanon how Nepal could best benefit from hydropowerdevelopment. Project identification and developmentoften take place in isolation, not as anintegrated, coordinated plan to stimulate the nationaleconomy and social development. It is assumed thateach individual project will automatically bringsocioeconomic development, which is hardly thecase.Financial ConstraintsNEA’s hydropower production cost in Nepal isaround $3,000 to $4,000 per kW constructed—two tofour times more than the cost in the neighboringPeople’s Republic of China, India, and Bhutan. Butthe private sector projects cost between $1,500 and$2,500 per kW constructed. Hydropowerdevelopment requires high capital investment.Donor assistance and government funds have beenthe major source of finance for hydropower projects.In the past, as much as 80% of all investmentrequirements came from multilateral and bilateraldonor assistance (USAID-SARI 2002). Private-sectorinvestment in hydropower has gradually increasedsince 1992. This needs to be further promoted as theavailability of donor funding is declining, and publicfunds are more needed by the social sector. Thedomestic and international private sector could be agreater source of investment if an appropriate andfavorable environment for competition and costreduction were created.Building National CapacityNepal’s hydropower development has relied largelyon imported technology and expertise. This situationis obviously undesirable in the long run. Capability isneeded in all fronts of hydropower development,including planning and design, construction andmanagement, and manufacturing hydropowerrelatedplants and accessories. Although nationalcapability has been developing and smaller projectsare now being constructed with experts andChilime Hydroelectric Plant HeadworksChilime Hydropower Company LtdChapter 6: Energy Resources69
Chilime Hydroelectric Project: An Exampleof National Effort in HydropowerDevelopment, Completed August 2003The Chilime Hydroelectric Project (CHP) has an importantplace in the history of hydropower in Nepal. It is a mediumsize run-of-river scheme with a rated capacity of 22.56 MW.CHP is the first hydropower project of this size in Nepal thatwas planned, designed, financed, and constructed by theNepalese themselves without outside technical assistance.Most of the components including surge tank, power house,transformer cavern, penstock shaft, and tunnel areunderground. CHP is funded with a debt:equity ratio of 60:40.It received short-term and long-term loans from Nepalesefinancial institutions, mainly from Karmacari Sanchaya Kosh(Employees Provident Fund) and Nagarik Lagani Kosh (CitizensInvestment Trust). Nepal Electricity Authority (NEA) holds 51%of the equity, while NEA employees hold 25% and the generalpublic 24%.Nepalese expertise, contractors, and manufacturerswere utilized to the extent possible. Nepalese constructioncompanies were employed for construction of the accessroad and camp infrastructure; the headwork structureincluding the diversion structure, the intake, gravel trap,approach canal, reservoir overflow spillway, and desander;and other surface structures such as the power canal,siphon, and pressure conduit. Underground civil structureswere contracted to an Indian company; however, Nepalesecompanies, under subcontracts with the main contractor,carried out tunneling and other underground constructionactivities. Nepalese contractors and manufacturerscompleted hydro-mechanical works including gates and stoplogs, as well as the steel siphon pipe structure. The supplyand erection of electrical and mechanical equipment wasdone by a German company.CHP consulted and involved project-affected people,local communities, and their representatives in the projectfrom an early stage. A mechanism was formed to facilitateand ensure implementation of social and environmentalmeasures to mitigate adverse impacts and to enhanceproject benefits to the locality.With the experiences gained from CHP and otherrecent hydropower projects, there is confidence now that theNepalese are competent to plan and develop run-of-riverhydropower projects up to 100 MW. It took about 10 yearsfor CHP to generate electricity commercially, including athree-year delay due to termination of the original contractwith a Chinese contractor, and transport and otherdifficulties caused by political instability and others. Lessonsfrom CHP and recent similar projects suggest that projectsof this size could be completed in about 5 to 6 years ifplanned and managed properly. The total cost of CHPdevelopment was about NRs 2.45 billion (or about $35million—$1,550 per kW). This is comparable to the cost ofsimilar-size projects in the region including in India andBhutan. The per unit cost could be further reduced ifelectrical and mechanical equipment manufacturingcapacity were developed in the country.technology largely available in Nepal, capacity isgrowing at a very slow pace and is still very limitedand far less than necessary.In light of the above concerns, hydropowerdevelopment in Nepal should be guided by a broadperspective. Common recommendations made inthis regard include the following (USAID-SARI 2002).Improve power system planning. This mayinclude selection of an optimal generation mix;introduction of storage projects to increase thesystem’s capacity, optimization of installed capacitybased on a “systems concept” rather than on anisolated project optimization basis, interconnectionwith India to take advantage of coordinatedoperation of hydropower and thermal dominatedsystems, implementation of demand-sidemanagement to improve the load factor and reducehigh system losses, and use of investment planningtools suitable for hydro-dominated systems.Increase access to electrification in ruralareas. This may include: grid-based ruralelectrification, mini and small hydro-based localgrids, and use of other renewable sources like solar,wind, and biogas.Raise the needed investments for hydropowerdevelopment. Hydropower development isvery capital intensive. Government and donor fundsare not enough. Hence, the investment requirementsof the power sector have to come from the privatesector.Strengthen institutional and agency involvementin the power sector. The policy, regulatory,and operational functions of the organizationsinvolved in the hydropower sector should be definedto eliminate overlap in their work. Institutionalstrengthening should also be geared towardsdevelopment of multipurpose projects that can havebenefits of cost sharing and optimum utilization ofthe available water resources.Promote power exchange and export withneighboring countries, particularly with India.The Government should hold talks with concernedauthorities in India to move this ahead and considerallowing independent power producers to negotiatepower purchasing agreements directly with powerpurchasers in India without having to go through theMinistry of Water Resources of the Government ofNepal as is the current practice.Reduce the cost of hydropower development.The cost of hydropower projects can be reducedsignificantly if the Department of Roads wouldcoordinate with the NEA in aligning planned roads toprovide close access to potential hydropower sitesthat have been identified by the NEA.Source: Bhattarai (2005) and personal communication.70 Environment Assessment of Nepal : Emerging Issues and Challenges
Alternative EnergyAt present, alternative energy is the preferred choicefor rural areas of Nepal for various reasons. However,this might change over time as the country developsand the national grid can supply electricity to remoterural areas at an affordable tariff. Some reasons forpreferring alternative energy sources at present arediscussed here. First, the excessive dependence ontraditional biomass energy (fuelwood, agriculturalresidues, and animal waste) and their inefficient usehas undesirable implications for the environment,health, and economy. Furthermore, commercialfuels are not easily available in remote areas (thismight change with improvement in access). Mostrural areas of Nepal do not receive electricity fromthe national grid, and the situation is unlikely tochange in the near future because the integratednational power system is already overburdened, theterrain in the <strong>Himalayan</strong> mountains is difficult, andpopulation density is low. The price of commercialenergy (electricity from the national grid as well askerosene and LPG), where available, is generallybeyond rural people’s purchasing capacity, whereastraditional biomass fuel is free of cost. Therefore,people continue to use the traditional energy evenwhere commercial energy is available. Thusalternative energy can play a significant role inremote and rural areas.Despite its importance and desirability, a majorhurdle in promoting alternative energy is its highinstallation cost. Sustainability of alternativerenewable energy is often questioned, as it cannotfreely compete with grid electricity and petroleumfuels in the existing national and global market andenergy systems. The market, however, is imperfectas it does not reflect environmental costs. Hence,there is a strong argument for a set of strategies,policies, and subsidies favoring alternativerenewable energy. The Government has beenproviding subsidies to alternative energy since theEighth Plan (1992–1997), which is the mainpromotion of alternative energy in Nepal. Majorissues related to subsidies are that the policy hasfrequently changed or been inconsistent, causingdifficulties and frustration to the stakeholdersinvolved; subsidies have depended on donorassistance and continuity cannot be relied upon, asdonor priorities can change; many of the benefits ofsubsidies go to suppliers rather than to people; andfinally, subsidy schemes usually fail to consideroperation and maintenance, and as a result asignificant proportion of alternative energytechnologies cease to function soon after beinginstalled.The highest micro-hydropower plant in Nepal at TshoRolpa (approx. 4,500 masl)Micro-hydropowerHydropower schemes in the range of 5 kW to 100 kWunits are a suitable and common choice for the ruralhilly areas of Nepal due to low capital investment,simple technology for which Nepal has in-countrycapacity, hilly topography, fairly high rainfall,numerous streams, and scattered rural settlementsand communities.Micro-hydro electrification started in the 1970s,and the Government began encouraging it in 1980through a subsidy scheme. The installation ofelectrification schemes has been rising sharply sincethe mid-1990s following the inception of the RuralEnergy Development Programme and establishmentof the Alternate Energy Development Center. Thereare around 2,000 micro-hydropower plants in Nepalwith a total capacity of about 12 MW—nearly 3% ofthe country’s total hydroelectric power output(MOPE 2003; Basnyat 2004).Despite its potential and advantages, there areconstraints and obstacles to micro-hydro’swidespread development.The electricity generated from micro-hydro hasbeen used mainly for evening lighting. Thus, the peakGhatta, a water-powered millDHMM. ShresthaChapter 6: Energy Resources71
load occurs from 6 pm to 9 pm with low utilization atother times. Low load-factor is a consistent problemfor micro-hydro and affects the sustainability ofmicro-hydros schemes. There is a need to link microhydrowith micro-enterprises in rural communities.Diesel and water mills are competitors of the microhydroplants.Repair and maintenance is a major problemfaced by micro-hydro plants installed by outsideagencies. Operation, maintenance, and managementare done locally, but there is general lack oftechnical skills and management capacity at thelocal level. As a result, a significant proportion ofmicro-hydro plants are non-functional.Micro-hydro plants and civil structures aresusceptible to damage by landslides and monsoonfloods due to the mountain terrain and high rainfall.A micro-hydro plant may require diversion ofwater used for irrigation and other purposes. As aresult conflict may arise over water rights.Peltric sets are also used to generate hydroelectricity.These are small units of verticallymounted impulse turbines coupled with inductiongenerators that generate small amounts of power(less than 5 kW) and are suitable for providingelectricity to a few households.People in the hills of Nepal have traditionallyused river water to run water mills (ghattas) thatgenerate mechanical power used for agroprocessing.These water mills are typically of lessthan 1 kW output capacity. It is estimated that thereare over 25,000 ghattas in Nepal (MOPE 2003).Government agencies as well as severalnongovernment organizations and private agenciesare involved in improving these ghattas by replacingwooden water wheels with steel wheels and roundbuckets. Many of these improvements also includeelectricity generation during evening hours.BiogasBiogas, a methane-rich gas, is produced byanaerobic digestion of animal and human excreta.Livestock keeping is an important and integral part ofNepal’s rural livelihood and farming system.Significant amounts of biogas can be produced usingcattle and buffalo dung. The estimated potential forbiogas production in Nepal is around 1,200 millioncubic meters per year, which is equivalent to 29million GJ (WECS 1999). By 2004, more than 120,000plants had been installed in Nepal with support fromthe Biogas Support Program (BSP Nepal 2005).Various agencies such as NGOs are active in thepromotion of biogas plants.Biogas plants are particularly suitable in theTerai region where the climate is warm. As theyrequire animal dung, rural households with livestockare the potential users, however, the poorest of thepoor who have no livestock are unlikely to benefit.Biogas plants can also be attached to a toilet. Theoptimal temperature for biogas production is 35°Cthus the high altitude mountain regions and winterseason are unfavorable for gas production. It isestimated that a total of 1.9 million biogas plants canbe installed in Nepal of which 57% would be in theTerai, 37% in Hill, and 6% in Mountain regions (BSPNepal 2005). Special technical measures, such asheating the system by solar energy or biomass fuel,or using part of the gas produced for heating andusing enzymes to digest the waste at lowtemperatures, may allow operation of biogas plantsin colder conditions, but this will add to the cost andcomplicate operation and maintenance.SolarSolar energy has been used traditionally for dryingcrops, clothes, fuelwood, and others. Nepal hasabout 300 sunny days a year, and the averageinsolation lies between 4 and 5 kWh/m 2 /day (WECS1996; MOPE 2003). Nepal’s solar energy potential isestimated to be about 26 million MW (WECS 1996).There are basically two methods of utilizing solarenergy—solar thermal systems and solarphotovoltaic systems. Solar thermal systems usesolar radiation directly for heating, whereas solarphotovoltaic systems generate electricity from solarradiation. An estimated 20,000 solar water heatershave been installed in Nepal (REDP 2002, cited inMOPE 2003). Nepal TelecommunicationsCorporation has installed more than 6,000 units of 50W module solar photovoltaic systems; around 22,000household solar photovoltaic systems have beeninstalled, and the Nepal Electricity Authority hasinstalled three 30–50 kW capacity solar photovoltaicstations at Simikot, Gamgadi, and Tatopani (MOPE2003). The Mountains and Hills have a great solarenergy potential, accounting for almost 94% of thetotal solar energy output in Nepal.Solar home systems typically consist of a 32–36watt solar panel, lead acid battery, charge controller,and energy-efficient lights. This is generally sufficientto operate three lights for approximately 4 hours perday. The solar home system is particularly suitable forremote rural areas where there is no other means ofelectricity supply. They are less likely to be destroyedby the monsoon floods and affected by temperatureextremes.WindWind power development is still at an experimentalstage, and no effort has yet been made to harnesswind energy. Lack of wind data for proper72 Environment Assessment of Nepal : Emerging Issues and Challenges
Biogas Installation for a Rural HouseholdSNVChapter 6: Energy Resources73
assessment of wind energy and lack of technicalexpertise are the main obstacles to wind powerdevelopment in Nepal. Although sufficient wind dataare not available, a number of areas have constanthigh wind speed, such as several mountain ridges,the Mustang Valley, and the Khumbu region. Apotential of 200 MW wind power in a 12 km corridorfrom Kagbeni to Chusung could generate about 500gigawatt hour (GWh) (CBS 1998). Wind or wind/solarphotovoltaic hybrid systems using small wind turbinetechnology currently available in the internationalmarket may well be feasible in some areas of Nepal.The nature of wind patterns indicates that smallscale(1–50 kW) wind generators may be feasible inremote and isolated places (MOPE 2003).Energy and EnvironmentEnergy and environment are related in complexways. The production, distribution, and consumptionof energy have direct and indirect environmentalimplications. Some of the environmental issues areglobal, like the greenhouse effect and climatechange. However, Nepal’s contribution to globalenvironmental degradation is insignificant as Nepal’sper capita annual energy consumption is one of thelowest in the world. Most environmental concernsrelated to energy sources and uses in Nepal are,therefore, related to national and localconsequences.Biomass EnergyThe trend suggests that demand for biomass energyhas been rising and will continue to rise. Lowefficiency is a common feature in the traditionalresidential use of biomass energy. Environmentalproblems include the following.Indoor air pollution. Inefficient burning ofbiomass coupled with poor ventilation is theprinciple cause of poor indoor air quality in ruralNepal (MOPE 2003). Indoor air pollution hasdetrimental health implications (see Chapter 7).Pressure on forest. Fuelwood is the mainsource of energy in rural Nepal. This is puttingsignificant pressure on the forest resources, eventhough this may not be the primary cause ofdeforestation in the country. As the human andlivestock population continue to grow, demand forfirewood will rise in the absence of other appropriatealternatives.Impact on agriculture. As firewood becomesscarce, rural people are increasingly burningagricultural residues and cow or buffalo dung asdomestic cooking and heating fuel. People in thedensely populated Terai regions, and some mid-Hillsareas, particularly rely on these sources. In Nepal’straditional farming system, agricultural residues andanimal wastes are the main source of organic matterand nutrients for the soil. Burning these deprives thesoil of organic matter and essential nutrients,affecting crop yield.Fossil FuelsThe share of fossil fuels in Nepal’s overall energyconsumption is very small. However, consumptionhas been growing consistently (CBS 2004). Industriesand automobiles are the main consumers ofimported fossil fuels. Environmental concerns offossil fuel consumption relate to emission-related airpollution, which is becoming a sensitive issue inurban and industrial areas, and their peripheries.HydropowerHydropower is renewable clean energy. Therefore,environmental concerns of hydropower are relatedto development and production stages rather thanconsumption. The severity of these concernsdepends on the size, type, and location ofhydropower projects—the bigger the project, thegreater the environmental impacts. Reservoirprojects are likely to result in much higherenvironmental and social impacts than run-of-riverprojects. Many bigger hydropower projects aroundthe world have become environmentally and sociallycontentious and many have encounteredunanticipated difficulties in the course ofdevelopment or operation. For example, the Arun IIIhydropower project in Nepal has been droppedfollowing protracted environmental debate, and theKulekhani reservoir project encountered a heavysiltation problem that was unsuspected during itsplanning and design. The main environmentalconcerns related to bigger hydropower projectsinclude the following.Impacts downstream. Water diversion canresult in undesirable consequences downstream.These typically include, but are not limited to,depriving downstream users of water for irrigationand other traditional uses, degradation of waterquality, and reduction in flows harming riparianecosystems and aquatic life.Inundation. Inundation upstream of dams canresult in submergence of houses and settlements,fertile agricultural land, forest and other vegetation,and others.Displacement. People can be displaced asdirect or indirect consequences of a project, orlivelihoods can be affected due to degradation orloss of private land and properties, resources, andlocal infrastructure and amenities. Quite often poor74 Environment Assessment of Nepal : Emerging Issues and Challenges
Figure 6.1: Power Development Map of Nepal: Major Power Stations, Transmission lines, and SubstationsSource: NEA (2005)and marginal people are the worst affected. Most ofthe project beneficiaries live far from the project sitewhile the people living around the project areadversely affected.Physiographic risks. There is a high risk ofdamage to civil structures and plants by landslides asa result of the fragile physical setting of the<strong>Himalayan</strong> range and monsoon floods. Glacial lakeoutburst floods (GLOF) also pose a threat. These maynot only damage the project but can also sweepaway settlements, and destroy land and propertydownstream. The risk of reservoir siltation is alsovery high in the mountainous terrain of Nepal.Impact on migratory fish. Hydropower damscan act as barriers to migration of fish, and projectscan act as barriers to the movement of land animalsor adversely affect their habitat.It is now accepted that hydropower developmentneeds to consider environmental and socialconsequences, and environmental assessment isnow generally required to ensure this. Mitigation andcompensation measures are part of the environmentalassessment; measures such as compensationfor loss of property, ensuring minimumdownstream flow all the time, supporting thedevelopment of areas surrounding the project, andsocial upliftment programs in affected communitiesmay be necessary. People should not be worse offdue to a hydropower project, and project benefitsshould also go to those affected, adequatelycompensating the losses they incur.Alternative EnergyAlternative energy such as from micro-hydro, biogasplants, or solar sources—as well as use of moreefficient and environmentally sound technologies forbiomass energy—has a number of environmentaladvantages over other energy sources available inNepal.Micro-hydro is a clean local source of energysuitable for hilly rural areas in Nepal. For ruralcommunities, it can be an alternative to traditionalbiomass fuels and has a significant potential towardsreducing the demand for traditional fuels (firewood)as well as imported fuel (kerosene).Biogas is suitable for cooking and hence cansubstitute for firewood in rural areas, and reducepressure on the forest. The Biogas Support Programestimates that 119,693 operating biogas plants save239,386 tons of fuelwood, 3.83 million liters ofkerosene, and 203,478 tons of bio-compost fertilizerin a year (BSP 2005). These savings would result in apositive carbon dioxide balance as well as carbonabsorption. Use of biogas plants improves sanitaryand hygienic conditions at the household level. Theslurry produced by the biogas plants is rich innutrients and can be used as manure. As biogasreplaces firewood and kerosene, this helps improveChapter 6: Energy Resources75
Review of Dams and Development by the World Commission on DamsConflicts over dams have heightened in the last two decades due largely to the social and environmental impacts. Socialgroups bearing the social and environmental costs and risks of large dams, especially the poor and vulnerable and futuregenerations, are often not the same groups that receive the water and electricity services, nor the social and economicbenefits from these. The debate is also related to many competing uses and needs of water—there is increasing concernabout access, equity, and the response to growing needs. This could affect relations within and between nations; betweenrural and urban populations; between upstream and downstream interests; between agricultural, industrial and domesticsectors; and between human needs and the requirements of a healthy environment. These needs are intertwined. The debateabout dams is a debate about the very meaning, purpose, and pathways for achieving development. Having conducted anindependent, comprehensive, global review of dams and their contribution to development, the World Commission on Dams(WCD 2000) concluded the following:(i) Dams have made an important and significant contribution to human development, and the benefits derived fromthem have been considerable.(ii) In too many cases an unacceptable and often unnecessary price has been paid to secure those benefits, especiallyin social and environmental terms, by people displaced, by communities downstream, by taxpayers, and by thenatural environment.(iii) Lack of equity in the distribution of benefits has called into question the value of many dams in meeting water andenergy development needs when compared with alternatives.(iv Bringing to the table all those whose rights are involved and who bear the risks associated with different options forwater and energy resources development creates conditions for a positive resolution of competing interests andconflicts.(v) Negotiating outcomes will greatly improve the development effectiveness of water and energy projects by eliminatingunfavorable projects at an early stage, and by offering as a choice only those options that key stakeholders agreerepresent the best ones to meet the needs in question.The commission recommends that it is necessary to break through the traditional boundaries of thinking and enshrine fivecore values in water and energy development: equity, efficiency, participatory decision-making, sustainability, andaccountability. Decision-making needs to ensure: comprehensive approach to integrating social, environmental, and economicdimensions of development; greater levels of transparency and certainty for all involved; and increased levels of confidencein the ability of nations and communities to meet their future water and energy needs. The commission has proposed sevenstrategic priorities and related policy principles that water and energy resource projects should integrate in the planning andproject cycles.(i) Gaining public acceptance: Acceptance emerges from recognizing rights, addressing risks, and safeguarding theentitlements of all groups of affected people, particularly indigenous and tribal peoples, women, and other vulnerablegroups.(ii) Comprehensive options assessment: Alternatives to dams do often exist. The selection is based on a comprehensiveand participatory assessment of the full range of options, and assessing social and environmental aspects at parwith economic and financial factors.(iii) Addressing existing dams: Opportunities exist to optimize benefits from many existing dams, address outstandingsocial issues, and strengthen environmental mitigation and restoration measures.(iv) Sustaining rivers and livelihoods: Rivers, watersheds, and aquatic ecosystems are biological engines. Understanding,protecting, and restoring ecosystems at river basin level is essential to foster equitable human development and thewelfare of all species.(v) Recognising entitlements and sharing benefits: Joint negotiations with adversely affected people result in mutuallyagreed and legally enforceable mitigation and development provisions.(vi) Ensuring compliance: Ensuring public trust and confidence requires that the governments, developers, regulators,and operators meet all commitments made for the planning, implementation, and operation of dams.(vii) Sharing rivers for peace, development, and security: Storage and diversion of water of transboundary rivers has beena source of considerable tension between countries and within countries. Dams require constructive cooperation.76 Environment Assessment of Nepal : Emerging Issues and Challenges
indoor air quality, with a positive impact on humanhealth.Having micro-hydro or solar electricity isimportant for rural villagers. It provides light forstudents to study, and powers TVs and radios thatbring news and can be an important means of familyentertainment. Substituting traditional biomass fuelswith electricity has a number of advantages: (i)Improvement in indoor air quality by reducing oreliminating smoke, (ii) Reducing pressure on forestand saving time spent collecting firewood, and (iii)Electric light allows household families additionalworking time.Where electricity and biogas are not practical,technologies such as improved cooking stoves canbe promoted in rural areas. This will not onlyincrease efficiency and reduce firewood consumption,but also reduce indoor air pollution and lead topositive health impacts.Energy Policy and PlanThe Tenth Plan (2002–2007), HydropowerDevelopment Policy 2001, Renewable EnergyPerspective Plan of Nepal 2000–2020, PerspectiveEnergy Plan 1991–2017, Water Resources Act 1992,and Electricity Act 1992 are the main policy, planning,and legislative documents guiding the energy sectorin Nepal. These policies aim to attract local andforeign private developers to the hydropower sector.The Tenth Plan (NPC 2002) emphasizes ruralelectrification and has a target to increase nationalelectricity coverage from 40% to 55% over the planperiod. The major strategies to be followed arepromoting private sector participation, institutionalreforms, establishment of a Power DevelopmentFund, initiating an explicit subsidy policy for gridbasedrural electrification, and creation of anindependent regulatory body in the power sector.The highlights are summarized below.(i) No license is required to generatehydropower up to 1 MW capacity, butprojects must be registered with the DistrictWater Resources Committee, and theDepartment of Electricity Development hasto be informed.(ii) A 35-year license will be provided forhydropower production for domesticconsumption; 30 years for export.(iii) Royalty rates will be based on projectcapacity and be higher for export-orientedprojects than for domestic uses.(iv) Institutional reforms will allow operating thegeneration, transmission, and distributionsystems separately through autonomouspublic institutions, local bodies, and theprivate sector.(v) A rural electrification fund to promote anddevelop rural electrification will beestablished, using a portion of royaltiesreceived from hydropower projects.(vi) Various subsidy and incentive schemes willbe established for alternative energydevelopment, including micro-hydro, biogasplants, and solar-based electricity.The Way ForwardEnergy affects livelihood, wellbeing, and developmentin multiple ways. As population increases andthe economy expands, people need energy inincreasing amounts. How the present and futureenergy needs are met affects not only theenvironment but also overall development. Energypolicy and strategy are linked with sustainabledevelopment approaches and environmentalstrategies.The industrial world has already shown that itstraditional mode of industrial development andenergy consumption is not sustainable. Indiscriminateuse of fossil fuel is leading to globalenvironmental threats such as global warming andclimate change. Industrialized nations need tochange current practices to those using energy fromcleaner and sustainable sources, and moreefficiently than in the past. This shift will be difficult,costly, and painful for them as their currentindustries, economies, and lifestyle depend heavilyon the use of fossil fuels.Nepal is at a low level of industrialization. Thisprovides an opportunity to learn from the alreadyindustrialized countries and to pursue a path thatutilizes cleaner energy in an efficient manner. Thisshould not be as difficult for Nepal as it would be foralready industrialized countries, as Nepal does notneed to shift from an already existing system to anew one, but to choose a more sustainable andbenign path. Nepal therefore needs to pursue anenergy policy and strategy that can supply energy forpresent and future use from sources that aredependable, affordable, safe, and environmentallysound. Nepal’s energy development should thereforebe guided by the following three basic principles.Self-reliance in Energy and Promotion ofIndigenous Renewable SourcesA massive promotion of indigenous renewableenergy sources will be necessary. Nepal’s indigenousenergy resources—hydro, biomass, solar, andwind—are renewable, and their combined potentialexceeds current demand as well as demand for theforeseeable future. In theory, therefore, energyshortages should not be a problem for Nepal, andChapter 6: Energy Resources77
IUCNElizabeth Khaka, UNEP-NairobiRural energy past and future: clockwise from top-collecting firewood for cooking (top); a simple peltric set canprovide electricity for lighting in remote villages; improved cooking stoves reduce firewood useA. Beatrice Murray78 Environment Assessment of Nepal : Emerging Issues and Challenges
enewable energy sources could contributesubstantially to self-sufficiency. In reality, however,Nepal has not been able to harness its indigenoussources adequately and cost-effectively with twoundesirable results—the energy available in themarket is costly, and rural and poor people continueto depend on traditional biomass sources.Relying more on indigenous renewable energysources has a number of advantages. In addition toenvironmental benefits, such sources are lesssusceptible than imported fossil fuels to pricefluctuations and foreign exchange rates, and theiruse means minimizing the risk of supply interruptiondue to external factors. But their development anduse are constrained by the lack of national priority aswell as inadequate national capacity in terms offinance, technologies, and institutions. Renewableenergy sources (hydro, biomass, solar, and wind)require a much higher priority in national energyprograms.Having an Appropriate Mix of EnergySourcesEach energy source has desirable and undesirableenvironmental, economic, technical, and socialdimensions. No single source is likely to satisfy alltypes of energy needs for all groups of users at alllocations. Therefore, dependence on one sourcealone is not sustainable in the long run. Energyneeds, availability, and costs can change over time.The long-term strategy, therefore, should encouragea suitable mix of sources, including hydropower,improved biomass use, solar, and other sources, thatsatisfies current and emerging demand and includesthe necessary flexibility to respond to changingcontexts. The energy mix desirable today couldchange over time with changing needs and advancesin technology.Reducing Consumption throughIncreasing EfficiencyCurrent energy consumption in Nepal is heavilydependant on biomass. Two issues related to this arefirst that biomass is used in a wasteful and inefficientmanner that affects the health of consumers, andsecond, that although biomass is a renewablesource, its supply is limited and cannot continue tomeet growing demand without adverse impacts onthe environment, economy, and health. Theconsumption and demand of non-biomass,commercial energy such as electricity and petroleumhave been gradually increasing and this has beenmet by a corresponding increase in supplies, butefficiency in end-use has hardly receivedconsideration.Efficient use of energy is probably moreimportant in the long run than increasing supplies.Promotion of energy efficiency in the production,supply, and consumption stages will not only reduceor check increases in demand, but will also havepositive impacts on environment and health. Energyefficiency should be an integral part of nationalenergy development and environmental policies.One constraint to promoting energy saving andefficient use is the cost of energy conservationtechnologies and end-use devices that, mostcommonly, have to be imported. Investment inenergy conservation and improved technologies andmeasures can save money over time because therewill be reductions in the investment to increasesupply. Improving efficiency can be less costly thaninvesting in new projects to supply increasing energydemand.Many energy efficiency measures, however,may cost little or nothing to implement—quite oftenenergy can be saved simply by demand-sidemanagement. For example, differential pricing foruse of electricity during peak and off-peak hours orduring the monsoon when hydropower supply isgreatest and winter when it is limited can promotemore rational consumption behavior. Improvedcooking stoves can substantially reduce fuelwoodconsumption in rural areas in addition to theirbenefiting health. These principles, however, shouldbe applied in such a way as not to impededevelopment.Constraints. Pursuing the sustainable andenvironmentally sound energy path that enshrinesthese principles is not easy in the present nationaland global economic structure. This will requireclarity as to how such an energy policy can be linkedwith sustainable development. For example,transport and industry are important for nationaldevelopment and are the major consumers ofpetroleum and coal, which are not only imported butalso environmentally undesirable. With the rightpolicy, transport can be promoted in a way thatconsumes energy from indigenous renewablesources like hydroelectricity.Availability of funds and national willpower toimplement the policy is another basic requirement.Most of the technologies will have to be purchasedfrom more developed countries, which will be amajor constraint for a country like Nepal. Initially,foreign assistance may be mobilized. Buildingnational capacity in renewable energy technologiesand manufacturing energy-efficient devices shouldbe at the top of the energy development agenda.Energy price. Price at the consumption point isprobably the most important factor influencingenergy consumption behavior. Pricing policy shouldChapter 6: Energy Resources79
therefore reflect the three guiding principlesdiscussed above: (i) Promotion of indigenousrenewable energy sources, (ii) Appropriate mixes ofenergy sources, and (iii) Increasing efficiency. A welldevisedsystem of subsidies, taxes, levies, andincentives is necessary for this to be realized. Theyshould favor efficiency measures as well asenvironmentally sound energy production—pricingof energy could utilize the “polluter pays” principleand reflect external damage costs to health, property,and the environment. The demand for importedfossil fuels could be lowered through levies andchanges in energy subsidies, energy efficiency inindustries could be promoted through tax rebates foradopting energy-efficient technologies, and so on.Energy should be available to all users at anaffordable price. Scarcity of money is the immediateproblem for the poor and this is frequently a greaterconcern for them than the shortage of energy, so costis a major barrier to adoption of energy-efficientdevices by the poor. The poor are forced to useinefficient end-use devices and fuels that areavailable free or cheaply because they lack money topurchase better choices, although at the end of theday, if all the direct and indirect costs are accountedfor properly, they may be paying more per unit ofdelivered energy-services.BibliographyBasnyat, M.B. 2004. “Rural Electrification ThroughRenewable Energy in Nepal.” World Review ofScience, Technology and Sustainable Development,1(1): 74–80. Available: http://www.inderscience.com/search/index.php?action=record&rec_id=4857&prevQuery=&ps=10&m=orBhattarai, L.N. 2005. “Chilime Hydroelectric Project: AnInitiative of Nepalese Expertise and NationalResources.” The Water Resources Magazine, Vol. 1,pp 56–68. Kathmandu: M.Sc. Water ResourcesEngineering Program, Tribhuban University Instituteof Engineering.Biogas Support Programme (BSP). 2005. “Biogas Nepal2004.” Lalitpur, Nepal.Bluden, J., and A. Reddish. 1991. Energy, Resources andEnvironment. United Kingdom. Hodder andStoughton.Central Bureau of Statistics (CBS). 1998. A Compendium onEnvironment Statistics 1998. Kathmandu.———.2002. A Hand<strong>book</strong> of Environment Statistics, Nepal2002. Kathmandu.———. 2004. Hand<strong>book</strong> of Environment Statistics 2003.Kathmandu.Gubhaju, S.R. 1994. Impact of Damming on the AquaticFauna in Nepalese Rivers: Cold Water Fisheries inthe Trans-<strong>Himalayan</strong> Countries. Available:http://www.fao.org/DOCREP/005/Y3994E/Y3994E00.HTMInternational Bank for Reconstruction and Development(IBRD) and World Bank. 2004. The Little GREEN DataBook 2004, World Development Indicators 2004.Washington, DC: World Bank.Ministry of Finance (MOF). 2003. Economic Survey(FY2002/2003). Kathmandu.Ministry of Population and Environment (MOPE). 2003.State of the Environment (Rural Energy).Kathmandu. Available: http://www.mope.gov.np/environment/state.phpNational Planning Commission (NPC). 2002. Tenth Plan(2002–2007). Kathmandu.National Planning Commission (NPC) and Ministry ofPopulation and Environment (MOPE). 2003.Sustainable Development Agenda for Nepal.Kathmandu.National Planning Commission (NPC) and United NationsDevelopment Programme (UNDP). undated.“Sectoral Reports for the Sustainable DevelopmentAgenda for Nepal,” Draft reports, National PlanningCommission, and United Nations DevelopmentProgramme, Kathmandu. Available:http://www.scdp.org.np/sdan/Nepal Electricity Authority (NEA). 2003. Nepal ElectricityAuthority, Fiscal Year 2002/2003—A Year in Review.Kathmandu.———.2005. Nepal Electricity Authority, Fiscal Year2004/2005—A Year in Review. Kathmandu.Nepal, G. 2005. “A Study on Analysis of Rural EnergyProgrammes With Respect to Their Linkages WithPoverty Alleviation.” Unpublished report prepared forAlternative Energy Promotion Center, Energy SectorAssistance Programme, Kathmandu.United States Agency for International Development(USAID)/South Asia Regional Initiative (SARI). 2002.Regional Hydropower Resources: Status ofDevelopment and Barriers—Nepal. Kathmandu:Nexant SARI/Energy.World Commission on Dams (WCD). 2000. Dams andDevelopment: A New Framework for Decision-Making. London: Earthscan. Available:http://www.dams.org/report/———.2001. Follow up on Final Report. Available:http://www.dams.org/report/followups.htm———.1996. Energy Synopsis Report: Nepal 1994/1995.Kathmandu.———.2002. Water Resources Strategy Nepal. Kathmandu.———.2004. National Water Plan (2002–2027).Kathmandu.80 Environment Assessment of Nepal : Emerging Issues and Challenges
Chapter 7Air Pollution and ClimateChangeIntroductionPeople can live without food and water for days,but cannot survive without air for even a fewmoments. An average person needs 13.5 kg ofair every day. Dry air has concentrations of certaingases that are naturally present in the atmosphere.Any disturbance to the balance of the naturalcomposition of air that has an adverse effect onpeople or the environment can be termed airpollution.In pursuit of rapid economic development,many developing countries are confronted withenvironmental problems due to increasing airpollution resulting from industrialization, urbanization,and motorization. Worldwide, the World HealthOrganization (WHO) estimates that as many as 1.4billion urban residents breathe air with pollutantconcentrations exceeding the WHO air guidelinevalues (WRI 1998). Although the causes andconsequences of air pollution are often localized,transboundary movement of air pollutants hasregional as well as global implications. Aciddeposition, global climate change, and stratosphericozone depletion are among the emerging issues thattranscend political boundaries. Air pollution can bean ongoing feature, but can also present in acute,sometimes catastrophic, episodes. Table 7.1 showssome major air pollution disasters that haveoccurred during the last century.Usually air pollution is differentiated into threebroad categories: ambient, indoor, and transboundary.Ambient air refers to the air close to the groundthat is in direct contact with the living world; indoorair pollution refers specifically to air within buildings,whether at the workplace or in the home; andtransboundary air pollution is used to refer topollutants that have entered the upper atmosphereand travel far from their source.Air pollution of all three types is strongly affectedby climate—precipitation, wind, temperature,radiation—and thus by changes in climate or“climate change”. At the same time, air pollution isthought to be one of the major contributors to thepresent situation of “climate change”This chapter deals with air pollution, its status,sources, and impacts, together with the context ofthe climate in Nepal and possible effects of climatechange.Status and Trends of Ambient AirPollution in NepalAmbient air pollution may derive from both naturaland anthropogenic sources. A typical natural processTable 7.1: Catastrophic Air Pollution EpisodesYearLocation1930 Meuse Valley,Belgium1948 Donora,PennsylvaniaDeaths and/orInjuries63 deaths600 sick20 deaths6,000 sickCausePollutants released by coke ovens, steel mills, blast furnaces , zinc smelters, glassfactories, and sulfuric acid plan ts were trapped in the valley.Effluents from industries like a sulfuric acid plant, steel mill, and zinc productionplant, became trapped in a valley by a temperature inversion and produced anunbreathable m ixture of fog and pollution (smog).1952 London, England 4,000 deaths “The London Fog” , daily temperatures below average, and industrial pollutantscombined with condensation in the air to form a dense fog. Concentrations ofpollutants reached very high levels causing suffocation and death.1984 Bhopal, India 20,000 deaths120,000 injuredSource: Compiled from various sources by MENRIS staffGas leakage from the Union Carbide pesticide plant caused a toxic cloud to driftover the city.Chapter 7: Air Pollution and Climate Change81
is a seasonal dust storm. Anthropogenic activitieshave been largely responsible for changing the airquality in urban areas. The major sources of suchpollution in Nepal are vehicle and industrialemissions, and combustion of biomass and fossilfuels. Anthropogenic activities have added largeamounts of macro and micro-pollutants to theatmosphere, triggering an environmental problem.Exposure to air pollution has become aninescapable part of urban life. Millions of people inurban centers are confronted with environmentaland health problems owing to harmful emissionscaused mainly by motor vehicles. Given the rate atwhich cities are growing and the paucity of pollutioncontrol measures, air quality will continue todeteriorate.Many studies over the last decade(MOPE/UNEP/ICIMOD 2000; CBS 1994; MOPE 1998;Pokharel 1998; Kunwar 1999; NESS 1999) haveshown that ambient air in the Kathmandu Valley isheavily polluted and not in accordance withinternational standards, and that the air quality isdeteriorating. This development has mainly beendue to a rapid rise in the number of petrol and dieselvehicles plying the streets. At the same time,continued emissions from the many brick kilns, thedyeing industry, and other industries are alsoimportant contributors.Until recently, monitoring in Kathmandu Valleywas sporadic, and it was rare to have continuousseries of 24 hour per day measurements. Realizingthe need for continuous air quality monitoring, theGovernment and the Danish InternationalDevelopment Agency (DANIDA) agreed in March2001 to formally initiate air quality management ofKathmandu Valley as the fifth component of theEnvironment Sector Programme Support (ESPS).Monitoring stations are strategically located at sixplaces in the Valley (Figure 7.1). The pollutantsmeasured are total suspended particles (TSP) andparticulate matter of 10 micrometers (μm) or less indiameter (PM10). Currently, PM2.5 (at some stationsonly), nitrogen dioxide (NO 2 ), and benzene are alsomonitored on a regular basis. Analysis of the ESPSdata (MOPE 2004) indicates that the major problemis a high level of suspended particulate mattertogether with increasing levels of NO 2 and sulfurdioxide (SO 2 ).Figure 7.1: Environment Sector Program Support (ESPS) Monitoring Stations1. Putalisadak (Urban Traffic); 2. Thamel (Urban Traffic, Residential); 3. Patan (Urban Traffic); 4. Bhaktapur (Urban Background); 5. Kirtipur(Urban Background); 6. Matsyagoan (Valley Background)Source: MOEST (undated)82 Environment Assessment of Nepal : Emerging Issues and Challenges
Particulate MatterParticulate matter is the general term used for themixture of solid particles and liquid dropletssuspended in the air. These particles originate fromstationary and mobile anthropogenic sources as wellas from natural sources. Particulate matter is dividedinto two classes, primary and secondary. Primaryparticles are released directly into the atmosphere.Secondary particles are formed in the atmosphere asa result of reactions that involve gases.Particulate matter is a serious problem inKathmandu Valley. From a diesel vehicle’s black puffof smoke to the haze that obscures the view of thebeautiful Himalayas, particle pollution affects allresidents. The complex pollution is present yearround, causing health problems to the city dwellers.These particles come in many shapes and sizes andcan be made up of hundreds of different chemicals.Some particles such as dust, dirt, and soot are largeenough to be seen with the naked eye.Particulate matter is generally classifiedaccording to size. Inhalable PM10 is the portion of thetotal air particulate matter that is 10 μm or less indiameter. Most particles with diameters greater than10 μm will be caught in the nose and throat, neverreaching the lungs. Particles between 2.5 and 10 μmwill be caught by cilia lining the walls of the bronchialtubes; the cilia move the particles up and out of thelungs. Respirable particles (PM2.5) are 2.5 μm orsmaller in diameter and can penetrate deeper intothe air sacs.According to the measurements done by ESPS(MOPE 2003), the average PM10 value lies between30 and 295 micrograms per cubic meter (μg/m 3 ) inthe core areas and 23 and 130 μg/m 3 in the sub-coreand outskirts of the valley. During the dry winterperiods, the PM10 values shoot up, while in the rainyseason pollutants are washed from the air thustending to lower airborne pollution (Figures 7.2 and7.3). Apart from this seasonal variation, pollutionFigure 7.2: Concentration of PM2.5 and PM10 inKathmandu (2003/04)PM2.5 = particulate matter of diameter 2.5 microns or lessPM10 = particulate matter of diameter 10 microns or lessData source: MOPE (2004)Chapter 7: Air Pollution and Climate Changelevels peak at places where traffic density is high.Measurements for PM2.5 in Bhaktapur showed thatmore than 60% of PM10 is PM2.5 (Figure 7.2). Thisfurther indicates the health threat.Nitrogen Dioxide and Sulfur DioxideNitrogen oxides (NO x ) form when fuel is burned athigh temperatures, as in a combustion process. Theprimary man-made sources of NO x are motorvehicles, electric utilities, and other industrial,commercial, and residential sources that burn fuels.Sulfur gases can be formed when fuel containingsulfur, such as coal and oil, is burned; when gasolineis refined from oil; or metals are extracted from ore.SO 2 dissolves in water vapor to form acid, andinteracts with other gases and particles in the air toform sulfates and other products that can harmpeople and the environment. The pollutants formedfrom SO 2 and NO 2 can be transported over longdistances and deposited far from their point of origin.Regular monitoring of NO 2 by passive samplershas been conducted by the ESPS project since 2004(Figure 7.4). Prior to this, only sporadicmeasurements were done by various organizations.Devkota in 1993 measured a 24-hour NO 2concentration of <strong>18</strong> μg/m 3 for a regional backgroundsite in Kirtipur with the highest concentration (38μg/m 3 ) being recorded at the Himal CementCompany site (Devkota 1993). The Society for Legaland Environmental Analysis and DevelopmentResearch (LEADERS Nepal) measured 24-houraverage NO 2 concentrations in different locationswithin the Valley in June 1998 and found they variedfrom 0.02 parts per million (ppm) to 0.04 ppm withan average of 0.027 ppm (LEADERS 1999). Theresults from ESPS show that though the values are allbelow the WHO guidelines, there is an increasingtrend for NO 2 . The NO 2 also peaks during the dryseason and where the traffic density is high.Monitoring of SO 2 was done for 3 months (Novemberand December 2003 and January 2004). The highestvalue was recorded in Bhaktapur (70 μg/m 3 ), wheremost of the brick kilns are located (Figure 7.5).Appendix 7.1 summarizes the WHO guideline values.OthersIn 1993, the Environment and Public HealthOrganization (ENPHO) measured the average 24-hour lead concentration in the Valley and found anaverage value of 0.32 μg/m 3 , with a range from 0.<strong>18</strong>μg/m 3 to 0.53 μg/m 3 (ENPHO 1993). Due to the phaseoutof leaded gasoline it was assumed that the leadconcentration would decrease. Since 26 December1999, only unleaded gasoline has been distributed inNepal. However, a recent study (Chhetri et al.83
Figure 7.3: Average Air Quality, January to December 2003Source: Data MOPE (2003); basemap:ICIMOD (1996)Figure 7.4: NO 2 values in the Kathmandu ValleyFigure 7.5: SO 2 values at different sites in Kathmanduμg/m 3 = microgram per cubic meter, NO 2 = nitrogen dioxideData source: MOPE (2004)μg/m 3 = microgram per cubic meter, SO 2 = Sulfur dioxideData source: MOPE (2004)84 Environment Assessment of Nepal : Emerging Issues and Challenges
undated) revealed that lead is still present inKathmandu’s air despite the introduction ofunleaded petrol. Lichens were transplanted tovarious places in Kathmandu to act as bioindicators.The highest concentrations of lead were found indense traffic areas like Tripureshwor, Ratnapark,Bhadrakali, Gaushala, and Kalanki. Theconcentration of lead in transplanted lichen speciesranged from 20 to 27 mg/kg.The threat of benzene is now of concern alsosince the replacement of leaded petrol. Benzene isused in gasoline instead of lead to boost the octane.The octane number, which measures the anti-knockcharacteristics of fuel, is an important performancecriterion for fuel. Internationally, most countries haveensured that there should be minimum levels ofbenzene in gasoline, generally less than 1%.However, fuel quality data from Nepal Oil Corporationshow levels as high as 3–5% benzene found ingasoline samples in Nepal.A three-week study conducted by the ESPS andthe then Ministry of Population and Environment(MOPE) during January and February 2002 at sevenlocations in Kathmandu found weekly averages ofambient benzene concentrations as high as 77 μg/m 3in Putalisadak, known as a high traffic area, but verylow concentrations at Matsyagaon, a village locatedat the edge of the south-eastern part of KathmanduValley, about 150m above the valley floor (Figure 7.6).Other high traffic zones at Chabahil, Paknajol, andPatan had values of 44 μg/m 3 , 30.3 μg/m 3 , and 23.3μg/m 3 , respectively.In November 2003, Bossi collected two samplesof total PAH (polyaromatic hydrocarbons) from fivedifferent monitoring stations in Kathmandu andanalyzed them in Denmark. Total PAH is the sum ofall PAHs analyzed, which in this case includedacenaphthene, fluorine, phenanthrene, fluoranthene,anthracene, 2-methylphenathrene, chrysene,benz(a)anthracene, benzo(a)fluoranthene, pyrene,Figure 7.6: Benzene Concentration in Kathmandu Valleybenzo(a)pyrene, benzo(e) pyrene, pyrylene,indeno(1,2,3-cd) pyrene, benzo(ghi)perylene anddibenzo(a,h)anthracene). The samples taken fromsites at Patan Hospital, Putalisadak, Thamel, andBhaktapur had PAH concentrations of 2.32, 3.16, 3.23,and 4.30 μg/m 3 respectively—three times higher thanthe European Union recommended level (1 μg/m 3 ).The only place where the concentration was belowthis level was in Matsyagaon.Bossi also measured PAH levels on September<strong>18</strong>, 2003, which was a Nepal Bandh (enforcedclosure or “strike”) day when there were very fewvehicles on the streets. The level of PAH was aboutone-fifth of the level recorded during a normalweekday in November (Figure 7.7). This indicatesclearly that vehicles are the main source of thepollution.As a result of the high concentration of benzenein petrol, the ambient concentration of benzene inKathmandu’s air is at dangerous levels. Benzene, aknown carcinogen, causes leukemia among others.Therefore in the interest of the health ofKathmandu’s residents it has become urgent toaddress the problem of benzene in air.Indoor Air QualityThe use of biomass fuels such as wood, dung,agricultural waste, and charcoal as cooking andheating fuel is the principle cause of indoor airpollution in the rural areas of Nepal. Poverty is one ofthe main barriers to the adoption of cleaner fuels,and the slow pace of development implies thatbiofuels will continue to be used by the poor. Limitedventilation increases exposure in poor households,particularly for women and young children as theyspend long periods of time indoors.The smoke from biomass fuels is a complexmixture of aerosols containing significant amounts ofcarbon monoxide (CO), suspended particulateFigure 7.7: Polyaromatic Hydrocarbons (PAH) Levelμg/m 3 = microgram per cubic meterSource: MOPE (2004)μg/m 3 = microgram per cubic meterSource: MOEST (undated)Chapter 7: Air Pollution and Climate Change85
matter, hydrocarbons, and NO x (Naeher et al. 2005).Exposure to indoor air pollution carries severe healththreats. Exposure to the smoke from a day’s cookingis equivalent to smoking two packets of cigarettes(Warwick et al. 2004), directly affecting lungs andchest and posing risks for chronic respiratorydisorders, acute respiratory infections (ARI),including pneumonia and bronchitis, chronicobstructive pulmonary disease (COPD), lung cancer,and other problems.Pandey et al. (1987) identified the highest ratesof chronic bronchitis in Jumla. After many years ofstudy, the Nepal Health Research Council (NHRC2004) found that the prevalence of ARI amongchildren aged below 5 was 38% (11 of 29 examined).Comparing ARI by binary fuel types, children withunprocessed fuel in the kitchen had a higherprevalence (59%, 10 of 17) as compared withchildren with processed fuel in the kitchen (33%, 1 of3). Bates et al. (2005) confirmed that the use of solidfuel in unflued indoor stoves is associated with anincreased risk of cataracts in women, who do thecooking. According to a comparative studyconducted by Reid et al. (1986) also cited by Raut(undated), the mean personal exposure to TSP intraditional (agena) cooking stoves and improvedstoves is 3.92 and 1.13 mg/m 3 , respectively. Similarly,mean personal exposure to CO in traditional stovesand improved stoves was found to be 380 and 67ppm, respectively. This implies that improvedcooking stoves reduce indoor TSP concentration byaround 70% and CO concentration by 80% comparedwith traditional stoves. Lack of awareness,willingness to invest, and ability to pay for the newtechnology are issues preventing a switch to thiscleaner technology.The World Summit on Sustainable Developmentin Johannesburg acknowledged that the viciouscycle of energy and poverty needs to be broken toachieve the Millennium Development Goals forreducing world poverty. A lack of access to clean andaffordable energy can, and should, be considered acore dimension of poverty.Improvements in stoves and fuels, along withbetter-ventilated rooms, are the main tools forcontrolling the problem of indoor air pollution.Transboundary Air PollutionTransboundary air pollution refers to cross-boundarypollutants generated in one country and felt inothers. Such pollution can survive for days or evenyears and can be transported hundreds or thousandsof miles before affecting the air, soils, rivers, lakes,and food at the distant site. Transboundary airpollutants cause a number of different problems,e.g., formation of ground level ozone that ishazardous to health, formation of acid rain that candamage buildings and sensitive ecosystems, andother effects that are toxic to human health and theenvironment.The main sources of this pollution are emissionsof SO 2 , NO x , volatile organic compounds, and varioustoxic materials such as heavy metals and persistentorganic pollutants from transport and energy usage.The main effects are acidification of water and soil,summer smog caused by tropospheric ozone, andeutrophication of soils and waters. SO 2 , NO x , and NH 3cause acidification and eutrophication. Volatileorganic compounds and NO x deplete ozone, andheavy metals and persistent organic pollutantscontribute to bioaccumulation of toxic substances.The major weather patterns in Asia areconducive to transboundary transport of airV. RamanathanWoman with Baby CookingR. ShresthaHaze – Haze over Phaplu: both photographs taken from the samelocation, one viewing north (top) and the other south (bottom), froma flight altitude of about 3 km above the ground in March 2001.During the dry season, the brown sky seen over Nepal is typical ofmany areas of South Asia.86 Environment Assessment of Nepal : Emerging Issues and Challenges
pollutants from land to sea and the reverse insummer (UNEP 2002) Pollutants can thus be carriedfrom country to country in the region and collectivecooperation and effort are required. The MaléDeclaration on Control and Prevention of AirPollution and its likely Transboundary Effects forSouth Asia, and the Atmospheric Brown CloudProject are examples of regional cooperation inaddressing these problems.Studies carried out in Nepal are at too early astage for any conclusive results. However, a lightdetection and ranging (LIDAR) observation fromFebruary 2003 showed long-range transport ofpollution (Figure 7.8). The layer at 2600 meters aboveground level is most likely due to dry convectiveFigure 7.8: LIDAR ObservationSource: Ramana et al. (2004)lifting of pollutants at distant sources and subsequenthorizontal upper air long-range transport (Ramana etal. 2004).Sources of EmissionsTransportationNepal’s transport sector is dominated by roadtransportation due to the country’s land-lockedgeographical position. Apart from roads, air transportis the only modern form of transportation. Airplanesreach many remote destinations in the kingdomwhere roads do not or only barely exist. High currentsand high slopes make water transportationimpossible along the rivers. The only train track is a52 km stretch from the border with India.Much of the urban air pollution in Nepal,particularly in Kathmandu Valley, is caused byvehicular emissions. The problem is magnified by thenarrow streets, poor traffic management, poorvehicle maintenance, and the use of adulterated,substandard fuel (Joshi 1993).There were 4<strong>18</strong>,910 transport vehiclesregistered in Nepal in March 2004 (Figure 7.9), anincrease of 6.7% within the preceding eight-monthperiod. Of these, 249,282 vehicles were registered inthe Bagmati zone, an 11.2% increase from theprevious year. The total road length in March 2004was 16,042 km, giving an average of 26 vehicles perSuccess of Safa TemposKathmandu suffers from severe air pollution due to vehicle emissionsand is ideal for the introduction of zero emission electrical vehicles.With a population of approximately 1.5 million people, the city occupiesan area roughly 12 km wide. Thus, distances traveled are quite short.Speeds seldom exceed 40 km per hour and are generally below 30 km.The Global Resources Institute initiated the first phase of an electricvehicle program for Kathmandu in September 1993 with the conversionof a diesel three-wheeler to electric power. Following extensive tests onthe initial vehicle to optimize the drive system, seven new three-wheelerswere built and the first converted vehicle was retrofitted with the newdrive system. In August 1995, these eight vehicles were placed intoservice as a six-month demonstration project with a company providing public transportation. On February 20, 1996,these electric “tempos” — Safa tempos—were passed from the Institute to the owners of the Nepal Electric VehicleIndustry. Two other private companies have also been registered to operate electric public transportation networks.Since mid-September 1999, 3-wheeler diesel tempos, popularly known as Vikram tempos, have been banned inthe Valley. In their place, the Government made provisions to import petrol microbuses that meet Euro-1 standards. Newregistration of 3-wheeler diesel tempos was also banned. This decision dramatically increased the fleet of battery chargedand liquefied petroleum gas (LPG) 3-wheelers to fill the gap in meeting the public transport demand. Further, theGovernment reduced import duties on components for local assembly of electric three-wheelers from 60% to 5% and onfully assembled electric vehicles of all types from 150% to 10%.At present (early 2005) there are 450 Safa tempos in operation. Public response has been overwhelminglyfavorable, the only criticism being the rise in the electricity tariff, which will eventually add to the cost of the batteryrecharge.Source: Roy et al. (2001) and DOTM (2005)Chapter 7: Air Pollution and Climate Change87
Figure: 7.9: Vehicle Registered in Nepal300,000250,000200,000Number150,000100,00050,0000Source: DOTM (2005)1989/901990/911991/921992/931993/941994/951995/961996/97YearBusCrain/Dozer/Truck Tipper/Damfar/TankerPickupTempoTractor1997/981998/991999/2000Mini BusCar/Jeep/VanMicroMotorcycleOthers2000/20012001/20022002/20032003/2004km of road in the country as a whole and 96 vehiclesper km of road in the Bagmati zone. Consumption ofpetrol has risen continuously since 1998 with thevehicle fleet increase, but the consumption of dieselhas fluctuated (Table 7.2). The estimatedconsumption figures for the Valley were 80% petroland 27% diesel. Shrestha and Malla (1996) showedthe total annual emission load from thetransportation sector at 12,422 tons—an updatedstudy would be extremely useful. The Valley isespecially vulnerable to air pollution due to its bowlshapedtopography.IndustryThe manufacturing sector is relatively small in Nepal.Its share in national gross domestic product (GDP) isonly 9.5% (CBS 2003). In the 2001/02 census (CBS2002), Nepal had 3,230 industries, of which 1,498were in the central development region and 846 inKathmandu Valley. An emission inventory wasconducted in the Kathmandu Valley in 1993(Shrestha and Malla 1996). At that time the industrialsector in the Valley emitted 3,574 tons of TSP, 5,220tons of CO, 1,492 tons of hydrocarbon, 628 tons ofNO x , and 1,349 tons of SO 2 per year.After closure of the Himal Cement Factory, amajor polluter, the brick industries located south ofthe Valley center are assumed to be the major airpolluting industries, particularly with respect to dustemission. There are about 125 brick kilns operatingin Kathmandu Valley, of which 113 are bull’s trenchtype, 9 are clamp kiln type, and 3 Hoffmann kilns. Asthe manufacturing process in bull’s trench andclamp kilns is very poor and inefficient, the amountof smoke emitted from these kilns is very high. Astudy carried out by Tuladhar and Raut (2002) nearthe vicinity of brick kilns (Tikathali villagedevelopment committee (VDC), Lalitpur) showedthat during the operation of the kilns the level ofpollution was three times higher than on other days(Figure 7.10). Thanks to a cleaner technologyinitiative from an ESPS project initiating use of a newtechnology, suspended particulate matter wasreduced to about 950 μg/m 3 from 2,000 μg/m 3 fromthe kiln. Brick production using the new technologyis costlier, as it requires a large initial investment.However, it is environmentally friendly. The mainadvantages in the new technology are energy costsavings and quality production, which eventuallypays for the initial investment by increasingproduction of grade “A” bricks to over 90% fromaround 40% with the older technology.HouseholdBiomass energy accounts for about 15% of theworld’s primary energy consumption, about 38% ofthe primary energy consumption in developingcountries, and more than 90% of the total ruralenergy supplies in developing countries where largequantities of biomass fuels are used for cooking88 Environment Assessment of Nepal : Emerging Issues and Challenges
Table 7.2: Consumption of Petroleum ProductsMain Item ofPetroleumUnit 1988/89 1989/90 1990/91 1991/91 1992/93 1993/94 1994/95 1995/96Petrol '000 liters 17,340 14,708 17,241 26,780 29,910 31,056 34,942 41,191Diesel '000 liters 75,356 103,273 106,438 166,552 179,900 196,047 227,226 250,504Kerosene '000 liters 63,246 92,672 75,939 122,458 149,237 162,077 <strong>18</strong>0,536 208,720Light Diesel Oil '000 liters 9,327 16,541 2,542 1,530 – 4,191 4,375Furnace Oil '000 liters – – – 11,062 20,222 27,319 31,567 <strong>18</strong>,449Air Fuel '000 liters – – – 24,836 29,210 30,250 37,536 40,621LPG million tons – – – – – – – <strong>18</strong>,400Main Item ofPetroleumUnit 1996/97 1997/98 1998/99 1999/00 2000/01 2001/02 2002/03 2003/04 aPetrol '000 liters 44,889 46,939 49,994 55,589 59,245 63,578 68,482 46,058Diesel '000 liters 257,235 300,604 315,780 310,561 326,060 287,657 301,672 <strong>18</strong>1,8<strong>18</strong>Kerosene '000 liters 243,005 282,026 294,982 331,120 316,381 390,113 351,696 208,033Light Diesel Oil '000 liters 2,017 967 547 4,005 3,4<strong>18</strong> 2,413 610 556Furnace Oil '000 liters 16,858 27,776 33,860 26,876 20,999 <strong>18</strong>,255 14,502 6,405Air Fuel '000 liters 47,688 51,412 55,549 56,849 63,130 47,274 53,546 44,653LPG million tons 21,824 22,361 25,019 30,627 40,102 48,757 56,079 43,871– = not available, LPG = liqu efied petroleum gasa First 9 m onths of the Nepali year, approximately <strong>April</strong> –December 2003 .Source: MOF (2004)Figure 7.10: Pollutants Monitored at TikathaliFigure: 7.11: Total Energy Consumption by ResidentialSectorSource: WECS (1999)μg/m 3 = microgram per cubic meterSource: Tuladhar and Raut (2002)(Bhattacharya undated). Deforestation anddesertification are the most serious consequences ofreliance on biomass fuels. Use of crop and animalresidues for fuel deprives the soil of recyclednutrients and reduces crop yields along with theland’s capacity to support livestock. Biomass fuelsare the most common fuels used in rural areas of theTerai and the Hills. Use of coal and kerosene in ruralareas is limited to relatively well-to-do families. Incities, liquefied petroleum gas is also usedextensively. Figure 7.11 shows the amount of energyconsumption by the residential sector by fuel type.There are no estimates of emissions fromdomestic fuel use available for the entire country,although a few research studies have beenconducted in Kathmandu Valley. Shrestha and Malla(1996) estimated that in 1993 14,246 tons of airpollutants were emitted each year from domesticsector energy use in Kathmandu Valley.Household equipment is also a source of aparticular group of “ozone depleting substances,”chemicals that enter the air, travel to the upperatmosphere, and are instrumental in destroying theupper level ozone layer that shields the earth fromharmful radiation. The people living in Nepal’s urbanareas are more used to modern amenities than thosein rural areas. More and more urban inhabitants areable to enjoy a comfortable life with modernamenities such as refrigerators and air conditioning.A survey carried out by the Nepal Bureau ofStandards and Metrology (NBSM 1999) identifiedchlorofluorocarbons (CFC-12) and hydro-Chapter 7: Air Pollution and Climate Change89
Brick Kilnchlorofluorocarbons (HCFC–22) as ozone depletingsubstances (ODS). The consumption of these twosubstances was 30 tons and 23 tons, respectively(NBSM and UNEP undated). The country does notproduce any ODS itself—all these substances areimported. The annual per capita ODS consumptionin Nepal in 1999 was 0.0013 kg. The regulatorymeasures developed to address the problem aredescribed in a later section.Natural Sources of Air PollutionNatural sources of air pollution include suchthings as volcanic eruption, forest fires, pollens fromvegetation, and salt particles from sea spray. Forestfires occur annually in all the major physiographicand climatic regions of Nepal, including the Terai andBhabar, the Siwaliks or the inner Terai, the MiddleMountains, and the High Mountains, althoughreliable statistics are not available. Pollen grains areanother natural contaminant associated with healthproblems such as allergies. Many people suffer fromasthma or hay fever although the symptomsdisappear at the end of the pollen season—someeven develop bronchitis, bronchial asthma, anddermatitis. Suspended dust from roads is also highlyvisible in Nepal, adding to the suspended particleload in the air.Impact of Air PollutionAlthough air pollution has become a visible environmentalproblem in the last decade, only limited dataare available to evaluate its magnitude and impact.The health impact of indoor and outdoor airpollution can be assessed by the increase in thenumber of patients suffering from diseases related toair pollution. Health effects range from minorirritation of eyes and the upper respiratory system tochronic respiratory disease, heart disease, lungcancer, and death. Air pollution has been shown toB.B. Pradhancause acute respiratory infections in children andchronic bronchitis in adults. It has also been shownto worsen the condition of people with pre-existingheart or lung disease. Among asthmatics, airpollution has been shown to aggravate the frequencyand severity of attacks. Both short-term and longtermexposures have also been linked to prematuremortality and reduced life expectancy (Mishra 2003).The health impact of air pollution depends onthe pollutant type, its concentration in the air, lengthof exposure, other pollutants in the air, and individualsusceptibility. Different people are affected by airpollution in different ways. Poor people,undernourished people, the very young and very old,and people with pre-existing respiratory disease andother ill health are more at risk (Mishra 2003).Exposure to particles can lead to a variety ofserious health problems. Fine particles pose thegreatest problems because they can get deep intothe lungs and some fine particles into thebloodstream. Long-term exposure to particulatematter shows decreased lung function, chronicbronchitis, premature deaths, and heart attacks. Nolong-term epidemiological studies have beenconducted in Nepal, but a few studies haveconducted preliminary medical examinations of agroup of exposed people or used dose-responserelationships developed elsewhere.According to the data published by the thenMinistry of Health (now Ministry of Health andPopulation), among patients visiting the majorhospital (DOHS 2003), ARI ranks as the third-highestcause of morbidity in Nepal after diarrhea, affecting3.13% of the total population (this document,Chapter 2, Table 2.<strong>18</strong>). Chronic bronchitis falls at theeighth position.Pandey et al. (1987) examined 240 rural childrenunder 2 years of age for 6 months and found asignificant relationship between the number of hoursspent near the fire (as reported by the mother) andthe incidence of moderate and severe cases of ARI.The study suggested that indoor air pollution is animportant risk factor for ARI. A 1971 review of thecases of discharges from ten hospitals with acombined capacity of 265 beds revealed that ARIaccounted for 32% of mortality for infants less than 1year and 11% for children aged 1–4 (WINROCK2004).COPD is another major risk, especially amongwomen, and has been strongly associated withsmoke exposure from cooking on open biomassstoves. In rural Nepal, nearly 15% of non-smokingwomen 20 years and older had chronic bronchitis(WINROCK 2004), a high rate for non-smokers.Similar cases are observed in the urban centerswhere outdoor air pollution is soaring. A study by the90 Environment Assessment of Nepal : Emerging Issues and Challenges
World Bank in 1990 estimated impacts on mortalityand morbidity due to PM10 levels. The study estimatedthat Kathmandu’s PM10 levels resulted in 84 casesof excess mortality, 506 cases of chronic bronchitis,4,847 cases of bronchitis in children, and <strong>18</strong>,863asthma attacks per year. Overall, Kathmandu’sresidents experienced over 1.5 million respiratorysymptom days per year (Shah and Nagpal 1997).An analysis of the records of 369 COPD patientsand 315 control patients admitted to Patan Hospitalfrom <strong>April</strong> 1992 to <strong>April</strong> 1994 showed that the odds ofhaving COPD are 1.96 times higher for KathmanduValley residents compared with outside residents.The study also stated that over the past decade theproportion of COPD patients had increased morethan fourfold and that COPD was the number onekiller of adult patients in the hospital (CEN andENPHO 2003).The records from three major hospitals inKathmandu indicate that the number of COPDpatients admitted to hospitals, as well as the numberof COPD patients as a percentage of all patients, hasincreased significantly in the last ten years. Hospitalrecords also indicate that the number of COPDpatients is highest in the dry winter months, when airpollution in Kathmandu is at its peak (Figure 7.12).Vehicular pollution and suspended dust from poorlymaintained roads are the major causes for the poorair quality in urban centers.Another observable impact is on visibility.Atmospheric data obtained from Kathmandu airportfrom 1970 onwards shows a substantial decrease invisibility in the Valley since 1980. The trend towardsreduced visibility in the Valley has been quitedramatic for the months November–March, andparticularly for December–February. The number ofdays with good visibility (>8,000 m) at 11:45 amdecreased in the winter months from more than 25Figure 7.12: Air Pollution Level in Kathmandu andIncidence of Chronic Destructive Pulmonary Disease(COPD) Patients as a Percentage of All Patientsdays/month in 1970 to 5 days/month in 1992. By 1997,the number of days per month in December–February with good visibility at noon approachedzero (Sapkota et al. 1997).The impacts of air pollution are felt not only onhealth but also on vegetation and in corrosiondamage to buildings and monuments. Air pollutioncan inflict significant damage on local vegetation.The information collated by Regional Air Pollution inDeveloping Countries during the initial phase of theCrops and Forests Project has clearly shown that inmany developing countries, and particularly in partsof Asia, crop yields and forest productivity are beingseverely affected by local ambient air pollutantconcentrations. In the context of South Asia, there isa strong linkage between monsoon activity andagricultural productivity. In the last decade, Nepaland the Indo-Gangetic plains of India experiencedsevere sky overcast during winter, affecting majorwinter crops like potato, oilseeds, pulses, and onion.Yield reduction in 1997/98 ranged from 11% to 38%compared with the average of the preceeding 10years. The precise reasons for this, however, are notyet clear. Frequent occurrence of cold waves and fogmixed with dust particles in the atmosphere could bethe cause. Likewise, reduction of solar radiationcould be the explanation. Aerosols can directly alterthe hydrological cycle by suppressing evaporationand rainfall. With respect to agricultural changes, itcan directly impact productivity by shadingvegetation from solar radiation; and indirectlythrough induced changes in temperatures and thehydrological cycle (UNEP and C4 2002).Climate and Climate ChangeNepal’s ClimateThe climate in Nepal varies from tropical to arcticwithin the 200 km span from south to north. Much ofNepal falls within the monsoon region, with regionalclimate variations largely being a function ofelevation. National mean temperatures hover around15°C, and increase from north to south with theexception of the mountain valleys. Average rainfall is1,500 mm, with rainfall increasing from west to east.The northwest corner has the least rainfall, situatedas it is in the rain shadow of the Himalayas. Rainfallalso varies by altitude—areas over 3,000 mexperience a lot of drizzle, while heavy downpoursare common below 2,000 m. Although annual rainfallis abundant, its distribution is of great concern.Flooding is frequent in the monsoon season duringsummer, while droughts are not uncommon incertain regions in other parts of the year.Data Source: Limbu (2005)Chapter 7: Air Pollution and Climate Change91
Climate ChangeA region’s climate is a summary of the past weatherevents that have occurred at that location. Climate istypically described by the statistics of a set ofatmospheric and surface variables, such astemperature, precipitation, wind, humidity,cloudiness, soil moisture, sea surface temperature,and the concentration and thickness of sea ice.Statistics may be in terms of the long-term averagesor other measures such as daily minimumtemperature, length of the growing season, orfrequency of floods. Weather, on the other hand,refers to the temperature, precipitation (rain andsnow), humidity, sunshine, and wind that occur at aparticular time at a specific location.Climatologists say that our planet is gettingwarmer overall and that this is leading to climatechange (IPCC 2001). The mean global surfacetemperature has increased by about 0.3 to 0.6°Csince the late 19th century and by about 0.2 to 0.3°Cover the last 40 years, which is the period with themost reliable data (UNEP undated). This build-up isattributed to the result of human activities, especiallyour use of fossil fuels in, for example, automobilesand power plants. In other words, air pollutants in thebroadest sense are considered to be the main causeof climate change. The impacts of thisunprecedented warming—increased floods anddrought, rising sea levels, spread of deadly diseasessuch as malaria and dengue fever, increasingnumbers of violent storms—threaten to be moresevere and imminent than previously believed.Impacts are already being felt in the Arctic,where the average annual temperature hasincreased approximately four times as much asaverage annual temperatures around the rest of theglobe (CIEL 2004). Rising temperatures have causedoutbreaks of insect pests such as the spruce barkbeetle, which is reproducing at twice its normal ratein today’s warmer climate (Anchorage Daily News2005). Similarly, observable changes have also beenfelt in Nepal. Some particular aspects of climatechange as they relate to Nepal are discussed below.Climate Change in NepalTemperature ChangeIn Nepal, the elevation generally increases fromsouth to north and is accompanied by decreasingtemperatures. Temperature observations in Nepalfrom 1977–1994 showed a general warming trend(Shrestha et al. 1999) with significantly greaterwarming at higher elevations in the northern part ofthe country than at lower elevations in the south.This finding is reinforced by observations by Liu andChen in 2000 on the other side of the Himalayas onthe Tibetan Plateau. Significant glacier retreat as wellas significant expansion of several glacial lakes hasalso been documented in recent decades, with anextremely high likelihood that such impacts arelinked to rising temperatures. The results of atemperature trend analysis for the period 1981 to1998 based upon data from 80 stations are shown inFigure 7.13. Except for small pockets in the easternFigure 7.13: Observed Mean Annual Temperature Trend (°C) per Decade for the Period [1981-1998]Source: MOPE and UNEP (2004)92 Environment Assessment of Nepal : Emerging Issues and Challenges
egion and far western Terai, most of Nepal showeda positive trend of between 0°C and 0.5°C perdecade. Agrawal et al. (2003) pointed out that thetemperature differences are most pronouncedduring the dry winter season, and least during theheight of the monsoon.A study carried out by MOPE and the UnitedNations Environment Programme (UNEP) for theInitial National Communication to the Conference ofthe Parties of the United Nations Framework Conventionon Climate Change using models (CanadianClimate Change Model [“CCCM”], Geophysical FluidDynamics Model [“GFD3]”, and Regional ClimateModel) and their projections showed a projected 2 to4°C rise in average annual temperature over Nepalwhen CO 2 is doubled. The magnitude of temperaturerise would be greater in western Nepal than in otherregions. According to the CCCM model, wintershowed the greatest increase of any season with thehighest value in the far-western region (2.4°C to5.4°C), and for all seasons, the rising gradient wasfrom east to west, whereas in the GFD3 model it wasfrom west to east during pre-monsoon and winter.Precipitation ChangeIn Nepal, altitude affects annual rainfall andprecipitation patterns. Up to about 3,000 m, annualrainfall totals increase with altitude; thereafter,annual totals decrease with increasing altitude andlatitude. Eastern Nepal receives approximately 2,500mm of rain annually, the Kathmandu area about1,420 mm, and western Nepal about 1,000 mm(Figure 7.14).In the prediction study conducted by MOPE andUNEP (MOPE and UNEP 2004) precipitation wasfound to increase for all seasons in general, with arising gradient from west to east using the GFD3model. The CCCM model predicted a negativegradient of precipitation from west to east duringwinter but followed the trend of the GFD3 model inother seasons. Trend analysis of observedprecipitation between 1981 and 1998 (Figure 7.15)showed a negative trend in the monsoon, postmonsoon, and annual scenarios which was morepronounced in western Nepal than in eastern Nepal.Most of the Terai belt, except in the eastern region,had a negative trend for all seasons.Impact of Climate Change in NepalThere are a number of anecdotal perceptions aboutNepal’s changing climate. However, further researchis needed before drawing firm conclusions as towhether and how the climate is already changing.In the Terai belt during the winter, news reportsindicate that fog persists until late morning, andwinter mornings are thus much colder than previousyears. Winter days in Kathmandu Valley are less cold,frost is becoming rare, and the summers are warmer.The beginning of spring has become a persistent coldrain. Rain has become less predictable anddependable, both in distribution and amount. Therehas been more ice and less snow. These changescan have a direct influence on surface runoff,agriculture, vegetation, and people’s daily lives.One of the few measured changes is that ofglacier retreat. The increase in temperature in theHimalaya and the vicinity appears to have beenhigher in the uplands than in the lowlands (Shresthaet al. 1999). The warming has resulted in markedretreat of the glaciers with a reduction in both areaand ice volume (Agrawal et al. 2003). The glacierfrom which Sir Edmund Hillary and Tenzing Norgayset out to conquer Mount Everest nearly 50 years agohas retreated three miles up the mountain—presumed to be a result of climate change—asreported by a team of climbers backed by UNEP(UNEP 2002). The <strong>Himalayan</strong> glaciers are arenewable storehouse of fresh water that benefitshundreds of millions of people downstream, thusglacier retreat has long-term implications for waterstorage and availability. Glacier retreat can also leadto more immediate problems. As glaciers retreat,lakes can form behind the newly exposed terminalmoraine. The unstable “dam” formed by the morainecan breach rapidly, leading to a sudden discharge ofhuge amounts of water and debris—a glacial lakeoutburst flood—often with catastrophic effects interms of damage to roads, bridges, trekking trails,villages, and agricultural lands, as well as loss ofhuman life and other infrastructure. Over the past 50years, there have been at least 21 recorded outburstflood events that have affected Nepal. In 2001,ICIMOD and UNEP documented 27 potentiallydangerous glacial lakes in Nepal (Mool et al. 2001).Climate change will inevitably have an impacton air pollution in the country. Rainfall markedlyreduces the levels of certain pollutants in ambient air,especially particulate matter. Increased frequency ofrain will reduce urban air pollution and vice versa.Equally, precipitation could set chemical processesin motion that have a negative impact. Increasedwind and storms may increase the levels oftransboundary pollutants, and/or increase dustlevels. Raised or lowered temperatures andprecipitation may impact on human activity and thuson levels of air pollutants. There are a myriaddifferent possibilities, but as yet prediction andmeasurement of possible climate change in Nepal isin its infancy, and thus the possible impacts can onlybe guessed at.Chapter 7: Air Pollution and Climate Change93
Figure 7.14: Mean Annual PrecipitationData Source: DHM (2003); Base map: ICIMOD (1996)Figure 7.15: Trend of Annual Precipitation (mm) per Decade for the Period (1981-1998)Source: MOPE and UNEP (2004)94 Environment Assessment of Nepal : Emerging Issues and Challenges
Policy ResponseRecent years have witnessed the emergence of anumber of national and local responses toenvironmental problems in Nepal. These initiativesare described below.Regulatory MeasuresAir pollution is increasingly recognized as a seriousproblem in urban and peri-urban settlements.Accordingly, ambient air quality standards have beenformulated (Table 7.3). Public awareness and judicialactions have also prompted policy initiatives.However, enforcement of the standards still needs tobe strengthened.The transportation sector is one of the maincontributors to air pollution in urban areas. TheGovernment has taken several measures to reducevehicular emissions, which are described below.Nepal introduced vehicle exhaust emission testsin 1994 following the tail-pipe standards of 65hartridge smoke units (HSU) for diesel-operatedvehicles and 3% CO for petrol-operated ones. Avehicular color rating system with respect to theexhaust emission standards was introduced. Thissystem provides green stickers to vehicles meetingthe emission standard and red stickers to vehiclesfailing the test. See Table 7.4 for details.Nepal Vehicle Mass Emission Standard 2056(2000) is the Government’s major step towardsreducing emissions per kilometer of travel. Thisstandard is similar to the European Union standard,popularly known as the EURO-1 standard.Actions undertaken include the following. Sincemid-September 1999, 3-wheel diesel tempos havebeen banned in Kathmandu Valley, Pokhara, andLumbini. Electric vehicles and LPG 3-wheelers havebeen introduced to meet the public transportdemand. Lead free gasoline was introduced inKathmandu Valley in July 1997, and since December26, 1999 only unleaded gasoline has been distributedin Nepal. The Government resolved on November 10,1999 to ban movement of vehicles older than 20years and all three wheelers and two-stroke enginesfrom the Valley beginning middle of November 2001.But this decision was not implemented by theGovernment due to protest by many vehicle owners.The Government has already banned the registrationof new two-stroke engine vehicles in Kathmandu.Measures have been taken to ban the pollutingbull’s trench kilns from Kathmandu Valley, andregistration of these kilns has stopped. The Governmentclosed the Himal Cement Factory followinglocal public complaints. Pollution-prone industriesmust now obtain licenses prior to establishment orexpansion. Licenses for such industries will be givenonly after ensuring that they have no adverse impacton the environment. Industrial pollution controlregulations have been drafted and environmentalimpact assessment (EIA) guidelines have beenprepared for each industrial sector.Regulatory measures have also been introducedto address the problem of ozone depletingsubstances (ODS). Nepal is a signatory to theMontreal Protocol, and the Nepal Bureau ofStandards and Metrology has been designated toimplement it. The Gazette Notification issued onSeptember 2000 determines the annualconsumption quotas and established an annualphase out of chlofluorocarbons, hydrochlorofluorocarbons,halons, and other ODS. Similarly, theODS Consumption (Control) Regulations 2001,requires all ODS importers to obtain licenses andforbids re-export of imported substances to othercountries. The joint phase-out rate of CFC 11/12 willbe 10% a year, to reach zero by 2010. Because allthese substances are imported from other countries,it is feasible to keep track of the amount of ODSbeing consumed and to achieve this goal by 2010.Economic InstrumentsFinancial incentives in the form of tax concessionsand subsidies are common practices as economicinstruments. The Department of Transport Managementcharges tax according to the date of vehiclemanufacture, with a higher tax levied on vehiclesolder than 20 years.Similarly, a levy of NRs 0.50 per liter wasintroduced on the sale of petrol and diesel. Theamount collected goes to the Kathmandu ValleyDevelopment Fund for pollution control,environment protection, and improvement of roads,sewerage system, and water supply. However, thisstill needs to be implemented (personalcommunication, Ministry of Environment, Scienceand Technology [MOEST]).Other initiatives include a subsidy on alternativeenergy, as follows: solar photovoltaic—50% subsidy;PV pumping system—75% subsidy; solar dryer—50%subsidy (1998).Technological ImprovementsEnvironmental considerations have started toinfluence industrial establishments, requiring themto limit their emissions and wastes. Due to publicpressure from nearby residential areas and fromconsumers, industries are gradually being requiredto utilize environmentally friendly processes (ESPSundated). ESPS has started one such activity inHetauda Industrial District.Chapter 7: Air Pollution and Climate Change95
Table 7.3: National Ambient Air Quality Standards for NepalParameterTSP (total suspendedparticulates)UnitsAveragingTimeConcentrationin Ambient Air,maximumTest Methodsμg/m 3 Annual24-hours a 230 High volume samplingPM10 μg/m 3 Annual24-hours a 120 Low volume samplingSulfur Dioxide μg/m 3 Annual 50 Diffusive sampling based on weekly averages24-hours b 70 To be determined before 2005.Nitrogen Dioxide μg/m 3 Annual 40 Diffusive sampling based on weekly averages24-hours b 80 To be determined before 2005.Carbon Monoxide μg/m 3 8 hours b 10,000 To be determined before 2005.15 minute 100,000 Indicative samplers cAnnual 0.5 Atomic Absorption Spectrometry, analysis of PM10 samples dLead μg/m 3 24-hoursAnnual 20 e Diffusive sampling based on weekly averagesBenzene μg/m 3 24-hoursμg/m 3 = micro gram per cubic meter , PM 10 = particulate matter of diameter 10 micron or lessa 24 hourly values shall be met 95% of the time in a year. The standard may be exceeded on <strong>18</strong> days per c alendar year , but not on two consecutive days.b 24 hourly standards for NO 2and SO 2and 8 hours standard for CO are not to be controlled before MoPE has recommended appropriate test methodologies. This willbe done before 2005.c Control by spot samplin g at roadside locations: minimum one sample per week taken over 15 minutes during peak traffic hours, i.e., in the period 8 am –10 am or 3pm–6 pm on a workday. This test method will be re -evaluated by 2005.d If representativeness can be proven, yearly av erages can be calculated from PM10 samples from selected weekdays from each month of the year.e To be reevaluated by 2005.Source: MOPE (2003)Table 7.4: Vehicle Emission Standards for GreenStickersCO% by HCType of VehicleVolume (ppm)Petrol-Operated VehiclesFour-wheelers 1980 or older 4.5 1,000Four-wheelers 1981 onwards 3.0 1,000Two-wheelers (two -stroke) 4.5 7,800Two-wheelers (four -stroke) 4.5 7,800Three-wheelers 4.5 7,800Gas-Operated VehiclesFour-wheelers 3.0 1,000Three-wheelers 3.0 7,800Diesel-Operated VehiclesOlder than 1994 75.01995 onwards 65.0ppm = part s per million , CO = carbon monooxide, HC = hydro carbonSource: MOPE (2003)The introduction of improved cooking stovescommenced in 1950 to reduce indoor air pollution.The national ICS Programme has disseminated about125,000 ICS in 33 mid-hill districts. Similarly, theBiogas Sector Program has built 137,000 family-sizebiogas plants in 66 of Nepal’s 75 districts, saving400,000 tons of firewood and 800,000 liters ofkerosene, and preventing 600,000 tons of greenhousegases from escaping into the atmosphere (NepaliTimes 2005). Likewise, estimates in 1998 indicatethat almost 1,000 micro-hydropower plants are inoperation (SHTF undated) and 1,100 kW ofphotovoltaic power is used in various public andprivate sectors of Nepal (EnvironmentNEPAL 2003).New methods for prevention and early warningof glacial lake outburst floods are also beingdeveloped and installed, although so far only at onelake, the Tsho Rolpa (Mool et al. 2001). Preventioninvolves recognition of the potential problem andemployment of modern engineering measures likecontrolled draining. Modern early warning systemsprovide alarms downstream that enable timelyevacuation of people and animals and protectivemeasures to be taken for property.Another longer term possibility for more farreaching change—use of hydrogen as an energysource—is described in the box.ConclusionThe energy, industry, and transportation sectors arethe major contributors to air pollution. The use of lowquality fuel, inefficient methods of energy production96 Environment Assessment of Nepal : Emerging Issues and Challenges
Hydrogen Energy—A Brighter Option for NepalEnergy is a vital input to the national economy and wellbeing of people. Normally, economic growth requires more useof energy. Current patterns of energy use result in emissions of pollutants. Local-level pollutants such as carbonmonoxide, suspended particles, and hydrocarbons degrade air quality and damage health. Sulfur dioxides and nitrogenoxides are examples of regional level pollutants that contribute to acid deposition, which can damage vegetation such asforests and crops, and human-made structures. Large increases in emissions may occur during the next 20 to 50 years ifcurrent trends persist. Air pollution has become a priority issue in most countries in Asia.At present sustainable energy is of increasing interest in the region. The rapid growth of atmospheric environmentalissues along with the fear of energy shortages is creating a consensus about the potential benefits of hydrogen fromrenewable energy sources. These interesting perspectives are further supported by the development of key technologies,such as renewable energy sources, advanced production processes, and fuel cell vehicles. This provides an idealopportunity to introduce a hydrogen economy in Nepal. Nepal is one of the top five countries in the world in terms ofhydroelectric production potential. Nepal could provide the opportunity to introduce emission-free production of hydrogenenergy not only to the country but for the whole region. In addition, Nepal has the added advantage of cheap labor whichcan support the production of hydrogen at an affordable price. The economic and environmental benefits of hydrogenenergy could also help to reduce poverty by creating domestic jobs and providing electricity beyond the national power grid.Source: A project proposal by UNEP RRC.AP.and use, and poor condition of vehicles and trafficmanagement are among the reasons for increasingemissions in Nepal. Biomass burning for cooking andspace heating is a source of indoor air pollution andresultant health effects. Though long-term data onpollution are lacking, available information revealsthat the nature and extent of air pollution is serious inmajor urban areas and in the hill regions of Nepal.Air pollutants also contribute to the developingproblem of climate change, although it is notpossible to assess to what extent. At the same time,climate change will itself have an impact on thepattern and extent of air pollution.As Nepal imports petrol, it should start demandinglow benzene petrol. It should also emphasizezero-emission electric vehicles such as trolley bussesand Safa tempo. In the long term, Nepal should optfor hydrogen energy which will benefit the countryboth economically and environmentally. Though thecapital investment cost is higher at the beginning,this would be repaid in the long run.Raising awareness is another fundamentalmeasure to curb air pollution. This can be donethrough hands-on workshops, seminars, and sitevisits. However, the media should play a key role inthe overall strategy. Media coverage of key messagesthat need to be delivered to primary stakeholderswould reinforce the importance of those messages.At the same time, using the media ensures that thesemessages reach the general public as well, serving asinformation as well as reinforcing the importance ofthose messages.Along with awareness raising, capacity buildingis equally important. Scientific information remainsthe basis for any pollution-control efforts, andcapacity building of both institutions and individualsis vital. The contemporary view of capacity buildinggoes beyond the conventional perception of training.The central concerns of air quality management tomanage change, to resolve conflict, to manageinstitutional pluralism, to enhance coordination, tofoster communication, to develop a strong credibledatabase, and to ensure that data and informationare shared—require a broad and holistic view ofcapacity development, which is still poor in Nepaland needs to be strengthened.BibliographyAdhikari, A.P. 1998. Urban and Environmental Planning inNepal: Analysis, Polices and Proposals. Kathmandu:The World Conservation Union (IUCN).Adhikari, D.P. 1997. “Energy and EnvironmentalImplications of Alternative Transport Options: TheCase of Kathmandu, Nepal.” Unpublished M. Eng.Thesis, Asian Institute of Technology, Bangkok.Agrawala, S., V. Raksakulthai, M. Aalst, P. Larsen, J. Smith,and J. Reynolds. 2003. Development and ClimateChange In Nepal: Focus On Water Resources andHydropower. Paris: Organisation for Economic Cooperationand Development. Available:http://www.oecd.org/ dataoecd/6/51/19742202.pdfAnchorage Daily News. 2005. “Scientists Link WarmerWeather to Beetle Outbreak.” September 11.Available: http://www.fire.uni-freiburg.de/media/2005/news_20050912_us2.htmAsian Institute of Technology (AIT). undated. “Energy,Environment and Climate Change Issues: Nepal.” Astudy by the Asian Regional Research Programme inEnergy, Environment and Climate, Bangkok.Basnyat, P., R.N. Bhattarai, and S.K. Mishra. 2004. “Use ofEarth Air Tunnel HVAC System in Minimising IndoorAir Pollution.” Paper presented at the Workshop onBetter Air Quality (BAQ) 2004, 6–8 December, Agra,Chapter 7: Air Pollution and Climate Change97
India. Available: http://www.cleanairnet.org/baq2004/1527/article-59311.htmlBastola, T.S. 1998. “Responses to Air Pollution Impacts.” InA Compendium on Environment Statistics 1998.Kathmandu: His Majesty’s Government of Nepal,Central Bureau of Statistics.Bates M.N., A. Deuja, A. Khalakdina, A.K. Pokhrel, and K.R.Smith. 2005. “Case–Control Study of Indoor CookingSmoke Exposure and Cataract in Nepal and India.”International Journal of Epidemiology 34 (3):702–708.Bhattacarya, S. undated. “Cooking Options in DevelopingCountries.” Asian Institute of Technology, Thailand.Available: http://www.serd.ait.ac.th/teenet/cooking.htmChalise, S.R., M.L. Shrestha, B.R. Shrestha, K.B. Thapa, andB. Bajracharya. 1996. Climatic and Hydrological Atlasof Nepal. Kathmandu: ICIMOD.Clean Energy Nepal (CEN) and Environment and PublicHealth Organization (ENPHO). 2003. “Health Impactsof Kathmandu’s Air Pollution.” Unpublished report,Kathmandu.Central Bureau of Statistics (CBS). 1994. A Compendium onthe Environmental Statistics of Nepal Issues andFacts. Kathmandu.———.1996. Nepal Living Standards Survey Report 1996.Kathmandu.———.2002. Census of Manufacturing Establishment Nepal2001–2002. Kathmandu.———.2003. Population Monograph of Nepal, Vol. I, pp.341–371. Kathmandu.———.2004. Hand<strong>book</strong> of Environment Statistics 2003.Kathmandu.Chettri, M.K. 2000. “Toxic Heavy Metals in Ambient Air ofKathmandu.” In 10th Anniversary Souvenir.Kathmandu: Environment and Public HealthOrganisation.Chettri, M.K., K.B. Thapa, K. Poudyal, and B.D. Acharya.undated. “Biomonitoring of Toxic Heavy Metals inKathmandu Valley Using Lichen.” Ecoprint 8(1):69–76. Available: http://www.cleanairnet.org/caiasia/1412/articles-60<strong>18</strong>2_resource_1.pdfCIEL (The Center for International Environmental Law).“Climate Change Program.” Washington, DC.Available:http://www.ciel.org/Climate/programclimate.htmlDavidson, C., S. Lin, and J.F. Osborn. 1986. “Indoor andOutdoor Air Pollution in the Himalayas.”Environmental Science and Technology 20(6):561–567.Devkota, S.R. 1993. “Ambient Air Quality Monitoring inKathmandu Valley.” Report prepared by theKathmandu Valley Vehicular Emission ControlProgramme, United Nations DevelopmentProgramme, Kathmandu.Devkota, S.R., B. Koirala, and C. Gautam. 1996. “IndustrialPollution Inventory and Management in Nepal.”UNEP Industry and Environment 19(1): 37–42.Devkota, S.R., and C.P. Neupane. 1994. “Industrial PollutionInventory of the Kathmandu Valley and Nepal.”Report prepared by the Industrial Pollution ControlManagement Project, Ministry of Industry,Kathmandu.Dhakal, S. 1998. “Transportation and Environmental Issues:A Case Study of Nepal.” Reprint of paper presentedat International Students’ Seminar on TransportResearch, Chiba, Japan.———.2001. “Financing the Adaptation to the ClimateChange: Issues and Controversies.” Environment6(7): 23–33.Department of Health Services (DOHS). 1997. AnnualReport 1995/1996. Kathmandu.———.2003. Annual Report 2001/2002. Kathmandu.Department of Hydrology and Meteorology (DHM). 2003.Unpublished Information on Total SuspendedParticulate Matter (TSP) Concentrations in theKathmandu Valley, His Majesty’s Government ofNepal, Department of Hydrology and Meteorology,Kathmandu.Department of Roads (DOR). 1998. Nepal Road Statistics1998. Kathmandu: Ministry of Works and Transport.Department of Transport Management (DOTM). 2005.Unpublished data accessed from record files,Department of Transport Management, Kathmandu.Dixit, K. 2005. “Cow Dung Takes the Cake: Nepal’s biogasprogram bags coveted award. In Nepali Times, IssueNo. 257. 22–28 July. Kathmandu.Economopoulos, A.P. 1993. “Assessment of Sources of Air,Water, and Land Pollution, A Guide to Rapid SourceInventory Technique and Their Use in FormulatingEnvironmental Control Strategies Part Two:Approach for Consideration In FormulatingEnvironmental Control Strategies.” World HealthOrganization, Geneva.Environment and Public Health Organization (ENPHO).1993. “Air Quality Assessment in Kathmandu City.”Kathmandu.———.1999. “A Report on Study on Reduction of Pollutionand Waste in the Himal Cement Company Limited.”Kathmandu.Environment NEPAL. 2003. Energy-Solar Photovoltaic.Available: www.environmentnepal.com.np/energy_m.aspEnvironment Sector Programme Support (ESPS). “CleanerProduction.” Available: http://www.esps.org.np/brochures/clean.htmlEnvironmental Protection Agency (EPA). “The ParticlePollution Report, Current Understanding of AirQuality and Emissions Through 2003.” New York.Available: http://www.epa.gov/ airtrends/pmreport03/report_2405.pdf#page=198 Environment Assessment of Nepal : Emerging Issues and Challenges
Hildebrandt, M.L, an S. Pokhrel. 2002. “Climate and AirQuality: A Case Study of PM10 Pollution inKathmandu, Nepal.” Department of Geography,Environmental Sciences Program, Southern IllinoisUniversity Edwardsville, Edwardsville.Intergovernmental Panel on Climate Change (IPCC). 2001.Climate Change 2001: The Scientific Basis.Cambridge: Cambridge UniversityPress/Intergovernmental Panel on Climate ChangeIUCN (The World Conservation Union). 1991. Sources ofIndustrial Pollution in Nepal: A National Survey.Kathmandu: His Majesty’s Government of Nepal,National Planning Commission-NationalConservation Strategy Implementation Project.———.1992. Environmental Pollution in Nepal: A Review ofStudies. Kathmandu: His Majesty’s Government ofNepal, National Planning Commission-NationalConservation Strategy Implementation Project.Iyngararasan, M., L. Tianchi, and S. Shrestha. 2002. “TheChallenges of Mountain Environments: Water,Natural Resources, Hazards, Desertification and theImplications of Climate Change.” Draft backgroundpaper for review by the Mountain Forum, BishkekGlobal Mountain Summit. United NationsEnvironment Programme, Regional Resource Centerfor Asia and Pacific. Available:http://www.mtnforum.org/resources/library/iyngx02a.htmJoshi, K.M. 1993. “Report on the Works of Monitoring ofVehicular Emissions in Kathmandu Valley.”Kathmandu Valley Vehicular Emission ControlProject, United Nations DevelopmentProgramme/His Majesty’s Government of Nepal.Kunwar, U.K. 1999. “Ambient Air, Surface Water andGround Water Quality Standards for KathmanduValley.” Unpublished report submitted byInstitutional Strengthening of Ministry of Populationand Environment (TA No. 2847-NEP) to Ministry ofPopulation and Environment.LEADERS (Society for Legal and Environmental Analysisand Development Research).1999. “A ComparativeStudy of Air Pollution in Three Major Cities of Nepal.”Kathmandu.Limbu. S. 2005. “Ambient Air Quality of Kathmandu Valley.”Unpublished M.A. Thesis. Central Department ofGeography, Tribhuvan University, Kathmandu.Liu, X. and B. Chen. 2000. “Climatic Warming in the TibetanPlateau during Recent Decades.” InternationalJournal of Climatology (20): 1729–1742.Malla, S. 1993. “Urban Energy Use and EnvironmentManagement: The Case of Kathmandu Valley.”Unpublished M. Eng. Thesis, Asian Institute ofTechnology, Energy Program, Bangkok.Manandhar, A. 2000. “Status of Cleaner Production (CP) inNepal.” Unpublished document, Kathmandu.Ministry of Environment, Science and Technology(MOEST). undated. “Ambient Air Quality ofKathmandu Valley 2003–2004.” Kathmandu.Ministry of Finance (MOF). 2004. Economic Survey(FY2003/2004). Kathmandu.Ministry of Population and Environment (MOPE). 1998.State of the Environment Nepal. Kathmandu.———.2003. Data source: Air Quality Monitoring. Available:http://mope.gov.np/mopepollution/———.2004. Data source: Air Quality Monitoring. Available:http://mope.gov.np/mopepollution/Ministry of Population and Environment (MOPE) andUnited Nations Environment Programme (UNEP).2004. “Initial National Communication to theConference of the Parties of the United NationsFramework Convention on Climate Change.” HisMajesty’s Government of Nepal, Ministry ofPopulation and Environment, Kathmandu.Ministry of Population and Environment (MOPE)/UnitedNations Environment Programme (UNEP)/International <strong>Centre</strong> for Integrated MountainDevelopment (ICIMOD). 2000. “Implementation ofThe Malé Declaration on Control and Prevention ofAir Pollution and Its Likely Transboundary Effects forSouth Asia.” Unpublished Report, UNEP/ICIMOD/MOPE/South Asia Cooperative EnvironmentProgramme (SACEP)/ Sustainable EcosystemsInstitute (SEI), Kathmandu.Mishra, V. 2003. “Health Effects of Air Pollution.” Population-Environment Research Network (PERN)Cyberseminar, December 1–15. Available:http://www.populationenvironmentresearch.orgMiyoshi, Y. 1987. Pollution Control in Selected Industries.Kathmandu: Industrial Service <strong>Centre</strong>, BalajuMool, P.K., S.R. Bajracharya, and S.P. Joshi. 2001. Inventoryof Glaciers, Glacial Lakes and Glacial Lake OutburstFloods, Monitoring and Early Warning System in theHindu Kush-<strong>Himalayan</strong> Region. Kathmandu:International <strong>Centre</strong> for Integrated MountainDevelopment.Naeher, L.P., K.R. Smith, M. Brauer, Z. Chowdhury, C.Simpson, J.Q. Koenig, M. Lipsett, and J.T. Zelikoff.2005. Critical Review of the Health Effects ofWoodsmoke. Berkley: University of California.Available: http://ehs.sph.berkeley.edu/krsmith/publications/HC%20woodsmoke%20report%20Mar%2031%2005(rev).pdfNepal Bureau of Standards and Metrology (NBSM). 1999.Nepal Country Program for the Phase out of OzoneDepleting Substances. Kathmandu: His Majesty’sGovernment of Nepal, NBSM/United NationsEnvironment Programme.Nepal Bureau of Standards and Metrology (NBSM) andUnited Nations Environment Programme (UNEP).undated. “Shield, South Asia’s Compliance with theMontreal Protocol.” His Majesty’s Government ofNepal, NBSM, Kathmandu:Nepal Environmental and Scientific Services (NESS). 1995.“Research on Environmental Pollution andManagement.” Kathmandu.Chapter 7: Air Pollution and Climate Change99
———.1999. “Ambient Air Quality Monitoring ofKathmandu Valley.” Unpublished reportedsubmitted to Ministry of Population and Environmentby Asian Development Bank Project (TA 2847- NEP),Kathmandu.Nepal Health Research Council (NHRC). 2004. SituationalAnalysis of Indoor Air Pollution and DevelopmentGuidelines for Indoor Air Quality Assessment andHouse Building for Health. Kathmandu.Niraula, B.P. 1998. “Health.” In A Compendium ofEnvironment Statistics 1998. Kathmandu: HisMajesty’s Government of Nepal, Central Bureau ofStatistics.Pandey, M., and B. Basnet. 1987. “Chronic Bronchitis andCor Pulmonale in Nepal: A Scientific EpidemiologicalStudy.” Monograph. Mrigendra Medical Trust,Kathmandu.Pokharel, A.K.. 1998. “A Citizen Report on Air Pollution inKathmandu Valley: Children’s Health at Risk.”LEADERS (Society for Legal and EnvironmentalAnalysis and Development Research), Kathmandu.Pokhrel, S. 2002. “Climatology of Air Pollution inKathmandu Valley, Nepal.” Unpublished M.Sc.Thesis. Graduate School, Southern Illinois UniversityEdwardsville, Edwardsville.Ramana, M.V., B.B. Pradhan, V. Ramanathan, B. Shrestha,and I.A. Podgorny. 2004. “Direct Observations ofLarge Aerosol Radiative Forcing in the <strong>Himalayan</strong>Region.” Geophysics Research Letters, 31, L05111,doi:10.1029/2003GL0<strong>18</strong>824.Raut, A.K. “Crisis Brewing in Nepal’s Smoke-filledKitchens.” In One World South Asia. Available:http://southasia.oneworld.net/article/view/92090/1/———.2003. “Health Impact Assessment of Brick Kilns.”Paper presented at the Workshop on Health ImpactAssessment, organized by Nepal Health ResearchCouncil in Kathmandu.Reid, H.F., K.R. Smith, and B. Sherchand. 1986. “Indoorsmoke exposures from traditional and improvedcookstoves: Comparisons among rural women.”Mountain Research Development 6(4): 293–304.Roy, R., S. Gurung, and P. Bam. 2001. “A Social Dynamics onLaunching Safa Tempos in Kathmandu Valley: ACampaign Against the Air Pollution.” Environment6(7): 89–95.Sapkota, B.K., N.P. Sharma, K. Poudel, and B. Bhattarai.1997. “Particulate Pollution Levels in KathmanduValley.” Environment 3 (2).Shah, J., and T. Nagpal, eds. 1997. “Urban Air QualityManagement Strategies in Asia Kathmandu ValleyReport.” World Bank Technical Paper No. 378,Washington, DC: World Bank.Shah, I. 2004. “An Effort to Reduce Indoor Air PollutionThrough Paper and Power Project.” Paper presentedat the Workshop on Better Air Quality (BAQ) 2004,6–8 December, Agra, India. Available:http://www.cleanairnet.org/baq2004/1527/article-59310.htmlShakya, K., M.K. Chettri, and T. Sawidis. undated. “Appraisalof Some Mosses for Biomonitoring Airborne HeavyMetals in Kathmandu Valley.” Ecoprint 11(1) 35–49.Available: http://www.cleanairnet.org/caiasia/1412/articles-60<strong>18</strong>3_resource_1.pdfShrestha, A.B., C.P. Wake, P.A. Mayewski, and J.F. Dibb.1999. “Maximum Temperature Trends in theHimalaya and its Vicinity: An analysis based ontemperature records from Nepal for the period1971–1994.” Journal of Climate (12): 2775–2789.Shrestha, R.M., and S. Malla. 1996. “Air Pollution fromEnergy Uses in a Developing Country City: The Caseof Kathmandu Valley Nepal.” Energy 21: 785–794.SHTF. undated. International Small-Hydro Atlas: Nepal.Published online by the Small-Scale Hydro TaskForce under the IEA Hydropower Agreement.Available at www.small-hydro.com/index.cfm?Fuseaction=countries.country&Country_ID=54Smith, K.R. 1987. Biofuels, Air Pollution, and Health: AGlobal Review. New York: Plenum Press.Thapa, S., S.S. Shrestha, and D. Karki. 1993. A Survey ofBrick Industries in Kathmandu Valley. Kathmandu:Environment and Public Health Organization(ENPHO).Tuladhar, B., and A. Raut. 2002. Environment and HealthImpacts of Kathmandu’s Brick Kilns. Kathmandu:Clean Energy Nepal.United Nations. 2001. Air Quality in Asia and the Pacific: AnAnalysis in Relation to National and InternationalStandards. New York. United NationsUnited Nations Development Programme (UNDP) andUnited Nations Environment Programme (UNEP)Regional Resource Center for Asia Pacific (RRCAP).2002. “Malé Declaration on Control and Prevention ofAir Pollution and Its Transboundary Effects for SouthAsia.” UNEP RRCAP Newsletter, November 2002,Bangkok.United Nations Environment Programme (UNEP). 2001.Nepal: State of the Environment 2001. Bangkok:United Nations Environment Programme, RegionalResource Center for Asia Pacific.———.2002. “Impact of Global Warming on mountainareas confirmed by UNEP-backed mountaineers.”UNEP Press Release. 10 June. Available:http://www.unep.org/<strong>Document</strong>s/Default.Print.asp?<strong>Document</strong>ID=253&ArticleID=3080———. “Trend in Global Average Surface Temperature.” InObserved Climate Trends. Online resource fromGRID–Arendal. Available: http://www.grida.no/climate/vital/17.htmUnited Nations Environment Programme (UNEP) andCenter for Clouds, Chemistry, and Climate (C4).2002. “The Asian Brown Cloud: Climate and otherEnvironmental Impact.” Available: http://www.adb.org/vehicle-emissions/General/Environment-cloud.asp100 Environment Assessment of Nepal : Emerging Issues and Challenges
US Environmental Protection Agency (EPA). 2004. “TheParticle Pollution Report: Current Understanding ofAir Quality and Emissions through 2003.” Office of AirQuality Planning and Standards Emissions,Monitoring, and Analysis Division, North Carolina.Available: http://www.epa.gov/airtrends/pm.htmlWarwick, H., and H. Doig. 2004. Smoke—the Killer in theKitchen, Indoor Air Pollution in DevelopingCountries. London: ITDG Publishing.Water and Energy Commission Secretariat (WECS). 1996.Energy Synopsis Report: Nepal 1994/1995.Kathmandu: His Majesty’s Government of Nepal,Ministry of Water Resources.———.1999. WECS Bulletin 10(1). Kathmandu.Winrock International Nepal. 2004. “Household Energy,Indoor Air Pollution and Health Impacts: StatusReport for Nepal.” Submitted to United StatesAgency for International Development (USAID),Increase Use of Renewable Energy ResourcesProgram, Kathmandu.World Resources Institute (WRI). 1998. World Resources1998–99: Environmental Change and HumanHealth. Joint publication of the World ResourcesInstitute/ United Nations EnvironmentProgramme/United Nations DevelopmentProgramme/World Bank.Chapter 7: Air Pollution and Climate Change101
Appendix 7.1: World Health Organization Guideline ValuesCompound a Guideline Value Averaging TimeOzone 120 micrograms/cubic meter (0.06 ppm) 8 hoursNitrogen dioxideSulfur dioxideCarbon monoxide b200 micrograms/cubic meter (0.11 ppm)40 to 50 micrograms/cubic meter (0.021 –0.026 ppm)500 micrograms/cubic meter (0.175 ppm)125 micrograms/cubic meter (0.044 ppm)50 micrograms per cubic meter (0.017 ppm)100 mg/cubic meter (90 ppm)60 mg/cubic meter (50 ppm)30 mg/cubic meter (25 ppm)10 mg/cubic meter ( 10 ppm)1 hour1 year10 min24 hours1 year15 min30 min1 hour8 hoursLead c 0.5 to 1.0 micrograms/cubic meter 1 yearmg = milligram, p pm = parts per millionaGuideline value for particulate matter is no longer set because there is no evident threshold (lowest safe level) for effec ts on morbidity and mortality. (See belowfor previous guideline value for particulate matter).bThe guideline is to prevent carboxyhemoglobin levels in the blood from exceeding 2.5%. The values are mathematical estimates of some CO concentrations andaveraging times over which this goal should be achieved.cThe guideline for lead was established by WHO in 1987.Source: WHO Ambient Air Quality Guidelines, http://w3.whosea.org/techinfo/air.htmPrevious WHO Guideline Value for Particulate MatterWHO Air Quality Guidelines (mg/m 3 )Duration TSP PM10Long Term (annual average) 60–90Short Term (24 hour average) 150–230 70Short Term (8 hour average) 120 70Source: CBS (2004)102 Environment Assessment of Nepal : Emerging Issues and Challenges
Chapter 8Urban EnvironmentIntroductionUrban areas play an important role in economic,political, and cultural development. Theconcentrated population and production inurban areas leads to greatly reduced unit costs inproviding and managing basic infrastructure andservices, better employment and livelihoodopportunities, and easier participation in the politicalprocess. The same concentration, however, makesurban areas consumers of resources and producersof pollution, resulting in a wide range ofenvironmental problems in the cities and beyond.Historically, cities grew gradually over longperiods of time, which provided time andopportunity to address their emerging needs. In thepast half-century, the pace of urbanization indeveloping countries has accelerated greatly. Often,rapid urban growth has taken place withoutmatching expansion of the infrastructure, services,and facilities necessary for an adequate and healthyurban environment, and without adequate planningor regulation. This has caused deterioration in urbanenvironmental quality. Urban areas commonly faceshortages of safe drinking water and inadequateprovision of sanitation, solid waste collection anddisposal, drains, paved roads; and other forms ofinfrastructure and services necessary for a healthyenvironment. This results in bad water and airquality, unmanaged or mismanaged waste, andincreasing noise pollution. Urban areas also faceproblems in controlling encroachment into publicspaces and degradation of cultural sites and heritage.Rapid urban growth in itself need not produceserious environmental problems providedenvironmental implications are considered in asystematic, timely, and adequate way.Kathmandu Valley is the most urbanized regionin Nepal and its urban areas have been importanteconomically, administratively, and politically forhundreds of years. The urbanization of KathmanduValley goes back over 1500 years, and the old townsof the Valley are characterized by a strong culturalhistory and pattern—dense settlement withcourtyards as in-town open space, squares asintervening open spaces, temples and other culturalsites, and greenery and open space at the periphery.The old settlements were located at relatively higherelevations and surrounded and separated from eachother by agricultural land; almost all waste wasbiodegradable, and sewage was used in agriculture.Until fairly recently, except for sanitation, theenvironmental quality of the Valley towns wasexcellent (HMG/UNDP 1994). In the process of rapidgrowth, Nepal’s urban areas now face all the abovementionedproblems of infrastructure and servicedeficiency, and environmental management.Urban Growth and FeaturesUrban SettlementsThe municipalities designated by the Ministry ofLocal Development are the areas in Nepal formallydefined as urban. The criteria for designatingmunicipality status have been revised several timessince 1952 (Table 8.1). The current definition is givenby the Local Self Governance Act 1999, whichclassifies municipalities into three hierarchical levels:metropolitan city, sub-metropolitan city, andmunicipality. At present there are 1 metropolitan city(Kathmandu), 3 sub-metropolitan cities (Biratnagar,Lalitpur, Pokhara, and Birganj), and 53municipalities.The density, contiguity, and occupationalstructure of the population—which are generallyaccepted criteria for defining urban areas—havenever been considered in designating municipalitiesCrowded KathmanduNEFEJChapter 8: Urban Environment103
Table 8.1: Criteria for Urban StatusAct or GuidelinesCriteriaThe 1952/54 a census Identified 10 “prominent” settlements with populations exceeding 5,000 (but not formallycategorized as urban areas).The 1961 censusAn area with a population cluster exceeding 5,000 and having an urban environment such as highschool, college, judicial and administrative offices, bazaar, communication facilities, mills, andfactories.The Municipality Act of 1962 An area with a population exceeding 10,000 with an urb an environmentLocal Self-Governance Act1999Metropolitan city: a municipality with a “min imum population size of 300,000; annual revenue ofat least NRs400 million ; facilities of electricity, drinking water, communication, paved main andsubsidiary roads; provision of specialized health services; essential infrastructure for internationalsports events; adequate opportunities for highe r education in different fields; at least oneestablished university; adequate urban facilities, and an area that has al ready received the statusof Sub-Metropolitan”.Sub-Metropolitan city: a municipality with a “min imum population size of 100,000 ; annualrevenue of at least NRs 100 million; facilities of electricity, drinking water, communication, pavedmain roads, educat ion and health services of high standard; general infrastructure for national andinternational sports events, provision of public parks , a city hall , and similar urban facilities; andthat has already received the status of a Municipality”.Municipality ( Terai): minimum population size of 20,000; annual revenue of NRs5 millionminimum urban facilities such as electricity, road s, drinking water, and communication sMunicipality (Hill/Mountain): minimum population size of 10,000; annual revenue ofNRs500,000, and minimum urban facilities such as electricity, road s, drinking water, andcommunicationsa Census of 1952/54 cover ed two Nepali years, approximately mid <strong>April</strong> 1952 to mid <strong>April</strong> 1954.Source: Ministry of Law and Justice (1999); Sharma (2003); andin Nepal. Population size, revenue generation, andavailability of facilities and services appear to be thebasis for designating a settlement as an urban ormunicipal area. These criteria, however, have notbeen strictly and consistently applied over thedecades in assigning municipality status to a locality.Some areas have been classified, de-classified, andre-classified as municipalities over the past 50 years,and the territorial boundaries of many settlementshave been re-drawn to include surrounding ruralareas to meet the population size criteria. This mighthave been motivated by political interests. As aresult, significant parts of the territories of severalformally defined municipalities may not exhibit anurban character, while other settlements like small oremerging towns not yet formally defined asmunicipalities may show a more urban character.Population TrendsNepal is one of the least urbanized countries in theworld. In 2001, the last year for which reliablestatistics are available, 14% of the population lived inurban areas. However, the rate of urban growth hasbeen fast in recent decades: the rate of urbanizationincreased markedly from the 1970s onward and isamong the highest in Asia and the Pacific. Between1952 and 2001, the number of formally designatedurban centers grew from 10 to 58, with acorresponding increase in urban population from 0.2million to 3.2 million; a sixteen-fold increase. Theurban population was only 3% in 1952 (Table 8.2).The ratio of urban population to total population hasincreased progressively, and the annual averagegrowth rate of urban population exceeded thenational population growth rates throughout theperiod from 1952 to 2001. One projection suggeststhat Nepal’s urban population will be more than 6million by 2011, the 58 municipalities will containover 20% of the national population, and 16 townswill exceed 100,000 population (Joshi 1999). Ingeneral, urban growth is expected to continuerapidly. According to the <strong>ADB</strong> (2000), the majorreasons for rapid growth in Nepal’s urban populationinclude the following:(i) High levels of rural to urban migration: thegeneral trend of migration in Nepal is fromHill/Mountain regions to the Terai (plain) andfrom rural to urban. The insurgency thatbegan in 1996 has significantly acceleratedrural-urban migration;(ii) A high population growth rate;(iii) Extension of existing municipal boundaries;and(iv) Designation of new municipalities.With increasing urbanization, the urbaneconomy is growing at a rate of 6.4% per annum,more than double that of the rural economy, and thecontribution to the national economy is estimated tobe around 60% of gross domestic product (GDP)(Nippon Jogesuido Sekkei 2002).104 Environment Assessment of Nepal : Emerging Issues and Challenges
Table 8.2: Summary of Urban Growth Trends in Nepal 1952/54 a –2001Item 1952/54 a 1961 1971 1981 1991 2001Urban population (’000) 238.3 336.2 461.9 956.7 1,695.7 3,227.9Number of urban places 10 16 16 23 33 58Percentage of Urban Population (and Places) by RegionHill/Mountains 0 4.8 (3) 7.4 (3) 8.7 (4) 11.4 (8) 17.8 (20)Kathmandu Valley 82.6 (5) 64.9 (5) 54.0 (3) 38.0 (3) 35.3 (3) 30.9 (5)Inner Terai 0 0 3.5 (1) 10.1 (4) 9.5 (4) 12.1 (8)Terai 17.4 (5) 30.3 (8) 35.0 (9) 43.2 (12) 43.9 (<strong>18</strong>) 39.2 (25)Level of Urbanization by Region (Urban Population as % of Total Population)Hill/Mountains — — 1.2 2.5 6.4Kathmandu Valley — — — 47.4 54.1 60.5Inner Terai — — 7.6 9.5 <strong>18</strong>.0Terai — — — 6.8 9.4 12.3Nepal 2.9 3.6 4.0 6.4 9.2 13.9Average Annual Growth Rates of Urban Population During Intercensus Periods (10 years)Hill/Mountains — — 7.78 9.27 8.73 11.58Kathmandu Valley — — 1.36 3.86 5.11 5.22Inner Terai — — — 19.59 5.<strong>18</strong> 9.34Terai — — 4.74 9.82 6.06 5.44Nepal’s Urban Area(overall)— — 3.23 7.55 5.89 6.65Urban Density (person s per km 2 )Hill/Mountains — — — — — 550Kathmandu Valley — — — — — 10,265Inner Terai — — — — — 402Terai — — — — — 1,092Urban Total — — — — — 985Rural Total — — — — — 136— = not available , km 2 = square kilometera Census of 1952/54 cover ed two Nepali years, approximately mid <strong>April</strong> 1952 to mid <strong>April</strong> 1954Source: Sharma (2003) pp. 375–412.Pattern of UrbanizationUrbanization has not occurred evenly throughout thecountry (Table 8.2). Kathmandu, the capital city, isthe main urban center and dominates in terms ofconcentration of population and economic activities;it has been growing at a very high annual rate inexcess of 7% (Nippon Jogesuido January 2002). TheHill/Mountain region remains the least urbanized inthe country, and Kathmandu Valley consistentlyremains the most urbanized region, although itsshare of urban population has been declining andhas been exceeded by the Terai region since 1981. Ingeneral, regions with low levels of urbanization havebeen experiencing faster urban growth and regionsexperiencing slower rates of urban growth are theones where the existing level of urbanization ishigher.Over 39% of Nepal’s urban population in 2001resided in metropolitan and sub-metropolitan areaswith populations over 100,000. Nepal currently has 45urban areas with populations between 20,000 and100,000, against only 6 in 1971. These contain over54% of the urban population. Several of these aredistrict headquarters, which have been importanttrade centers with long histories. In 2001, only about4% of the urban population lived in the eight urbancenters with populations between 10,000 and 20,000.There are many small market towns withpopulations under 10,000. Although there is noadequate information available on their populationand growth rates, it is clear that these are growingquite fast. They now frequently contain significantpopulations and appear more urban than theoutskirts of many designated municipalities. Thesesmall market towns are not yet classified as urbanareas. New roads, improved accessibility, andinfrastructure development led to their emergenceas towns, and several of the newly emerged smalltowns are on highways and feeder roads. Many ofthese had been only small rural trading centers,villages, or did not exist until a few decades ago.They generally lack basic infrastructure toChapter 8: Urban Environment105
accommodate the rapidly increasing populationpressure (newspaper articles, personal communicationand observation, and Joshi 2000).Only Kathmandu has reached a population of500,000 inhabitants or more, and at present only fiveurban areas—Biratnagar, Birganj, Kathmandu,Lalitpur, and Pokhara—have populations exceeding100,000. Except for Kathmandu, all have populationsless than 175,000. Nepal’s population size and urbanbasedeconomy are small and would not beconducive to larger cities. Migration is likely to begreatest to those urban areas where land for housingis comparatively cheap, where there areemployment and livelihood opportunities, andwhere there are reasonable urban facilities such aseducation, health, and communications. This logic,and the past trend, suggests that urban areas withcurrent populations in the range of 50,000 to 100,000are likely to be the preferred destinations formigration. The trend in the last three decades alsosupports this argument: between 1971 and 2001,population in urban areas of 50,000 to 99,000 grewfrom 13% to 24% of the total urban population,whereas the percentage declined among all othersizes. The typical population of Nepalese towns inthe next decade or so is likely to be 100,000 to200,000. Most of Nepal’s urban centers are unlikely tohave populations exceeding 300,000 in the next 10 to15 years.Most urban areas are not very denselypopulated in terms of persons per unit area (Table8.2). The urban areas of Kathmandu Valley are themost densely populated in Nepal. Urban densities insome of the municipalities, particularly in theHill/Mountain region, are only slightly higher than thatof rural areas. For example, the density of Triyuga andAmargadi municipalities is 172.8 and 132.5 personsper square kilometer, respectively, which iscomparable with the rural density (Sharma 2003).Population densities may be higher in smaller oremerging towns that are not yet classified as urbanareas. Several municipalities exhibit a more ruralthan urban character because of expansion ofboundaries of the existing towns in the process ofgaining municipal status to include population on thefringes that was hitherto classified as rural. Somemunicipalities are not even linked with the rest of thecountry by road, and the outskirts of manymunicipalities can be reached only by a walk of 3–4hours.Emerging ProblemsMost urban areas of Nepal have cultural and heritagesites of varied nature including historical settlements,monuments, religious sites (temples, monasteries,and others) and ponds and public taps. These are oflocal, national, and international significance; someare listed as World Heritage Sites by the UnitedNations Educational, Scientific and CulturalOrganization (UNESCO) (including the Pashupatinathtemple, Boudhanath, Swayambhunath, palaceareas of Hanuman Dhoka, Patan, and Bhaktapur,Changu Narayan temple, and Lumbini). However,according to IUCN (1999) “the physical state of thecultural and heritage sites and the monuments inKathmandu Valley is fast deteriorating”. The culturaland heritage sites along rivers are the worst affected.Emergence of urban slums and squattersettlements in Nepal’s cities is relatively new and stillsmall in size compared with other cities in SouthAsia. There are no adequate data on slum dwellers inNepal nor is there a definition of “slums”. However,the number of squatter settlements in major urbanareas has been increasing in the last few years; it ismost conspicuous in Kathmandu Valley. In 1985 thenumber of squatter settlements in the Valley was 17with an estimated 3,000 inhabitants; this grew to 33with an estimated population of 15,000 in 1990(Pradhan 2004); and to 44 in 2002 (Baniya 2002).Pathibhara is the largest recorded squattersettlement with <strong>18</strong>7 households and 2000 familymembers. All these squatter localities and some ofthe core areas of Kathmandu are said to be slumsdue to lack of basic sanitation and utility facilities.The emergence and expansion of the squattersettlements has been encroaching upon riverbanks,public lands, lands belonging to temples or otherreligious/cultural sites, agricultural land, and forestareas.Urban InfrastructureRoads and TrafficIn 2000, the total road length in the urban areas ofNepal was 2,051 km, of which blacktopped, graveled,and earthen road lengths were 930 km, 600 km, and521 km, respectively (CBS 2002). There isconsiderable variation in the length and status ofurban roads in municipalities depending on their sizeand location. For example, Waling has only 8 km ofroad within its territory whereas Kathmandu has 800km (SWMRMC 2004). Some municipalities arecompletely devoid of blacktopped roads, and someare not even linked with the national road network.Urban traffic in Nepal is typically a mix of traffictypes including automobiles, cycle rickshaws(manual three-wheeler), bicycles, and even animaldrawncarts. The numbers and composition of trafficvary from municipality to municipality. Rickshawsand bicycles are most conspicuous in the Teraitowns, whereas cars and motorcycles make up over106 Environment Assessment of Nepal : Emerging Issues and Challenges
half of all motor vehicles in Kathmandu. Most of thegrowth in motor vehicle fleets is concentrated inKathmandu Valley. In March 2004, for example, thenumber of registered automobiles in Nepal was4<strong>18</strong>,910, of which about half were in KathmanduValley (DOTM 2005).Water SupplyIn 2000, about 78% of the people living in urban areashad access to an improved water supply within 15minutes of home (WaterAid Nepal 2004). However,there is significant variation in the coverage, servicelevel, and qualities of supplied water between andwithin urban areas. A survey conducted in 2002 innine municipalities outside Kathmandu showed thatpiped water supply coverage varied from 7% to 65%of households (Nippon Jogesuido 2002). Groundwateris the main source of water in the Terai and isgenerally adequate in terms of quantity; hill townsare served from surface sources and generally faceserious water availability problems. Quality ofsupplied water is quite often a concern; arseniccontent has become an alarming issue in many ruralwater supply schemes in the Terai, whereasbiological contamination is generally the mainconcern where surface water is used. Except for afew towns such as Dhulikhel, Damak, andMechinagar, water supplies are intermittent, withwater available only a few hours a day (<strong>ADB</strong> 2000).Inadequate quantity, non-uniform distribution ofwater, unreliability of supply, and high rate ofunaccounted for water (due to leakage and illegalconnections) are major issues related to watersupply in the urban areas of Nepal. The rate ofunaccounted for water is particularly high inKathmandu (IUCN 1999; <strong>ADB</strong> 2000).sewerage systems in Kathmandu, Lalitpur, andBhaktapur cover approximately 13,000 households(<strong>ADB</strong> 2000). A 2002 survey in nine small townsoutside Kathmandu revealed that, in general, onlyparts of town centers have storm drainage; some arecovered but most are uncovered (Nippon Jogesuido2002). In these towns, the total length of storm drainsvaried from 2 to 22 km. During the rainy season,drainage is a serious problem, particularly in theurban areas of the Terai.Solid WasteSolid waste is generally very poorly managed bymunicipalities in Nepal (<strong>ADB</strong> 2000). More than half ofthe municipalities have not even identified orproposed sites for land-filling their wastes, let alonecarrying out proper land-filling. In general, waste iscollected, transported, and disposed of bymunicipalities. Lack of resources—including humanresources, infrastructure, and equipment—is acommon problem faced by municipalities inattempting to manage solid waste. Siting andoperation of landfills is highly sensitive andcontroversial. Many municipalities have worked inpartnership with the private sector, nongovernmentorganizations (NGOs), and community groups inSanitation and DrainageIn 2000 sanitation coverage in urban areas of Nepalwas 67% of the population (WaterAid Nepal 2004).The provision of sanitation infrastructure is generallyvery poor: a significant proportion of the urbanpopulation outside Kathmandu is still not connectedto wastewater or sewerage systems. In smallertowns, households are either without sanitationfacilities or served by septic tanks or pits, or illegallyuse storm water drains as sanitary sewers.Wastewater treatment facilities are very limited, andwhere provided they suffer from chronic disrepair,maintenance, and operation problems, and are oftennon-functional. For example, three sewage treatmentplants in Bhaktapur and Lalitpur are not functioning.Sewerage systems, often combined with stormwater drainage systems, only exist in some urbanareas; and their coverage is limited. The combinedAbandoned Chamber Built for Burning Medical WasteNEFEJChapter 8: Urban Environment107
managing solid waste. They are particularly involvedin awareness, waste collection, and street cleaning.Some NGOs have piloted door-to-door collection,composting, and recycling (NEFEJ 2004). Oneemerging concern is the management of hazardouswastes. There is no clear state policy on this. Medicalwaste, obsolete pesticides, batteries, effluent, andbyproducts of industries are the main sources ofhazardous waste. Few health institutions haveautoclaves and incinerators: and where they existthey are quite often not in operation.Urban Environmental ConcernsSolid WasteQuantity and NatureThe municipalities of Nepal generate over 1,350 tonsof solid waste every day. Kathmandu alonegenerates 383 tons/day, slightly less than one-third ofthe total municipal waste. Household wasteconstitutes about 75% of municipal waste. Themunicipal waste varies from 0.11 to 0.93 kg perperson per day, with an average of 0.34 kg per personper day (SWMRMC 2004). The households on theoutskirts of the smaller towns (which, althoughfalling within the municipality boundary, are rural innature) reuse most of their waste for feeding animals(pigs and cattle).With the change in consumption patterns andlifestyle of urban inhabitants, the composition ofsolid waste has been changing over the years, fromtraditional organic materials to papers, plastics, glass,metals, and packaging materials. Even so, about twothirdsof municipal waste is still organic orbiodegradable although the composition varies frommunicipality to municipality. A recent study(SWMRMC 2004) showed the following averagecomposition of the solid waste generated inNepalese municipalities:(i) Organic material 66% by wet weight (with arange of about 39 to 95% from municipality tomunicipality);(ii) Metal, glass, paper, and plastic combined,20% by wet weight (range 5 to 50%); plasticalone constitutes 7.6% (range 1.6% to 21%);(iii) Inert material 9.6% (range 0 to 37%); and(iv) “Other” (including medical waste) about 5%.Management Practices and ConcernsSolid waste is the most conspicuous environmentalproblem across Nepal’s urban areas. According to<strong>ADB</strong> (2000), until the 1980s, municipal solid wastemanagement problems were negligible other than inKathmandu Valley—most of the waste generatedbeing organic and thus managed at the householdlevel.Sweepers clean the streets and open spaces,collecting the waste into roadside heaps usingbrooms, picks, shovels, and wheelbarrows; waste isalso picked up from roadside heaps or bins andtransported to disposal points by tractors and trailers,power-tillers, rickshaws, or other wastetransportation vehicles. However, the solid wastecollection rate is generally low. On average only 35%of municipal waste is collected; but rates vary fromabout 7% to as high as 86% from one municipality toanother (SWMRMC 2004). Disposal of waste ishaphazard. Even the capital city dumped wastealong the riverbanks until very recently. Almost allmunicipalities currently lack any landfill site; Pokharamunicipality started disposing of solid waste at alandfill site after a long negotiation with the peopleresiding in the neighborhood, and the Solid WasteManagement and Resource Mobilisation Centerrecently reached agreement with the local people todispose of the capital city’s waste at Sisdole for twoyears, by which time a long-term site is expected tobe ready at Okharpauwa.Sisdole Landfill Site for Kathmandu RefuseRandom and insanitary collection and disposalof urban solid waste in Nepal is the result of lack oflong-term perspective; deficiency in the planning,provision and operation of infrastructure; insufficientpublic lands that can be accessed for waste disposalpurposes; and absence of a holistic and integratedsystem for solid waste management. Solid wastemanagement is generally understood as sweepingthe street and dumping waste in places where itreceives no public opposition. Hence, waste iscommonly dumped on public land, forest,riverbanks, and other places ill-suited for thispurpose. Irregularity of collection is common, withheaps of garbage found piled up on the streets.NEFEJ108 Environment Assessment of Nepal : Emerging Issues and Challenges
Sanitary Landfill Site and Land-fillingLand-filling is a commonly used method for solid waste disposal. A landfill site is first selected considering presentuse and value of land; available area and potential life of landfill; the site’s soil and topography, geology, andhydrology; haulage distance; and settlements near the site. The selected site is developed into a proper landfill siteby providing drainage, access, and other structures and facilities necessary for a landfill operation. Operation involveslaying the waste in layers, compacting it, and covering it with earth at the end of each day’s operation. Many landfillsites around the world have been poorly engineered and operated, and hence face vociferous public opposition andcriticism for their adverse environmental impacts. The decomposition of the organic matter in a landfill site produceshighly polluting liquid, called leachate, and gases (mainly methane and carbon dioxide). Leachate can percolate down,causing groundwater pollution. Methane is a combustible gas and explosive when its concentration in air is between5% and 15%. Methane can accumulate below buildings or other enclosed spaces on or close to a landfill, posing riskof explosion. Other common concerns related to land-filling are odor; litter blown by the wind; scavenger birds, rodentsand insects attracted by the organic refuse; and dust and noise generated by the heavy trucks and equipment usedin transporting waste and operating the landfill.Because of the concerns arising from poor operation and management, siting and operation of landfill sites isa very sensitive public issue in Nepal. For a decade or so Kathmandu city has been facing a severe problem indisposing of its solid waste. In the early 1990s, people near the then-existing landfill site at Gokarna opposed thelandfill and obstructed its operation many times, resulting in waste accumulation on the streets of Kathmandu forseveral days, or inappropriate disposal of waste along the riverbanks. Later when the life of the Gokarna landfill sitewas finished, no other landfill site could be identified within the Valley due to public opposition, and Kathmandu’srefuse continued to be disposed of along the riverbanks. In 2005, authorities reached an agreement with local peopleto operate a short-term (2-year) landfill at Sisdol with a plan to prepare a long-term landfill site at Okharpauwa in thesame locality.Shortcomings in planning and design as well as poor operation and management are the primary causes ofpublic opposition to landfill sites. State-of-the art practice requires improvements in the way landfill sites are planned,designed, operated, and managed. A landfill site needs to have a buffer zone separating it from settlements and publicplaces, a liner should be placed at the bottom of the landfill site to control flow of the leachate to the groundwater,leachate should be collected and treated, and gases (particularly methane) need to be collected and either safelyvented or used as fuel, in addition to compaction and daily covering of the waste put in layers. Besides, waste maybe segregated into decomposable, reusable, recyclable, and the rest. Not all waste needs to be land-filled:decomposable waste can be converted into compost, and reusable and recyclable waste could be sold. Thedecomposable fraction of waste typically exceeds 60% in Nepal and is the one that produces leachate, gases, andattracts birds and insects. Separating this from the remaining waste not only reduces the volume to be land-filled(thus increasing the life of the landfill), but also reduces the chances of adverse environmental problems and publicopposition.Lalitpur MunicipalityOpen Dumping of Medical WasteSuch a state has many adverse environmentalconsequences. In the first place, it is aestheticallybad, causes bad smells, and is a nuisance to thepublic. Refuse also attracts animal scavengers andpests, can be a breeding place for disease-vectors,and can be hazardous to human health. Uncollectedrefuse gets into drains and blocks them, causingdisruption to drainage and sewerage systems.Irregular collection encourages people to burn wastewhich contains plastics and chemicals—the resultingemissions have long-term health implications. Therefuse also produces leachate that can contaminatesurface water and groundwater if not handledproperly. Haphazard solid waste collection is also asource of air pollution. Overall, unmanaged solidwaste not only causes significant adverse impacts onpublic health and the environment but alsodeterioration in the quality of life of people.Chapter 8: Urban Environment109
In most municipalities, hazardous wastes arecommonly mixed and dumped along with municipalwaste. Most commonly, industrial waste is eitherburned, dumped, drained in a river, or mixed withmunicipal waste. Similarly, hospital waste is eitherburned in a chamber within the hospital compoundor mixed with municipal waste (SWMRMC 2004).Mixing such wastes with municipal waste rendersthe latter hazardous and potentially infectious.Solid waste in Nepalese urban areas could bebetter managed by adopting a more holistic andintegrated approach that internalizes the concept ofthe 3Rs (reduce, reuse, and recycle). Some elementsof this have been tried on a limited scale in Nepal,although these remain unguided, uncoordinated, orisolated and out of the mainstream solid wastemanagement practice. For example, there areseveral small-scale recycling industries using wasteplastics as raw materials, and paper is recycled in apaper mill and also by some NGOs (NPC and UNDPundated). Scavengers collect beverage bottles,which are mostly reused, and metal scraps, whichare recycled in factories in India and Nepal.Bhaktapur municipality has been composting itssolid waste for some time now; a compost plant ofabout 13 tons/day was operational until a few yearsback in Kathmandu, and several NGOs andcommunity groups in different urban areas haveinitiated door-to-door waste collection and smallscalecomposting, including vermi-composting aswell as briquette production (NEFEJ 2004). All theseindicate that waste can be converted into a resource,provided the right policy and approach are followed.Water PollutionWater pollution is a serious environmental issue inNepalese urban areas. Pollution of water bodies suchas rivers, lakes, ponds, groundwater, and drinkingwater supplies are common.Deficiency in wastewater and solid wastefacilities and their mismanagement have oftenresulted in pollution of surface and groundwater.Using storm water drains as sanitary sewers is awidespread practice in Nepal. Sewerage systems,often combined with storm water drainage systems,exist in a number of urban areas such as in greaterKathmandu and Bhaktapur, although their coverageis inadequate and they are in a poor state ofmaintenance. Greater Kathmandu and Bhaktapurare the only urban areas with sewage treatmentplants; however, these plants are not functioning andthe untreated sewage is discharged directly intorivers. Major polluting industries, such as tanneries,sugar, paper, canning, cement, breweries, andpharmaceutical industries, are invariably located inor near urban areas and often dispose their waste,Solid Waste Management by an NGOThe Women Environment Preservation Committee(WEPCO) is a nonprofit NGO formed in 1992 by a groupof enthusiastic women from Kupondole, Lalitpur. From itsbeginning, WEPCO has been actively and continuouslyinvolved in solid waste management in the Kupondole areaof Lalitpur Municipality. The solid waste management itpractices and promotes is more than just collection anddisposal of waste; it incorporates the concept of recyclingand converting waste into resources. WEPCO provides doorto-doorwaste collection service to about 80% of the areahouseholds, for which each household pays a monthlycharge. The biodegradable fraction of the waste isconverted into organic compost. WEPCO also recyclespaper collected from different sources. WEPCO has shownan example on a small scale of how “waste” may be bettermanaged by also considering it as a “resource”. WEPCO isalso active in training and disseminating the experiencesand lessons learned to other NGOs and community groups,raising community awareness on the 3Rs, and promotingcomposting at household level. WEPCO is working inpartnership with Lalitpur Municipality and the private sector.In recognition of the work done, WEPCO was awarded theMOPE Environment Award 1996, UNEP Global 500Environment Award 2003, and World Wild Fund for Nature(WWF) Nepal Program Abraham Conservation Award 2003.(Source: personal communication with WEPCO).Stream Changed into a Sewer in KathmanduNEFEJ110 Environment Assessment of Nepal : Emerging Issues and Challenges
Bagmati River PollutionThe Bagmati River with its tributaries—the Bishnumati, Manohara, Dhobikhola, Icchumati (Tukucha), Nakkhu,Hanumante, Karmanasa, and Godavari—is the main river in Kathmandu Valley. The Bagmati River system is extremelyimportant for both the Valley and downstream areas. The river system has been the Valley’s main source of water fordrinking and irrigation, and an important component of its ecosystem. It also has tremendous religious, cultural, and socialsignificance—the river is worshipped by millions of Hindus in Nepal and India. Several temples (including Pashupatinath),ghats, and maths are located along the banks of the Bagmati River and its tributaries. People perform various religious andcultural activities and rituals, and take holy ablution there. It is often referred to as the Ganges of Nepal.Over the last few decades, the Bagmati’s condition has gradually deteriorated and it has become the most pollutedriver in Nepal. Direct disposal of untreated sewage and throwing garbage into the river system, withdrawal of sand, tappingriver water to meet the water demand of the increasing population as well as of the increasing number of factories, andencroachment of the river banks are the main causes of the degradation and extreme pollution. During the dry season, thevolume of water is so reduced and the river is so polluted that it looks like an open sewer. One study conducted by theEnvironment and Public Health Organization (Dhakal 2003) showed that the chemical oxygen demand (COD) is in excessof 400 mg/l within the city and immediate downstream areas. This is alarming, as the normal COD of river water is around40 mg/l. However, as the river flows out from the Valley, the pressure on it reduces considerably and due to natural selfpurificationprocesses, the COD is reduced to 25 mg/l by the time it reaches Gaur in Rautahat.The effects of this extreme pollution are many. The most visible is aesthetic: a highly polluted, sewage-filled, blackstream flowing through the heart of the city obviously destroys the city’s beauty. Pollution has also affected cultural andreligious activities and rituals—ritual bathing is almost a thing of the past, and people do not use river water even whenperforming puja. The health of the people living along the banks is also at risk. Villagers immediately downstream ofKathmandu have now stopped using the river water for irrigation, and fishermen have stopped their traditional occupation,as there are no fish left in the river. The river is almost dead, and aquatic life is almost nonexistent when the river reachesChobhar area (Dhakal 2003; Phuyal 2003).including toxic waste, to roadside drains and openspaces. The only industrial wastewater treatmentplant, at Hetauda, often encounters operationaldifficulties (<strong>ADB</strong> 2000; IUCN 1992). Thus, the rivershave become major places for disposal of untreatedsewage and industrial effluents, as well as urbansolid waste dumping. This is the principal cause ofsurface water pollution. As a result, many rivers inurban areas have practically become open sewers,especially during the dry season. The adverse effectsof this are many, such as eutrophication affectingriver ecology and aquatic life, and making the waterunfit for most human uses including bathing andirrigation. The effects are not confined to urbanareas, but can be felt for long distances downstream.Groundwater in most urban areas iscontaminated due to seepage from pits and septictanks, and open defecation. Studies of water qualityfrom shallow aquifers throughout Nepal have foundthat the fecal coliform contamination consistentlyexceeds World Health Organization (WHO)guidelines for water for human consumption (<strong>ADB</strong>2000).Drinking water supplies are often pollutedthrough runoff into storage sites or cross-leakagesbetween overloaded sewer lines and water pipes(IUCN 1991). Sewage is the primary cause of drinkingwater pollution. Nearly one-third of the urbanpopulation of Nepal do not have direct access to apiped water supply. The availability of improvedWaste Dumping along the Bagmati River in Kathmanduwater supply, including non-piped, within 15 minutesof walking distance is nearly 80% (WaterAid Nepal2004; CBS 2004). Even those with access do notnecessarily have adequate water. The quantity ofwater delivered by the water supply system is mostlybelow 50 liters per capita per day and the qualityoften falls below WHO recommendations (<strong>ADB</strong>2000), mainly due to bacteriological contaminationcaused by poor sanitation facilities. Unservedhouseholds obtain water from traditional watersources such as wells, rivers, springs, or ponds.These sources are typically unprotected, and waterquality is usually poor. Water pollution is the mostserious public health issue in Nepal. Contaminateddrinking water and lack of sanitation facilities resultB. PradhanChapter 8: Urban Environment111
in worsening public health conditions, deterioratingquality of life, and increased economic costs tosociety. While this affects people of all income levels,the poor are most vulnerable. They have fewresources or alternatives to protect themselves fromsuch adverse impacts as seasonal drying out ofsurface water sources, pollution of groundwater, orspread of sanitation-related diseases.DrainageDrainage to cope with surface runoff is oftendeficient in Nepalese urban areas. This is mostevident during the rainy season; the limited lengthsof drains that exist in urban areas are often filled withwaste, including plastics and dirt. As a result, thesurface runoff either infiltrates the ground or flowsinto natural drains through streets and lanes, leavingthe towns muddy and dirty. Urban areas in the Terai(where the natural gradient is very flat) oftenexperience serious drainage problems: flooding andrise in groundwater tables are common. This rendersthe existing wastewater disposal system ineffective.These deficiencies obviously pose a serious threat tothe health and sanitation of the residents. Hillmunicipalities also suffer from lack of drainage,although to a lesser extent than the Terai towns.According to <strong>ADB</strong> (2000), more than 25% ofhouseholds of greater Kathmandu and 32% of thoseof Bhaktapur suffer frequent flooding.Air PollutionAir pollution is emerging as a serious concern in themajor urban areas of Nepal in general and inKathmandu Valley in particular (see Chapter 7). Thedeterioration in urban ambient air quality resultsfrom vehicular emissions, industrial emissions,burning solid waste including plastics, constructionwork, poor maintenance and narrow roads, andadulteration of fuel. In urban areas total suspendedparticles (TSP) and PM10 (particulate matter smallerthan 10 micrometers in diameter) are the majorconcerns. Other pollutants such as SO 2 and NO x arealso increasing although still below Nepal’s AmbientIndustrial Air Pollution, KathmanduNEFEJAir Quality Standards and WHO guideline levels. Inareas where traffic is high, TSP and PM10 generallyexceed national and WHO guideline values. Thisindicates that the major source of TSP and PM10 isroad traffic; the condition of vehicles and of the roadsurface are contributing factors in addition to thetype and quality of fuel. Industries probably follow asthe next major source of urban air pollution.Air quality monitoring in Kathmandu shows thatthe air is routinely not clean enough to breathe inplaces like Putalisadak, Patan, and Thamel. Pollutionalso regularly obstructs the visibility levels of thescenic landscape of the Himalayas. According to astudy, the number of foggy days in Kathmandu hasincreased from about 35–40/year in 1970 to more than60/year in 1993, the most recent year for which reliablestatistics are available (URBAIR 1996). KathmanduValley is particularly vulnerable to air pollution due topoor dispersion chances in its bowl-shapedtopography. In the smaller urban areas, indoor airpollution resulting from use of biomass fuel, firewood,cow dung cake, and crop residues is at present ofmore concern than outdoor air pollution.Adverse effects of air pollutants on humanhealth can be acute or chronic. Respiratory infectionis among the top five diseases in Nepal, occurringmainly due to prolonged exposure to smoke and dust(CBS 1998). Acute respiratory infections (ARI)continue to be one of the leading causes of deathamong young children, causing over 30% of deaths inchildren under five years of age (DOHS 2001). InKathmandu Valley, 3.6% of the respiratory diseasesamong children are estimated to be caused by TSP(IUCN 1999). Air-pollution-related ailments such aspneumonia, bronchitis, and asthma are nowbecoming very common in Kathmandu Valley (IUCN1999).Traffic CongestionThe number of motor vehicles in the larger urbancenters has increased rapidly in recent years. Thishas not been matched by provision of roads andinfrastructure, leading to persistent trafficcongestion, particularly in Kathmandu Valley towns.Urban development is taking place without adequateplanning or provision of transport infrastructure, andwith inadequate consideration of the nature andcomposition of the traffic. Urban roads arecommonly narrow and crooked, and the roadnetwork function is poor. There is no or insufficientparking space. The mixture of vehicle types, poordriving, bad parking, and roadside trading add totraffic congestion. The consequences of this arelonger travel times, greater levels of air and noisepollution, and less efficient fuel consumption (<strong>ADB</strong>2000; Adhikari 1998; UNEP 2001).112 Environment Assessment of Nepal : Emerging Issues and Challenges
Noise PollutionNoise is becoming a significant form of pollution inurban areas. It is a public nuisance and affectspeople’s health physically and psychologically (byincreasing irritation, tension, nervousness, andanxiety). Transport noise, industrial noise, and communityor neighborhood noise represent the leadingforms of noise pollution in Nepal (IUCN 1991).Prolonged exposure to high noise levels may causepermanent hearing loss. Industrial noise is also asignificant occupational hazard. Many noise-sensitivesites such as colleges and hospitals are also subjectto much higher levels of noise than acceptable.Like air pollution, noise is on the increase inmunicipal and industrial areas. Sources of significantnoise include traffic, industries, use of heavymachines and tools in construction and commercialactivities, and use of loudspeakers for prayer in theearly morning hours. Conflicting land use in urbanareas has contributed to noise pollution whereresidential use is mixed with noise-causing industries(<strong>ADB</strong> 2000). Transportation is one of thepredominant sources of noise pollution. Powertillers, buses, heavy trucks, and three-wheelers aresignificant contributors to noise pollution inmunicipal areas (UNEP 2001). Road traffic noiselevels in Kathmandu range from 70 to 100 decibels(dBA). The noise level in industries such as textile,metal works, cement, and flour mills is very high,with noise levels exceeding 90 dBA (IUCN 1999).People living around airports are subject to highlevels of noise produced by aircraft.Impacts on Heritage Sites, Open Spaces,and Agricultural LandIn the urban areas of Nepal, open spaces traditionallyexist in the form of public/community spaces aroundcultural and heritage sites as well as in religiousforested clumps and pond areas. In many smallertowns, open space also provides fortnightly, weekly,or bi-weekly market sites. Provision of public parks,playgrounds, and green open space, although foundin a few urban centers, is not common in Nepal’surban planning and development.Traditional open spaces are treated as “noman’s land”. Heritage sites and open spaces areunder increasing pressure as haphazard urbanizationcontinues. The historical and cultural sites aredeteriorating due to pollution, emerging building hasdefaced historical and cultural monuments, andencroachment of the open space and premises ofthese sites is common (HMG/UNDP 1994; Adhikari1998; IUCN 1999).Urbanization invariably brings about land-usechange. Loss or degradation of fertile agriculturalland as a result of unguided urban development is along-term concern. Urban areas of Kathmandu Valleyhave expanded at the cost of agricultural land.According to Karki (1998), between 1984 and 1994,the urban area in the valley increased from 3096 hato 8378 ha and 5282 ha of fertile agricultural land waslost in the process of unplanned urbanization. If thistrend continues, by the year 2020, all the primeagricultural land in Kathmandu valley will beurbanized. The loss of agricultural land inKathmandu Valley is an important indication of whatmay happen in other urban areas as they growhaphazardly.Policies and InitiativesPolicyThere is no specific policy for the urban sector inNepal, although the significance of the urban sectorrises consistently. Urban development ismultisectoral and the urban policy thrust can bederived from the sectoral policies. The sectoralpolicies, plans, and related legislation andregulations provide a basic framework for urbandevelopment and environmental safeguards in urbanareas. Some relevant legislation and policies includethe following:(i) Local Self-governance Act 1999: empowersmunicipalities to administer and managelocal resources, and to prepare andimplement programs. The Act is intended todevelop municipalities as self-governingautonomous urban local bodies playing aneffective role in overall urban development.(ii) Town Development Fund Act 1997: facilitatesfinancing of urban infrastructure projects inmunicipalities or urbanizing villages.(iii) Solid Waste Management and ResourceMobilisation Act 1987: regulates collection,recycling, and disposal of solid waste inmunicipal areas.(iv) Industrial Enterprises Act 1992: controls theestablishment of industries and regulateslicenses for establishment, expansion, andmodernization of industrial enterprises.(v) Environment Protection Act 1996: requiresenvironmental assessment of proposedprojects, empowers the Government toprovide incentives to any activity that haspositive impacts on the environment, andhas provisions for polluters to compensatepersons suffering from polluting activities.(vi) Ancient Monument Protection Act 1956:protects ancient monuments and otherChapter 8: Urban Environment113
objects of archaeological, historical, andartistic importance, and empowers theGovernment to declare any area where anancient monument is located as a ProtectedMonument Zone.(vii) Nepal Drinking Water Supply Corporation Act1989: sets up Nepal Drinking WaterCorporation, a body responsible forsupplying clean drinking water tomunicipalities and to areas specified by theGovernment, and to manage drainagesystems in municipal areas.(viii) Local Administration Act 1971, LandAcquisition Act 1977, and Vehicle andTransport Management Act 1992 haveprovisions that are relevant for urbanmanagement.(ix) The National Solid Waste ManagementPolicy, National Water Supply and SanitationPolicy, and Shelter Policy are important in theplanning, development, and management ofurban infrastructure.(x) The Nepal Urban Sector Strategy 2000 is animportant step towards recognizing theincreasing significance of urban areas inNepal.While these policies and legislation provide abasic framework for urban planning andmanagement as well as environmental safeguards inurban areas, there are difficulties at theimplementation level. First, these acts need to bestreamlined, made coherent, and ambiguitiesremoved. Provision of urban infrastructure in Nepalhas been largely driven by central institutions such asthe Nepal Water Supply Cooperation; Department ofRoads; Solid Waste Management and ResourceMobilisation Center; Nepal TelecommunicationsCorporation; and Nepal Electricity Authority. Asresponsibilities are scattered and many agencies areinvolved in the planning, provision, and managementof urban infrastructure and services, coordination isextremely difficult. Institutional confusion arisingfrom provisions in various legislations regarding theresponsibilities, authorities, and handling ofresources is a prominent issue. Urban developmentand management in Nepal lack an integrated holisticapproach, and long-term vision. Recently, afterenactment of the Local Self-Governance Act,municipalities are being increasingly empowered tomanage their urban areas and to assume the urbangovernance role. The municipalities, however, aregenerally constrained by a lack of capacity andresources. As a result, urban areas of Nepal continueto grow spontaneously and haphazardly.At present there is no information availableregarding the level of investment by municipalities inthe environmental and infrastructure sectors.However, solid waste management, building drains,and plantation are some areas in whichmunicipalities commonly invest.Lack of financial resources is a criticalconstraint currently faced by Nepalesemunicipalities. Local development fees (LDF) andgrants are the two major sources of revenue formunicipalities (Table 8.3). LDF are collected by thecentral Government and transferred to themunicipalities through the Ministry of LocalGovernment. Almost all municipalities are highlydependent on LDF and grants; they are generallyweak in mobilizing local revenue sources. Bhaktapurmunicipality has introduced a “Tourist Entry Fee”,which generated more than 44% of its revenue in oneTable 8.3: Consolidated Revenues and Ex penditures of Municipalities FY 2004RevenueExpenditureOwn sourceHeading Amount (NRs‘000) Heading Amount (NRs‘000)Current/administrativeLocal development fee 986,099 Salaries 465,030House/land and propert y tax 142,044 Allowances 55,873Other tax revenue 109,072 Services 52,978Fees and fines 359,770 Fuel 50,538Property rental 82,666 Contingencies 63,549Other revenue 85,841 Other 147,043Miscellaneous income 63,370 Debt payment 62,478Grants (HMG, D DC,TDF, and other) 288,986 Social program 243,991Loans 26,348 Ordinary capital (furniture, equipment) 35,150DDC = District Development Committee, HMG = His Majesty’s Government of Nepal, TDF = Town Dev elopment FundSource: Chhetri and Pradhan (2005)Capital investment (Public expenditure) 983,523114 Environment Assessment of Nepal : Emerging Issues and Challenges
Land Pooling for the Proposed Outer Ring Road in KathmanduHis Majesty’s Government of Nepal and the People’s Republic of China recently agreed to construct an “outer ring road”(approximately 66 km in length) in Kathmandu Valley. The current ring road was constructed 30 years ago also withChinese assistance. The outer ring road (ORR) is expected to connect old settlements of Kathmandu Valley, provide spacefor a bulk supply line for the Melamchi Water Supply Project and for electricity transmission lines, and at the same timerelieve traffic pressure in the main city areas by providing alternative by-passes. The road will have 60 m as right of way;space will be reserved for fast-track vehicles, bicycle track, water supply and electricity lines, and a green belt. Over 325ha of land is thus required. Acquiring this land giving compensation at market rates would be too costly, and at the sametime acquisition would take a long time due to compliance with the acquisition and compensation process. Keeping this inmind, a “land pooling” approach has been proposed to readjust the land with participation of the affected people.Land pooling is a participatory process of land readjustment and development that has been practiced for urbanexpansion in Nepal for the past few years. Using this approach, a corridor of 560 m width (250 m left, 250 m right, and60 m wide road) will be temporarily taken from landowners for development purposes. The land will be developed providingaccess, constructing basic infrastructure, and separating space for the road, service track, open spaces, and bicycle track.The land owners will contribute the space proportionately, based on defined criteria, and in return will receive developedplot(s) of land. The project expects that obtaining the land required for the road through land pooling in the 560 m corridorwould help control urban sprawl, as the returned land would be developed. Critics of the project, however, feel that theouter ring road will further damage Kathmandu Valley by stimulating uncontrolled urban sprawling as has been done by theexisting ring road constructed three decades ago.Source : Personal communication with Mr. Kishore Thapa, Project Manager, Outer Ring Road Land Development Project; Devkota and Ghimire (undated); Joshi(2004); DUDH (2005)year (Chhetri 2004; Chhetri and Pradhan 2005).Nepal’s accession to the World Trade Organizationmay require abolishing LDF, as this is against thespirit of the Organization. In the absence of LDF,municipalities will have further financial difficultiesand many may be unable to cover administrativeexpenditures. Strengthening the financial resourcesof municipalities should therefore be at the top of theagenda of empowering and strengtheningmunicipalities to meet environmental responsibilities.There have been attempts in the past at planneddevelopment of urban areas. For example, Rajbiraj,Dipayal, Birendranagar, and Bharatpur were initiallyplanned, but planning control quickly disappearedand they soon began to take haphazard routes togrowth (Adhikari 1998). Tikapur town planningscheme, the only comprehensive effort to plan a newtown in Nepal, was never implemented asenvisioned (Adhikari 1998). Although master plansfor Kathmandu have been prepared, implementationof these has been weak and generally unsatisfactory.Structure plans were prepared between 1988 and1991 for all the 33 municipalities of the time.However, these were not adequate as the contentwas limited to general policy statements and detailswere not worked out (Joshi 2000).Guided Land Development and Land Poolingare two notable government initiatives to plan andguide urbanization of some municipalities. Theseaim to facilitate adjustment of land plots in aparticipatory process so that space is provided forurban infrastructure—roads, water supply, drainage,electricity, and telephone. Integrated action planningis also practiced in several municipalities as anapproach to planning urban areas by the people wholive there. Community meetings are the cornerstoneof this approach. Other features are mobilization andparticipation of the community in the identification,prioritization, and programming of municipaldevelopment activities and making the planningprocess more people oriented (Thapa undated;personal communication with the agenciesconcerned). Urban Development through LocalEfforts is an initiative to strengthen municipalities intheir roles and functions, and to promoteparticipation by the people (UDLE 1992). There areseveral small-scale isolated initiatives in improvingurban quality, e.g., in converting wastes intoresources, and improving greenery (NEFEJ 2004).Future DirectionsThe urban environment is broad and integrated andtherefore urban environmental management shoulduse a broad integrated perspective, rather than theconventional narrow approach of dealing withsectoral issues separately. There are obvious linkagesamong various urban infrastructures and services;synergistic positive effects could be enormous ifthese were to be integrated and coordinatedproperly. For example, solid waste management islinked with air pollution, functioning of drainage,public health, and aesthetics. A truly integrated andholistic approach should be promoted if urbanChapter 8: Urban Environment115
Min BajracharyaB. PradhanVehicles are a major source of urban pollution: clockwise from top-bus in Kathmandu; protesting against pollution;clean SAFA temposNEFEJ116 Environment Assessment of Nepal : Emerging Issues and Challenges
environmental planning and management are tosucceed in making urban areas better places to live.Obviously, this should not be limited to integratedand coordinated provision of infrastructure andservices, but also include wider concepts ofintegration. It is necessary to:(i) introduce land-use planning with dueconsideration to environmental attributesincluding urban ecology and heritage;(ii) integrate and coordinate planning andmanagement of urban infrastructure andservices;(iii)promote waste reduction, reuse, andrecycling and other environmentally friendlypractices;(iv) raise awareness of people regardingenvironment, health, and appropriatepractices and behaviors;(v)promote participation and partnership withpeople, communities, NGOs, communitybasedorganizations, the private sector, andcivil society in environmental planning andmanagement;(vi) address urban poverty and needs of theurban poor; and(vii) introduce the “polluter pays” principle.Most past efforts in planning and providingurban infrastructure and services have beensectoral—uncoordinated rather than integrated.Important lessons regarding urban environmentalmanagement in Nepal can be derived from pastactivities including planning approaches and donorsupportedprograms as well as small-scaleenvironmental activities of NGOs. The latter includeconverting wastes into resources (throughcomposting, making briquettes from waste, paperrecycling, management of solid waste bycommunities), promoting alternative approaches towaste/sewage treatment, and addressing the needsof the urban poor including those in slums andsquatter communities. The informal sector can playan important role in urban life and livelihoods.Integrated urban management should also includestrengthening this sector.Municipalities, local bodies, and competentauthorities must be strengthened if integrated urbanenvironmental management is to be achieved.Appropriate tools, and human and financialresources must all be developed. Clear urbandevelopment policies and legal frameworks may benecessary for promoting land-use planning,participation by the stakeholders, and ensuringcoordination and cooperation.Quite often environmental problems arepolitical and economic, arising not from shortage ofenvironmental resources (e.g., land or fresh water)but from political or economic factors that inhibitcertain groups’ access to them. Most environmentalproblems cannot be solved without effective localinstitutions. In the long run, a competent,representative, inclusive, and democratic localgovernment is the key for effective proactiveenvironmental management in urban areas.Decentralization and empowering municipalgovernance are the top priorities if disjointed sectoralactivities are to be coordinated under an able,technically competent, and financially viable urbanmanagement and development authority. To date,power lies with sectoral line agencies which controlresources and influence legislation. This centralcontrol has not worked satisfactorily and is unlikelyto improve in future. It is therefore essential fordevolution of authority to take place in a veryfundamental way, ensuring transfer of power andresources to local units, enhancing municipalcapacity, ensuring participatory processes to workingwith communities, and fostering partnership withNGOs and the private sector.BibliographyAsian Development Bank (<strong>ADB</strong>). 2000. TechnicalAssistance Final Report on Nepal Urban SectorStrategy, Volume 1: Main Report. Kathmandu: HisMajesty’s Government of Nepal, Ministry of PhysicalPlanning and Works, Department of Housing andUrban Development, and Asian Development Bank .Adhikari, A. P. 1998. Urban and Environmental Planning inNepal—Analysis, Policies and Proposals.Kathmandu: The World Conservation Union (IUCN).Baniya, I.C. 2002. “Problems, Prospects and PolicyMeasures in Slums and Squatters: A Case Study ofJagriti Tole and Hyumat Tole, Kathmandu.” ASeminar Report, Department of Architecture andUrban Planning, Institute of Engineering,Kathmandu.Central Bureau of Statistics (CBS). 1998. A Compendium onEnvironment Statistics 1998. Kathmandu.———.2002. A Hand<strong>book</strong> of Environment Statistics, Nepal2002. Kathmandu.———.2004. Hand<strong>book</strong> of Environment Statistics 2003.Kathmandu.Chhetri, R. B. 2004. “Pros and Cons—Nepalese MunicipalFinance.” Unpublished report, Urban DevelopmentThrough Local Efforts Project, German TechnicalCooperation (GTZ), Kathmandu.Chhetri, R. B., and S. Pradhan. 2005. “Financial Analysis ofNepalese Municipalities (1999/2000 to 2003/04).”Unpublished report, Urban Development ThroughLocal Efforts Project, German Technical Cooperation(GTZ), Kathmandu.Chapter 8: Urban Environment117
Department of Health Services (DOHS). 2001. AnnualReport 2000/01. Kathmandu.Department of Transport Management (DOTM). 2005.Unpublished data accessed from record files,Department of Transport Management, Kathmandu.Department of Urban Development and Housing (DUDH).2005. “Outer Ring Road Land Development Project-Concept Paper.” Third draft (unpublished), HisMajesty’s Government of Nepal, Ministry of PhysicalPlanning and Works, Kathmandu.Devkota, N. and D. Ghimire. Undated. “Outer Ring Road inthe Kathmandu Valley—Part of Development Plan ora Plan in Itself?” Unpublished report, Kathmandu.Dhakal, S. 2003. “Bagmati Under Threat.” Spotlight (23)1June 27–July 03. Available: http://www.nepalresearch.org/archive/ nature/pollution/archiveHis Majesty’s Government of Nepal (HMG) and UnitedNations Development Programme (UNDP). 1994.“Urban Environment Program: Main <strong>Document</strong>.”Unpublished report, Environment ProtectionCouncil, Urban Environment ManagementCommittee, Ministry of Housing and PhysicalPlanning, Kathmandu.IUCN (The World Conservation Union). 1992.Environmental Pollution in Nepal: A Review ofStudies. Kathmandu: His Majesty’s Government ofNepal, National Planning Commission-NationalConservation Strategy Implementation Programme.———.1999. Environmental Planning and Management ofthe Kathmandu Valley. Kathmandu: His Majesty’sGovernment of Nepal, Ministry of Population andEnvironment.Joshi, J. 1999. Housing and Urban Development in Nepal:Analysis and design of participatory developmentprocess. Kathmandu: Lajmina Joshi.———.2000. Planning for Sustainable Development: UrbanManagement in Nepal and South Asia. Kathmandu:Lajmina Joshi.Joshi, P.S. 2004. “Future of Kathmandu Valley—ThePlanning Initiatives, Containment Policy andProposed Outer Ring Road.” In Voices of Cities, 4(2)edited by B. Mainali, Municipal Association of Nepal,Kathamandu.Ministry of Law and Justice (MOLJ). 1999. Local Self-Governance Act 2055 (1999). Kathmandu.National Planning Commission (NPC) and United NationsDevelopment Programme (UNDP). undated.“Sectoral Reports for Sustainable DevelopmentAgenda for Nepal.” Draft report. His Majesty’sGovernment of Nepal, National PlanningCommission and United Nations DevelopmentProgramme, Kathmandu. Available:http://www.scdp.org.np/sdanNepal Forum of Environmental Journalists (NEFEJ) andEnvironment Support Fund (ESF). 2004. ProjectCompletion Report. Environmental Support Fund forNon-Governmental Organisations and Community-Based Organisations in Nepal, Kathmandu.Nippon Jogesuido Sekkei Co Ltd Japan et al. 2002. “Urbanand Environmental Improvement Project Nepal.”Final Report: Volume I Main Report. Kathmandu,Asian Development Bank and His Majesty’sGovernment of Nepal, Ministry of Physical Planningand Works, Department of Urban Development andBuilding Construction.Phuyal, S. 2003. “How Have-nots are Forced to Pay forCrimes of Haves.” Kathmandu Post, June 1.Available: http://www.environmentnepal.com.np/articles_d.asp?id=133Pradhan, P.K. 2004. “Population Growth, Migration andUrbanisation, and Environmental Change inKathmandu Valley, Nepal.” In Environmental Changeand its Implications for Population Mitigation editedby J. Unruh, M. Krol and N. Kliot Kluwer TheNetherlands: Academic Publishers.Sharma, P. 2003. “Urbanisation and Development.” InPopulation Monograph of Nepal Volume I.Kathmandu: His Majesty’s Government of Nepal,Central Bureau of Statistics.Solid Waste Management and Resource Mobilisation<strong>Centre</strong> (SWMRMC). 2004. “A Diagnostic Report onState of Solidwaste Management in Municipalities ofNepal.” Final Report. Lalitpur.Thapa, Kishore (N.D.). “Urban Land Pooling Policies inNepal and Experiences in Implementation,Kathmandu, Nepal.” Unpublished.Urban Development Through Local Efforts (UDLE). 1992.Urban Environmental Guidelines for Nepal.Kathmandu: Urban Development Through LocalEfforts Project, German Technical Cooperation(GTZ).United Nations Environment Programme (UNEP). 2001.Nepal: State of the Environment 2001. Bangkok:United Nations Environment Programme, RegionalResource Center for the Asia Pacific.URBAIR. 1996. Urban Air Quality Management Strategy inAsia, Kathmandu Valley Report. The InternationalBank of Reconstruction and Development/ TheWorld Bank, Washington DC.WaterAid. 2004. The Water and Sanitation MillenniumDevelopment Targets in Nepal: What do they mean?What will they cost? Can Nepal meet them? Lalitpur.1<strong>18</strong> Environment Assessment of Nepal : Emerging Issues and Challenges
Chapter 9Environmental GovernanceIntroductionGovernance is traditionally understood to meancontrol, rules, or administration by a state oversociety by the former exercising its power todirect, manage, and regulate citizens’ activities in thebest interest of the country. The United NationsDevelopment Programme (UNDP) definesgovernance as the “exercise of economic, politicaland administrative authority to manage a country’saffairs at all levels” (UNDP 1997). The quality ofgovernance depends on the capacity and vision ofthe Government to design, formulate, implement,and monitor policies and to perform its duties.Good governance is participatory, peopleoriented,and involves government bodies, privatesector agencies, social groups, communities, and thecivil society at large in the process.It is transparent and accountable andhonors rights of the people to participate inthe decision making that affects their life.Critical aspects of governance denotedifferent aspects of good governance. It iseffective in making the best use ofresources and it is equitable. It promotesthe rule of law (UNDP 1997).Good governance controls the misuse of naturalresources and promotes their sustainable managementand use. Good governance encourages localleadership and decentralization of power to thegrassroots level and builds local capabilities. Goodgovernance promotes sustainable economicdevelopment that is linked with the sustainability ofthe natural environment, and promoting conservationand sustainable use of natural resources tomeet present needs without compromising theneeds of future generations. Good governanceincludes implementation and evaluation of acountry’s commitments to different internationalenvironmental conventions, treaties, and protocols ithas signed. It includes mobilization of requisiteresources from different sources.Environmental Governance inNepalEnvironmental governance in Nepal includes keyelements of environmental policy and strategyplanning; development and implementation of plansand programs at national and local levels;development and enforcement of environmentallaws and regulations, norms, and standards; andestablishment and operation of environmentalinstitutions that supervise, execute, and monitor allaspects of the process. The judiciary impartsenvironmental justice to the citizens and safeguardsthose rights.Environmental Policies, Plans, andPrograms in NepalPlanned development in Nepal has been ongoingsince introduction of the First Five Year Plan in 1956.Since then, ten periodic national development planshave been implemented—one for three years(1962–1965) and the others for five years each. Themost recent one, the Tenth Plan, covers the periodfrom 2002 to 2007. 1The National Planning Commission (NPC),which is the agency responsible for formulating plansand policies on national and sectoral development,guides all socioeconomic development planning inNepal. The 10th Five-Year Plan (2002–2007), clearlystates that poverty reduction is and remains thecornerstone development objective of Nepal.Whenever possible, the NPC has attempted tointegrate environmental issues with sustainabledevelopment and poverty reduction. Nepal hasalways recognized the value of protecting its naturalresources. From the beginning of the 8th plan period(1992–1997), environmental issues have beenconsistently included in Nepal’s socioeconomicdevelopment plans.1Planning is carried out recording to the Nepali year, which starts and ends around mid <strong>April</strong>. Thus, for example, the plan for 2002 to 2007 is for five years from mid<strong>April</strong> 2002 to mid <strong>April</strong> 2007.Chapter 9: Environmental Governance119
Table 9.1 describes the major highlights ofNepal’s socioeconomic development plans from theenvironmental perspective.The first three plans focused on naturalresources conservation From the 4th Plan onward,environmental concerns were incorporated insectoral policies. However, from the 5th Plan—theperiod following the 1972 Stockholm Conference, inwhich Nepal had participated—actions onpreventing environmental degradation wereinitiated. During the 6th and 7th Plans, more concretesteps were taken towards safeguarding theenvironment through enforcement of environmentalpolicies, encouraging participation of the privatesector, civil society, and women’s groups. From the8th Plan period (1992–97) and especially followingthe Earth Summit on Environment and Sustainabledevelopment held in Rio, environmental considerationswere firmly incorporated in the developmentprocess. The concept of sustainable development,advocating economic growth with sustainableresource utilization, was integrated in Nepal’sTable 9.1: Environmental Components of National Socioeconomic Development Plans (1956 –2007)First Five-Year Plan (1956 –1961)Natural resources utilization, agriculture production. Forest Nationalization Act 1957 enacted.Second Periodic Plan (1962 –1965)Survey of natural resources, preparation of management plan for forestry of selected districts, forestation, forestdemarcation, and promotion of forest -based industries.Third Five-Year Plan (1965 –1970)Resettlemen t of Hill population in Terai, l and management and cadastral survey, sedimentation and water flowmeasurements in Terai, master plan for drinking water and sewerage in Kathmandu Valley, and emphasis on waterquality.Fourth Five-Year Plan (1970 –1975)National and sectoral policies relat ed to environment, programs of delineation of agricultural land, reclamation of forestland for resettlement, soil and land use surveys, watershed conservation in some parts of the country.Fifth Five-Year Plan (1975 –1980)Emphasis on ecological balance , conservation of national forests and wildlife, reduction of urban pollution, promotion ofecotourism, encouragement to women's participation in environmental activities.Sixth Five-Year Plan (1980 –1985)Emphasis on population control, watershed manage ment, initiation of environmental impact assessment ( EIA) ofdevelopment projects, regulations on urban environment, environmental aspects included in land use policy.Seventh Five-Year Plan (1985 –1990)Introduction of environment friendly policies and integrated environmental management, emphasis on participation ofprivate sector, non-government organizations ( NGOs), women, civil society for environmental management. NationalConservation Strategy Master Plan for Forestry Sector endorsed.Eighth Five-Year Plan (1992 –1997)Environment management policies integrated with sustainable economic development and poverty reduction, nationalenvironment policies and action plan reinforced to incorporate environmental issues with development planning.Establishment of Ministry of Population and Environment ( MOPE). Preparation of EIA guidelines, improvement oflegislative measures, promotion of environmental education, development of National Environmental Policies and ActionPlan, inclusion of environmental asp ects into hydropower, irrigation and industrial development policies, preparation andimplementation of the Agricultural Perspective Plan initiated, Environmental Protection Act enacted.Ninth Five-Year Plan (1997 –2002)Environmental Protection Regulati ons enacted, sustainable resource management principles endorsed, rural and urbanenvironment problems differentiated, community -based forestry programs initiated, institutional strengthening of lineministries, legal provisions for national resource conse rvation and management, scope of biological diversity expanded,pollution control program introduced, involvement of civil society in municipal waste management, programs forenvironmental conservation, participatory environmental education, training and r esearch programs on environment,development of environmental management information system. Programs of forest management and supply of forestproducts, introduction of market -based instruments for forestry management, water pollution control aspects addr essed.Environmental standards on air, water pollution, and industrial effluents enforced.Tenth Five-Year Plan (2002 –2007)Long-term goals of environmental management with better governance, pollution control, sustainable use of naturalresources, emp hasis on links between environment and economic development, public participation encouraged,internalization of environmental concerns into development plans and programs, implementation of nationalenvironmental standards, implementation of provisions of international environmental conventions, policies for capacitydevelopment of local institut ions in environmental management , promotion of women's participation in environmentalmanagement at all levels, research on environment friendly technologies, lega l and fiscal mechanisms for controllingindustrial pollution introduced, adoption of appropriate strategies and working policies, natural disaster managementpolicy introduced.Source: Different plan documents.120 Environment Assessment of Nepal : Emerging Issues and Challenges
development planning process. This period ischaracterized by concrete environmental actionsundertaken by the country. These include suchthings as development of clear environmentalpolicies, implementation of national environmentallegislation, development of environmental actionplans, and introduction of mandatory environmentalassessment in infrastructure projects.The key environment-related policies andstrategies introduced to date include: NationalConservation Strategy 1988; Industrial Policies 1992;Nepal Environmental Policy and Action Plan 1993;Tourism Policy 1995; Solid Waste Management Policy1996; National Water Supply Sector Policy 1998;Revised Forest Sector Policy 2000; HydropowerDevelopment Policy 2001; Nepal Biodiversity ConservationStrategy 2002; Leasehold Forestry Policy 2002;Water Resources Strategy, Nepal, 2002; NationalWetland Policy 2003; Irrigation Policy 2003; andSustainable Development Agenda for Nepal, 2003.The Conservation Strategy endorsed by theGovernment in 1988 includes a number of programsto internalize the environmental impact assessment(EIA) system in Nepal. The strategy underscores theneed to ascertain the potential consequences ofdevelopment activities on the environment and tominimize detrimental effects. The strategy requiresthat project proponents identify the potentialsocioeconomic and environmental impacts of theproject, and recommend ways in which these wouldbe mitigated.The Industrial Policy 1992 has emphasizedmeasures to minimize adverse impacts on theenvironment during the establishment, expansion,and diversification of industries. The policy opensavenues to formulate guidelines and standards tocheck and minimize adverse effects of pollutionassociated with industrial growth. Industries that arelikely to affect the environment have beencategorized and a license is required to establishindustries that affect public health and theenvironment (MOI 1992).The Nepal Environmental Policy and Action Plan1993, which was endorsed by the EnvironmentProtection Council, was the first program tocomprehensively articulate the environmentalpolicies of Nepal—it listed seven:(i) To manage natural and physical resourcesefficiently and sustainably;(ii) To balance development efforts and environmentalconservation for sustainable fulfillmentof people’s basic needs;(iii)(iv)To safeguard national heritage;To mitigate the adverse environmentalimpacts of development projects and humanactions;(v)(vi)To integrate the environment and developmentthrough appropriate institutions,adequate legislation and economicincentives, and sufficient public resources;To foster environmental education andawareness at all levels; and(vii) To facilitate participatory involvement ofprivate sector, NGOs, international nongovernmentorganizations (INGOs), and civilsociety with government efforts inenvironmental protection.The Tourism Policy 1995 emphasizes implementingenvironmental protection programs in aneffective and integrated manner to promotesustainable tourism development. The need fordeveloping tourism environmental guidelines and alocal code of conduct concerning the environment isalso discussed (MOCTCA 1996).The National Solid Waste Management Policy1996 underscores the importance of carrying out anEIA prior to selecting the final waste disposal site toreduce environmental pollution (MOLD 1996).The Hydropower Development Policy 2001envisages implementation of environmentalmanagement plans to minimize adverse effects ofproject development. The policy clearly requires that10% of the annual minimum discharge or whateverlevel is recommended by the EIA study bemaintained downstream in rivers (MOWR 2001).The Nepal Biodiversity Strategy 2002 emphasizesconducting EIAs in accordance with theprovisions of the Environment Protection Act 1996and Environment Protection Regulations 1997 toassess impacts of development activities onbiodiversity. The strategy has focused on ensuringeffective implementation of existing laws on EIA(MOFSC 2002).The Water Resources Strategy 2002 underscoresthe need for effective implementation of EIA andstrategic environment assessment (SEA) norms andrecommendations. The strategy has dissectedenvironmental problems in the water resourcessector and has emphasized implementing differentenvironmental activities for management ofwatersheds and aquatic ecosystems. The strategyalso calls upon the Ministry of Environment, Science,and Technology (MOEST) to take a lead role indeveloping environmental review and assessmenttools and to advise the Government regardingrequired changes to the policies and implementationprocedures of SEA and EIA (WECS 2002).The Sustainable Development Agenda for Nepal2003 prepared by the Government National PlanningCommission defines sustainable development forNepal and opportunities and broad goals coveringChapter 9: Environmental Governance121
the period to up 2017. The document begins bydescribing the pathways forward, detailed objectives,and states necessary government policies. Theagenda draws upon and is in conformity with thelong-term goals envisaged in the Ninth Plan1997–2002, the Tenth Plan 2002–2007, the MillenniumDevelopment Goals and the Poverty ReductionStrategy Paper, and commitments made by thecountry in various international forums (NPC 2003).The Irrigation Policy 1993 (revision 1997) makesspecific provisions and urges designing andimplementing irrigation projects and programsbased on the recommendations of EIA studies. Suchreports should be prepared taking into account theNational EIA guidelines 1993. The new IrrigationPolicy 2003 has a working policy to identify and selectirrigation projects that take into accountenvironmental factors. The working policyemphasizes implementing projects by minimizingadverse environmental impacts, conducting initialenvironmental examinations (IEE) and EIA, andorganizing public hearings, ensuring biodiversityconservation by mandating releasing of minimumessential water flows downstream, and utilizingwater for irrigation by avoiding or reducing adverseenvironmental impacts (MOWR 1993).The first major thrust to environmentalconservation and management in Nepal wasundertaken as part of the Eighth Five-Year Plan(1992–1997). The different policies and strategiesinitiated during the Eighth Plan were continuedduring the Ninth and Tenth plan periods. The NinthPlan specified various key policy directives:(i) Priority to environmental programs thatinvolve women and the poor;(ii) Special programs for environment conservationin remote areas;(iii) Involvement of NGOs in environmentaleducation;(iv) Training and research on pollution control,solid waste management, and others;(v) Development of environmental managementinformation systems; and(vi) Implementation of environmental standards.(vii) It also emphasized developing alternativeenergy sources like solar, micro-hydro, andbiogas plants as energy substitutes to replaceforest products as fuel.The ongoing Tenth Plan has accorded highpriority to integrating environmental concerns intoprogram implementation and has included a broadspectrum of working policies. The Tenth Plan hasadopted the following working policies:(i) To prevent degradation of natural resources,biological diversity, and cultural heritage;(ii) To increase local participation inenvironment conservation, according to theLocal Self Governance Act 1999;(iii) Municipalities are to prepare and implementland utilization and waste managementplans. Mandatory construction of sewagetreatment plants while implementing cityand settlement development plans. Takespecial initiatives in environment conservation,such as declaring plastic-free zones,provide aid to local authority throughenvironment conservation trust;(iv) Contribution of women’s groups to environmentalconservation will be encouraged;(v) Different communities will be encouraged toimprove their surrounding environment onthe basis of self-awareness and motivation;(vi) Improvements, conservation, and managementof nationwide natural, cultural, andreligious spots will involve local authorities.The role of nongovernment organizations,community organizations, and the private(vii)sector will be encouraged;To mitigate environmental degradation in thelower regions by development activities inthe upper regions (hydropower, irrigation)and to introduce rehabilitation programs;(viii) Municipalities will be the designatedinstitutions for vehicular emission testing andissuance of certificates;(ix) Introducing monitoring and appraisalsystems in the implementation stage ofprojects that have undergone environmentimpact assessment;(x)(xi)(xii)(xiii)(xiv)(xv)A central mechanism will be established tocoordinate different programs for implementationof international conventionsrelating to environment (e.g., climatechange, desertification, Basel Convention onHazardous Substances);Air, water, and sound pollution standards willbe determined and programs implementedgiving emphasis to an effective monitoringsystem;To manage and control industrial pollution,appropriate financial policies and legislativesystems will be prepared and implemented;Environmental education will be integratedin formal and informal education, andnecessary improvement in syllabuses will bemade;To make environmental education effective,necessary acts and regulations will beformulated and reviewed;Scientists, technicians, and researchers willbe encouraged to promote new technologiesin the area of environmental conservation;122 Environment Assessment of Nepal : Emerging Issues and Challenges
(xvi) Priority will be given to implementing theSustainable Development Agenda for Nepal2003;(xvii) Conservation-related traditional behavior,technology, and others will be documentedand preserved. Likewise, an environmentalinformation and database will be establishedand improved;(xviii) To establish an environment conservationcenter under the ministry concernedemphasizing the utilization of humanenvironmental resources;(xix) Prepare conservation-related directives andmethodology for the World TradeOrganization and make exports eco-friendly.(xx) Emphasize an integrated development planon the basis of the interrelationship between(xxi)highlands and lowlands;To control the environmental impacts fromglacial lake outburst floods, necessarystudies and research will be conducted,including monitoring of different variablesrelated to climate change;(xxii) Different strategies will be formulated for theenvironmental management of theindustrial, forestry, and agricultural sectorsand river systems;(xxiii) Different action plans will be formulated andimplemented regarding management ofdifferent groups of urban wastes under asolid waste management program;(xxiv) Necessary programs will be implemented incoordination with related agencies for theconservation and sustainable utilization ofthe Bagmati, Bishnumati, and Manohararivers inside Kathmandu Valley; and(xxv) Utilization of renewable energy sources willbe encouraged.The major working plans and programsapproved by the government and incorporated indifferent development plan documents (see Table9.1), that support the delivery of environmentalobjectives include the National Forestry Plan 1976;Forestry Sector Master Plan 1989; Master Plan forLivestock 1991; National Environmental Policy andAction Plan 1993; National Biodiversity Action Plan1995; Agriculture Perspective Plan 1995; NationalPlan of Action on Habitat 1996; National ActionProgram on Land Degradation and Desertification2004; and National Water Plan 2005.In addition to the above, community forestryprograms initiated in 1993 (MOFSC 1993a) have beenexpanded to almost all parts of the country. As ofMarch 2000, about 0.65 million ha of national forestshave been handed over to more than 9,000community forestry user groups. About 1 millionlocal people directly benefit from this process.Based on the experience of community forestry,the Government has also started soil conservationand watershed management activities with people’sparticipation. A participatory watershed managementsystem is in place in a number of districts forthe conservation and rehabilitation of degradedwatersheds. Community groups are now activelyinvolved in terracing and conservation plantation ondegraded hill slopes, and in water source protection.User groups have also been mobilized tomanage the buffer zones of the Terai national parksand reserves since the mid-1990s. This approach hasbeen expanded to all the protected areas in thecountry (9 National Parks, 3 Wildlife Reserves, 3Conservation Areas, and a Hunting Reserve) in aphased manner. Local user groups have beeninstrumental in managing Nepal’s conservation areasand utilizing natural resources for communitydevelopment in a sustainable manner (MOFSC1996).The Government introduced a vehicularpollution control program in 1996. Vehicle massemission standards were introduced in 1999 and in2000. The Government has also establishedmonitoring stations to ensure regular monitoring andevaluation of pollution levels in Kathmandu Valley.The Tenth Plan has also incorporated strategies,policies, and working programs for the managementof natural and human-induced disasters in thecountry. The objective is to ensure security of humanlives and property by managing natural and humaninduceddisasters systematically and effectively andby making the development and construction relatedprograms sustainable, reliable, and gainful. Whileformulating plans and policies on disastermanagement, emphasis will be given to the use anddevelopment of technologies that lessen harm to theenvironment. The relief and rescue activitiesprovided by the state will be made transparent.Programs will enhance awareness regarding disastermanagement. The Seismological MeasurementCenter and the Natural Disaster Management Centerwill be strengthened (NPC 2002).The Tenth Five Year Plan has envisaged severalplans for disaster management. These include anintegrated information system to coordinate theefforts of national and international organizationsworking in disaster management; a central databasesystem at the center and district database systems inthe districts; storing disaster relief materials instorage centers in all five regions; preparation ofgeological maps of the country; identifying areas thatcan be affected by natural disasters; collectinginformation and updating the catalogue ofChapter 9: Environmental Governance123
earthquakes; and awareness raising programs aboutpossible damage from water-induced disasters. Inaddition to preparing hazard maps, application ofgeo-engineering and the use of geo-environmentalmaps will be undertaken to regulate physicalinfrastructure development and disaster managementand carry out relief programs for peopleaffected by disasters.Effectiveness of EnvironmentalPolicies, Plans and ProgramsAlthough the Government has accorded a highpriority to resolving environmental problems and hasformulated comprehensive sets of policies, plans,and programs, their effectiveness has been belowexpectations. These policies have failed due toinadequate focus on cross-cutting issues, continuousintervention by political parties, the inability ofnational advisory bodies to function properly, theinability of policy institutions to implement policy,and most important, lack of adequate resources. Keynational agencies like the NPC and sectoralministries have not been proactive in implementingapproved policies and programs, and theGovernment has failed to attract the participation ofthe private sector. In this regard it is worthmentioning that under grant assistance from theAsian Development Bank (<strong>ADB</strong>), a study wasconducted by MOPE in cooperation with the Bank oninstitutional strengthening of the Ministry ofPopulation and Environment (MOPE) which wascompleted in 1999. However the recommendationsof the study report were never implemented (<strong>ADB</strong>and MOPE 1999).Monitoring of project implementation has beenpoor. Moreover, the key environmental body untilrecently was MOPE, which was never funded to theextent needed to fulfill its mandate. Similarly,sectoral agencies were unable to fully implementregulations due to lack of funds and inadequateinfrastructure capacity. Those agencies whose mainmandates were not environmental had only enoughcapacity to fulfill their own priorities, so environmentalrequirements were relegated to second placeand, more often than not, left unattended.The political instability that has plagued Nepalfor the last 14 years has also played a role. Agencieshave found it difficult to address environmentalproblems comprehensively because of frequentchanges in senior staff and political interference inprogram implementation (NPC 1997).Regulatory FrameworkLegislationThe Constitution of the Kingdom of Nepal, 1990 (Part4 Article 26: State Policies) stipulates the followingprinciples:(i) The state shall pursue a policy of mobilizing thenatural resources and heritage of the country ina manner useful and beneficial to the interestof the nation; and(ii) The state shall give priority to the protection ofthe environment and also to the prevention ofits further damage due to physical developmentactivities by increasing the awareness ofthe general public about environmentalcleanliness, and the state shall also makearrangements for the special protection of rarewildlife, forest, and vegetation.The Environment Protection Act 1996 and theEnvironment Protection Regulations 1997 are the twomain legal documents providing for environmentalinformation and public participation in the EIAprocess. The Act and Regulations provide a legalbasis for protecting the environment and controllingpollution. They propose measures for pollutioncontrol through permitting environmental inspection,establishment of environmental laboratories formonitoring pollution and conservation, creation ofan environmental protection fund, and anenvironment protection council, providing incentivesto business, and awarding compensation for adverseenvironmental impacts.The Local Self Governance Act 1999 providesmore autonomy to village development committees(VDCs), district development committees (DDCs),and municipalities by empowering local authoritiesto manage natural resources, and guides them tointegrate environmental resources and environmentalplanning. Highlights pertaining to environmentalgovernance include the following:(i) The Act requires wards to help in protectionof environment through plantation andstipulates the rights and duties of the VDC;(ii) It empowers VDCs to levy taxes on utilizationof natural resources;(iii) It provides powers to formulate andimplement plans for conservation of forest,vegetation, biological diversity, and soil; and(iv) It provides power to formulate bylaws in thearea of management of all natural resources.StandardsMost of the existing environmental standards andnorms were developed and put into effect during the124 Environment Assessment of Nepal : Emerging Issues and Challenges
1990s. EIA guidelines were developed by the NPC in1993 and legitimized by MOPE in compliance withthe provisions of the Environment Protection Act1996. These standards serve as national norms formitigation of environmental damage caused in theconstruction of development projects. In addition,norms prescribed by different line agencies helpimplement infrastructure projects in an environmentallyconscious manner. The Foods Department underthe Ministry of Agriculture and Cooperatives hasdeveloped specific quality standards under theprevailing Food Act 1967 that include guidelines for87 edible products (MOAC 1967). Similarly, theDepartment of Electricity Development under theMinistry of Water Resources has developed safetystandards for the construction of hydropowerprojects; the installation and operation of electromechanicalequipment, transmission, and distributionsystems; the operation of hydropower dams;and others. These standards also have mandatoryprovisions for the protection of the surroundingenvironment, including the protection of aquatic andanimal life. In cases where standards are still beingdeveloped (such as national standards for drinkingwater), World Health Organization (WHO) or otherstandards are being applied in the interim. Details ofsome environmental standards developed bydifferent public sector agencies of Nepal areprovided in Appendix 9.1.International CommitmentsTo date, Nepal is a signatory or party to 21environment-related conventions and is obligated tofulfill its commitments to them at national and globallevels. The seriousness of Nepal’s commitments tothese conventions has been demonstrated over thepast 10–15 years by the enforcement of relevantpolicies and strategies, by the establishment of aninstitutional and regulatory framework, and by theimplementation of different environmentalprograms. In particular, the Ninth and Tenth Five-YearPlans have reflected strong commitments toprioritize and implement provisions of the internationaltreaties/conventions on the environment.Nepal is actively involved in the followingconventions: United Nations Framework Conventionon Climate Change; Vienna Convention on theProtection of the Ozone Layer; Convention onBiological Diversity; UN Convention to CombatDesertification; Convention on International Trade inEndangered Species of Wild Flora and Fauna;Ramsar Convention on Wetlands; InternationalTropical Timber Agreement; and Convention onPersistent Organic Pollutants.Many activities are being carried out toimplement programs related to these conventions.This is taking place at the national level by differentgovernment agencies like MOEST, the Ministry ofForest and Soil Conservation (MOFSC), and NPC, andother stakeholders in cooperation with variousNGOs, INGOs, and experts on relevant subjectsunder financial and technical assistance frommultilateral and bilateral organizations (MOPE 2002).One such example is the joint study by MOPE and theDepartment of Hydrology and Meteorology withsupport from United Nations EnvironmentProgramme (UNEP) on enabling activities for thepreparation of the initial communication related toUnited Nations Framework Convention on ClimateChange (MOPE 2002). The Environment SectorProgram Support (ESPS) project conducted by MOPEfrom 2001 to 2005 with Danish InternationalDevelopment Agency (DANIDA) support, whichincluded institutionalization of environmentalmanagement aspects, industrial water treatmentactivity, and improvement of energy efficiency ofindustries for cleaner production, is anotherexample. Similarly a study was conducted by MOPEon institutional strengthening of the EIA process forhydropower development in Nepal with theNorwegian Agency for Cooperation andDevelopment (NORAD) support during 2002–2004.The results of such studies are contributing tothe updating of relevant data and information andare helping to improve plans and programs forenvironmental management at the national level.They are also serving as useful inputs for informationsharing with the international community.Unfortunately, procedural delays are commonin the ratification of some important internationalenvironmental treaties and conventions, and theirobligations are not being fulfilled on time. Forexample, although Nepal is a party to around 21environment-related international conventions andtreaties, it has only been able to ratify a few of themso far. The major reason is the failure of the agenciesconcerned to understand the technical aspects of thesubject. Other reasons include a lack of initiative andcapacity on the part of MOPE, which until 2005 wasthe key agency responsible for environmentaladministration. Ideally, the policymaking agenciesconcerned and key environmental bodies of theGovernment should review the status of thesecommitments and coordinate their actions to complywith their obligations.A list of the major international environmentalconventions in which Nepal has participated,together with their related obligations and status ofimplementation, is provided in Appendix 9.2.Chapter 9: Environmental Governance125
Sub-regional LinkagesOther developing countries in the region have alsobeen encountering serious environmentalproblems. Many countries are experiencing thesame challenges of developing legislative andinstitutional frameworks appropriate to theirconditions. It might be beneficial for Nepal toestablish linkages with the relevant environmentalinstitutions of these countries. Such exchanges ofinformation and experiences on the successes ordifficulties of planning and implementingenvironmental programs would further enhancecapacity building in this area.South Asian Association for RegionalCooperation (SAARC) has been a very useful forumfor this. The South Asia Cooperation for EnvironmentProgram (SACEP) and UNEP have also taken manyinitiatives to promote regional cooperation in SouthAsian environmental management. For example,UNEP has been supporting South Asian countries inconducting different activities related tounderstanding climate change and devisingmeasures to combat their impacts. Similarly, SACEPhas been conducting studies and preparinghand<strong>book</strong>s on national environmental legislationand institutions for these countries under theUNEP/SACEP/NORAD publication series onenvironmental law and policies (UNEP et al. 2001).In recent times, the need for well-establishedlinkages between energy, the environment, and theeconomy has been recognized strongly in South Asia.In this context Nepal can also benefit fromregionalizing its environmental activities.Enforcement of EnvironmentalLaws and StandardsNepal’s environmental laws can be broadly dividedinto two categories. The first includes laws directlydesigned as legal provisions for the protection of theenvironment and conservation of natural resources;for example, the Environment Protection Act 1996and its Regulations 1997, National Parks and WildLife Conservation Act 1973, Soil and WatershedConservation Act 1982 and Regulations 1985, and EIAGuidelines 1993. The second category includes thosedirectly or indirectly influencing the environmentalprotection process but aimed at promoting andmanaging sector-specific development programssuch as the Forest Protection Act 1967, IndustrialEnterprises Act 1992, Pesticides Act 1991, Solid WasteManagement and Resource Mobilization Act 1987,and Vehicle and Transport Management Act 1992 andits Regulations 1997. All acts have to be approved byParliament on recommendation of the Government,while the Government, on recommendations of therespective ministries, approves regulations definingdetailed procedures for implementation of therespective acts.Legal provisions in the first category includingthe Environment Protection Act and Regulations, andEIA Guidelines are directly enforced by MOESTwhich also monitors their application. The legalprovisions of laws in the second category areenforced and their application monitored by therespective ministries. For example, rules andregulations related to the use of pesticides areenforced and monitored by Ministry of Agricultureand Cooperatives; regulatory instruments related toforestry, biodiversity, and similar are enforced andmonitored by MOFSC; and legal provisions under theLocal Self Governance Act 1999 are enforced andmonitored by local government bodies like DDCsand VDCs. Similarly, some key environmentalstandards developed by MOEST are enforced byMOEST itself, whereas sector-specific environmentalstandards are developed and enforced by therespective ministries. Regulations and standards oncontrol of urban wastes are developed by MOESTand enforced by the municipalities. However, MOESThas also been empowered to cross check andmonitor implementation of sector-specific laws andcompliance of standards.Lack of inter-agency coordination, inadequateskilled personnel, poor and weak mechanisms ofcontrol and supervision, inefficiency of publicadministration, lengthy decision making processes,lack of coordination between the Government andNGOs, instability of the Government, lack ofappropriate technology, illiteracy, and lack of massawareness are some of the major reasons for weakenforcement of environmental legislation. Thedifficulties associated with effective enforcement oflegislative instruments stem from the fact thatMOEST and other sectoral agencies are fragmentedin their approach to monitoring. Monitoring is weakand uncoordinated, strict measures for enforcementare lacking, and non-compliance is rampant. Prior toformation of MOEST 2 in 2005, MOPE was the keygovernment body on environment in Nepal.However, MOPE was not successful in enforcingenvironmental laws and regulations in the country.Moreover MOPE remained weak in monitoring andevaluating the environmental performance of otherenvironment related agencies. These agencies also2MOEST was formed in 2005 by annexing the Environment Division of the former Ministry of Population and Environment (MOPE) and joining it to the then existingMinistry of Science and Technology (MOST), which was then restructured into MOEST.126 Environment Assessment of Nepal : Emerging Issues and Challenges
have roles to play in some aspects of monitoring.However, here the problem is even worse, sinceenvironmental monitoring is not their main mandate.Besides they also face scarcity of funds. Theseagencies are more occupied with achieving theirown agendas than ensuring that environmentalrequirements are complied with. For them environmentalmatters are usually of secondary importanceif any at all (MOPE and ESPS 2003). For example, theMinistry of Industry, Commerce and Supplies hasbeen more concerned with meeting their targetedproduct outputs than with complying with theenvironmental standards prescribed by MOEST (andbefore that MOPE) for industries. Collecting all thelegal instruments scattered through multiple sectoralbodies into a single common legislation might rectifysome aspects of this situation.The Environment Protection Act andRegulations, and SEA and EIA procedures arethemselves in need of updating and modification tokeep them relevant to changing demands. At thesame time, major existing provisions of IEE and EIAprescribed in the Environment Protection Act andRegulations are unclear and not comprehensive andrequire revision. Due to lack of funds,implementation of EIA provisions has not beeneffective. In the meantime national coordinatingbodies like NPC and the Environment ProtectionCouncil are not paying the necessary attention tostrict enforcement of legal provisions of EIA bydifferent agencies. From the Tenth Plan, the NPC hasintroduced the concept of SEA, which could be veryuseful for environmental screening and properplanning of sectoral programs; however, the processstill needs to be properly institutionalized andadequately documented. As a result of inefficienciesthroughout the system, the implementation ofenvironmental guidelines is often delayed.Major StakeholdersThe environmental institutions in Nepal includedifferent public and private sector stakeholders thatcan be categorized broadly as follows.Judicial bodies. The Supreme Court, Appellateand District courts.Advisory bodies. National DevelopmentCouncil, NPC, National Water ResourcesDevelopment Council, Environment ProtectionCouncil, National Commission on SustainableDevelopment, Water and Energy Commission,National Biodiversity Coordination Committee, andothers.Policymaking bodies. Parliamentary Committeeon Environment Conservation; line ministriesincluding Ministry of Environment, Science andTechnology; Ministry of Forest and Soil Conservation;Ministry of Physical Planning and Works, Ministry ofWater Resources; Ministry of Industry, Commerceand Supplies; Ministry of Local Development,Ministry of Defence, Ministry of Home Affairs;Ministry of Agriculture and Cooperatives; andMinistry of Labour and Transport Management.Policymaking bodies also include the Department ofHydrology and Meteorology, Nepal Bureau ofStandards and Metrology under the Ministry ofIndustry, Commerce and Supplies, and the CentralFood Research Laboratory under the Ministry ofAgriculture and Cooperatives.Corporate and local bodies. Nepal ElectricityAuthority; Nepal Agricultural Research Council, RoyalNepal Academy of Science and Technology, SolidWaste Management and Resources MobilizationCenter, Nepal Water Supply Corporation, DDCs, VDCsand metropolitan and municipality administrations.Private sector organizations and NGOs.Federation of the Nepalese Chambers of Commerceand Industries, statutory NGOs such as KingMahendra Trust for Nature Conservation, and otherNGOs (see Appendix 9.3) registered under theAssociation Registration Act and affiliated with theSocial Welfare Council; Federation of CommunityForestry Users, Nepal; and Federation of Water UsersAssociations, including various community-basedorganizations and professional societies.Academic institutions. Kathmandu University,Tribhuwan University, College of InformationTechnology, and School of Environment ManagementSystems based in Kathmandu are contributingtowards the preparation and training of environmentalprofessionals.The media. The media in Nepal has been veryactive in bringing issues and problems ofenvironmental concern to the public’s attention andthis has contributed to better and continuedsurveillance. Media focus has also prompted relevantgovernment and private agencies to undertakeprojects aimed at environmental improvement.Frequently published articles in dailies like Kantipur,The Kathmandu Post, The <strong>Himalayan</strong> Times, andNepal Samachar Patra, and other popular weeklypublications like the Nepali Times, Himal, andSpotlight, as well as media programs conducted byagencies like the Nepal Forum for EnvironmentalJournalists and Society of Environmental JournalistsNepal serve as examples.Civil society. With heightened and improvedawareness, civil society has in general demonstratedits serious concern for the environmental situation ofthe country and has been proactive insupplementing the Government’s efforts to bringabout improvements.Chapter 9: Environmental Governance127
Figure 9.1: The Key Environmental Institutions in NepalParliament Council of Ministers Supreme CourtCIVIL SOCIETYParliamentary Committee on NaturalResources and Environmental ProtectionNational Development CouncilPRESSNGOs, INGOsNational Planning CommissionACADEMICINSTITUTIONSEnvironment ProtectionCouncilNational Commission onSustainable DevelopmentMEDIANational BiodiversityCoordination CommitteeKey MinistriesWater and EnergyCommissionLOCAL BODIESDONORSEnvironment,Science andTechnologyForest andSoilConservationIndustry,Commerceand SuppliesAgricultureandCooperationLocalDevelopmentWaterResourcesINGO = international nongovernment organization, NGO = nongovernment organizationSource: Compiled from various sourcesIn spite of this large number of stakeholderinstitutions and good intentions on the part of allconcerned, performance on environmental mattersremains poor. The most serious impediment toprogress on environmental issues remains the lack ofinter-stakeholder coordination. This lack ofcoordination has led the different agencies to work inisolation and has impeded addressing environmentalmanagement in a holistic manner. Stakeholdersneed to be networked and streamlined to maximizebenefit from their joint efforts. The hierarchicallinkages of key environmental institutions are shownin Figure 9.1.Role of Key EnvironmentalStakeholdersParliamentary Committee on NaturalResources and Environmental ProtectionThe Parliamentary Committee on Natural Resourcesand Environmental Protection provides guidance toand oversees government actions in initiating naturalresources conservation and environmentalprotection. As a legislative body, the Committee alsohas authority to give directives to, and seekinformation and clarification from, the executivebranches of the Government on natural resourcesand the environment. The committee is headed byan independent chairperson elected from among themembers of Parliament.National Development CouncilThe National Development Council is the highestpolicy-level body of the country and is chaired by theprime minister. The council is mandated to provideguidance over major policy issues and periodicplans, including all aspects of natural resourcesconservation and environmental protection. It iscomposed of all cabinet ministers, all members ofthe NPC, chairpersons of the various parliamentarycommittees and selected chairpersons of the DDCs,and the leader of the main opposition party in thehouse, as well as other prominent parliamentarians,representatives of key private sector organizations,and intellectuals. The NPC serves as the secretariatof the Council.Environment Protection CouncilThe Environment Protection Council is a high-levelnational body focusing on management andprotection of the environment; it is chaired by theprime minister. It was established in 1992 andcomprises ministers of relevant ministries, seniorcivil officials, representatives of NGOs and the privatesector, and individual environmental professionals.MOEST is the secretariat of the Council.128 Environment Assessment of Nepal : Emerging Issues and Challenges
The Council provides guidance on theformulation of environmental policies, their legalframework, procedures, and policy implementation.It provides guidance on the management of naturaland physical resources and coordinates environmentalactivities among the relevant nationalagencies, taking into account the EIA of projectdevelopments, dissemination of information on theenvironment, and promoting environmentalawareness and education.JudiciaryThe judiciary is the guardian of the constitutional andlegal system of a country. It is responsible for theprotection of constitutional and legal rights. Most ofthe legal norms related to sustainable developmentconcern people’s basic rights like the right todevelopment, right to information on the exploitationof natural resources, right to a healthy environment,right to participate in decision making, right to a fairand equitable share of the fruits of development, andso on. When the judiciary plays an effective role toprotect these rights, it leads towards achievingsustainable development (HMG 1990).Nepal has a pyramid judicial structure, with asingle Supreme Court at the apex, 11 AppellateCourts, and 75 District Courts. Under the Constitution,the King at the recommendation of the JudicialCouncil appoints Supreme Court judges, a bodycomposed of senior judicial officers. Supreme Courtjudges can only be removed on the stated groundspursuant to a determination by a two-thirds majorityof a sitting House of Representatives. The Judicialcouncil may remove lower court judges from officefollowing a recommendation to that effect. The Actalso provides for independence of the judiciary.The Judiciary has promoted the developmentand enforcement of legal norms in the field ofsustainable development by exercising its powersunder Part 11 of the Constitution and by theprovisions of other Acts and Regulations adopted bythe Government from time to time (HMG 1990).Article 88 (2) of the Constitution has conferred suchpowers to the judiciary, which are extremelyimportant for the enforcement of legal norms relatedwith sustainable development.National Planning Commission (NPC)Chaired by the prime minister, the NPC is anautonomous government body charged withformulating all national and sectoral policies, anddevelopment of periodic plans, as well as short-termand long-term plans and programs. The Governmentappoints the members of the NPC, including the vicechairman.It has an environment division headed byone of its members responsible for policy planning,Chapter 9: Environmental Governanceprogramming, budgeting, monitoring, and review ofall environment-related activities in the country.Ministry of Environment, Science andTechnology (MOEST)MOEST was established as a new Ministry mandatedto carry out environmental activities early in 2005following dissolution of the Ministry of Populationand Environment (MOPE). After the establishment ofMOEST, the environment division of MOPE wasmoved to this Ministry.MOPE had been created in September 1995 toact as the focal point for the interrelated areas ofpopulation and environment. Its main responsibilitiesincluded (i) formulation and implementation ofpolicies, plans, and programs; (ii) preparation of acts,regulations, and guidelines; (iii) undertaking surveysand research studies; (iv) dissemination of information;(v) monitoring and evaluating programs; and(vi) human resources development for theenvironment sector.MOPE’s scope of work included two broadcategories of activities: primary and supportive.Primary functions included activities executed on theinitiative of the ministry in cooperation with otheragencies. Cooperation and assistance extended toother ministries and agencies in executing their ownprograms and activities are the supportive functions.With the environment division now moved toMOEST, MOEST has taken over all the environmentalfunctions of MOPE.Ministry of Forest and Soil Conservation(MOFSC)The MOFSC is responsible for formulating andimplementing plans, policies, laws, and programs forthe conservation of forest resources and theirmanagement; as well as for administering andmonitoring their implementation. The ministry alsoprepares guidelines and manuals for forestrydevelopment, conservation and protection ofbiodiversity and wildlife, soil conservation,watershed management, and protected areas.MOFSC operates through five central departmentsand a research center.(i)(ii)(iii)The Department of Forest administers theforests and rangelands throughout thecountry, which account for about 47% of thetotal area of Nepal;The Department of Plant Resources isresponsible for botanical research on forestspecies and their promotion;The Forest Products Department Boardpromotes the economic and sustainableutilization of wood, medicinal and aromatic129
(iv)(v)(vi)plants, and other non-timber forest productsby developing suitable technologies andprocesses for utilizing such products;The Forest Survey and Research Center actsas an autonomous body in conductingforestry related research and surveys;The Department of National Parks andWildlife Conservation is responsible for themanagement of the national parks andprotected areas as well as biodiversityconservation; andThe Department of Soil Conservation andWatershed Management bears responsibilityfor carrying out soil conservation activitiesand watershed management.The ministry has offices in all 75 districts, andregional offices to conduct different activities relatedto development and management of the forestrysector.Ministry of Industry, Commerce andSuppliesThe Ministry of Industry, Commerce and Supplies isresponsible for promoting industry in the countrywithout compromising environmental management.The ministry controls industrial pollution in both newand existing industries. It is also responsible forpreparing and enforcing legislation and regulation onindustrial pollution, water discharges from industries,and developing industry-specific discharge standardsfor air and waterborne environmental contamination.A separate unit on Environment andTechnology Transfer also exists within the ministry.Operating under it are the Department ofIndustry, the Department of Cottage and Small ScaleIndustries, and the Cottage and Small IndustryPromotion Board. The Department of Industry andthe Department of Cottage and Small ScaleIndustries have environment units for enforcingdischarge standards, applying IEE and EIA toindustries, issuing permits for industrial establishments,and monitoring emissions and effluentdischarges.The Nepal Bureau of Standards and Metrology,under the ministry, is responsible for settingstandards for air, water, and other environmentrelatedcomponents. It also enforces the abovestandards and fixes effluent and emission standardsfor industries and motor vehicles.Ministry of Local DevelopmentThe Ministry of Local Development is responsible forformulating policies, plans, and programs on ruraland town developments and monitoring theirimplementation, taking into consideration theirenvironmental implications. The ministry alsoimplements the environmental provisions made inthe Local Self Governance Act 1999 through its localorgans and local bodies like DDCs and VDCs incollaboration with local communities and usergroups.Ministry of Agriculture and CooperativesBesides its main jurisdiction of agriculture andlivestock development, the Ministry of Agricultureand Cooperatives is responsible for formulatingpolicies, standards, and legal instruments related toenvironmentally sensitive products and control ofagricultural pollution. It operates through its regionaland district offices in all five development regionsand 75 districts. The key entities under the ministryare the Nepal Agricultural Research Center, theDepartment of Agriculture, the Department ofLivestock Services, Nepal Tea and CoffeeDevelopment Board, the Dairy Development Board,and the National Seed Development Board. TheCentral Food Research Laboratory under the ministryimplements the Food Act 1966, the Animal Feed Act1976, and corresponding regulations.Ministry of Water ResourcesThe Ministry of Water Resources is responsible for allactivities related to the development of waterresources, electricity, irrigation, alternative energydevelopment, and management of water-induceddisasters. The ministry has an independent policyplanningwing—the Water and Energy CommissionSecretariat—responsible for planning of waterresources based on strategic environmentalevaluation and assessment of environmentalimpacts of the water development projects. TheCommission Secretariat developed a comprehensiveWater Resources Strategy for Nepal in 2002 and aNational Water Plan for implementing its provisionsin 2004 (WECS 2004) giving high priority toenvironmental concerns and their management asan indivisible part of all these plans and programs.The ministry also has an environment divisionresponsible for identification and management ofenvironmental implications of water resourcesdevelopment.Nepal Electricity AuthorityThe Nepal Electricity Authority is a semi-governmentpublic utility responsible for the generation,transmission, and distribution of electric powerthroughout the country. It operates through sixdirectorates and 12 departments and has field officesin almost all 75 districts of Nepal, engaging around130 Environment Assessment of Nepal : Emerging Issues and Challenges
10,000 employees at different levels. The NepalElectricity Authority is the key agency forconstruction and maintenance of power projects(mainly hydro-based). It contains a well-establishedenvironmental directorate with around 25 officersand support staff. EIA of all hydro projects has beenmade mandatory in the project developmentprocess. Environmental management plans of allprojects are executed under the supervision of thisdirectorate.Ministry of Physical Planning and WorksThe Ministry of Physical Planning and Works has twomajor wings—one for construction of roads andhighways, another for extension of water supply andsanitation projects. The Water Supply and SanitationDepartment develops rural water supply schemesand hands them over to community water users,while the Nepal Water Supply and SewerageCorporation, established in 1998, is responsible forwater supply and sewerage schemes in urban areas,mostly municipalities. The ministry itself and alldepartments under its supervision have environmentdivisions headed by senior officials, some of themenvironmentalists. The Melamchi Water SupplyScheme is being developed for diversion of 170million liters of water per day from the Melamchiriver (Sindhupalchowk district) to Kathmandu Valley.A special division is responsible for supervising andimplementing all environmental programs envisagedin the project.Similarly, the roads department of the ministry isresponsible for constructing and managing roadsand highways, giving due priority to environmentalaspects. It takes into consideration the EIA andimplementation of environmental managementplans at planning, executing, and maintenancestages. These are being managed by the geoenvironmentaldivision of the department.MunicipalitiesKathmandu Metropolitan City has a population ofabout 1.8 million people (CBS 2002). Majorenvironmental problems in Kathmandu Valleyinclude solid waste disposal, air and water pollution,unmanaged slums, and shortage of potable water.Degraded sanitary conditions are causing health andother problems. The city created an environmentdivision in 1997 which carries out environmentalmanagement and conservation programs within themetropolitan area. The key functions of theenvironment division are solid waste management,participation in urban environmental management—including air pollution control and sewagemanagement—and development of green areaswithin the metropolitan area. It conducts its activitiesChapter 9: Environmental Governancein collaboration with MOEST, the Nepal TourismBoard, and other environmental NGOs active forenvironmental improvement of Kathmandu Valley.The other two sub-metropolitan cities ofKathmandu Valley, Lalitpur and Bhaktapur, have alsocreated environmental sections to implement andmonitor environmental programs within theirjurisdictions.Other large municipalities in the country outsideKathmandu Valley have also initiated environmentalmanagement programs.Overall Performance ofEnvironmental GovernanceEnvironmental governance refers to the functioningof stakeholder organizations under the framework ofprevalent rules and regulations to deal withenvironmental problems. Environmental governancein Nepal has not been very effective.Key reasons for ineffective environmentalgovernance in Nepal have been the frequentchanges in governments, government’s poorfunctioning, and inadequate attention paid to theincreasing urban and rural environmental problems.Others include absence of long-term environmentalpolicies, weak enforcement of environmental laws,malfunctioning of national decision- andpolicymaking bodies, inability of environmentalinstitutions to streamline activities into the nationalsocioeconomic development process, insufficientfunding, and low morale. These deficiencies havebeen compounded by inefficient publicadministration in general, weak monitoring, nonresponsivenessof the environmental agencies topublic opinion, and non-execution of recommendationsof many studies conducted for the environmentsector through donor support.The Government has created and dissolvedenvironmental institutions frequently, withoutproviding them sustainability or continuity, beingguided mainly by political motivations. This hasbrought instability and distortion to the process ofenvironmental governance. One of the most recentexamples of such change was the dissolution ofMOPE in 2005 after 10 years of existence andannexation of its environment division to MOEST.Some think it might have been more effective torestructure MOPE and strengthen it to maintain itsindependent identity and improve its performance.Institutional and regulatory efforts in Nepaltowards the conservation of natural resources andmanagement of environmental issues have had littleimpact due to the different factors and constraintsencountered. The underlying reasons for poor131
environmental governance can be better understoodby reassessing environmental performance to dateand identifying areas where changes are needed.Socioeconomic Factors Impeding GoodEnvironmental ManagementNepal’s poor record on the environment stems fromthe fact that Nepal is a country in transition with apoor economy and is confronted by many othermajor challenges of infrastructure development. Thecontinuing political instability and security problemsare adversely impacting both the economy and theenvironment. Frequent changes in governments, thelack of a parliament for prolonged periods, and thepresent conflict situation have all contributed toundermining organizational capacity, and outreachand monitoring at all levels. These have severelyundermined progress in environmentalmanagement. Poverty is forcing poor people toindiscriminately use and overexploit naturalresources for daily survival.Although the Government maintains thatpromoting environmental activities is a high priority,budgetary allocations remain grossly inadequate,and provisions for obliging communities tosustainably manage environmental resources remainlacking. Inadequate advocacy and awareness of theimportance of protecting and managing theenvironment are prevalent. Lack of awareness inurban areas has resulted in increased pollution fromthe misuse and abuse of resources andenvironmental mismanagement, while lack ofawareness in rural areas has resulted inunsustainable use of natural resources.Under-funded Environment and NaturalResource MandatesPublic sector institutions such as ministries,departments, and corporate bodies are short oftechnically skilled human resources specialized inthe various environmental fields. Lack of the fundsneeded to execute their mandates means that thedatabases, research facilities, and laboratoriesneeded for environmental monitoring are lacking(see Chapter 10). This situation has madeenvironmental institutions dependent on externalfacilities. For example, MOPE, even after 9 years ofexistence, did not have a laboratory of its own foremission testing of vehicles and depended on thefacilities available with the traffic police office. Localgovernment bodies at the district and village levelsalso need technical staff, facilities, and funding,without which they cannot execute their mandatedenvironmental activities as promoted by the LocalSelf Governance Act 1999. The same situation withrespect to instrumentation and staff prevails amongNGOs and the private sector. Lack of logisticalsupport has prevented agencies concerned frommaking field trips to project sites to carry outenvironmental surveillance and monitoring activities.Well-trained technical staff are in short supplyand while two universities (and a number ofcolleges) have taken up the challenge of trainingenvironmental experts and giving environmentaltraining to students in related disciplines, they needto be more actively encouraged and supported.Environmental departments need to make costlyinvestments in instrumentation for hands-on training,and this also needs to be reviewed. To date it hasbeen difficult to attract young people toenvironmental disciplines since it is known thatenvironmental staff are poorly remunerated. Themorale of graduate-level environmental staff is low.Because they are not categorized as an“environment group” by government administrativerules, they are deployed under miscellaneousgroups, which not only negatively impacts theircareers but also discourages new recruits.Conflicting and Overlapping MandatesConflicts and problems related to overlappingmandates appear in many areas but are especiallyprevalent between institutions with long historiesand those that are relatively new. There is a strongneed to review all existing sectoral environmentallegislation and harmonize it. Here we cite examplesthat can arise between different agencies andministries to show how pervasive the problems are.Conflicts arise, for example, in cases whichinvolve forested areas. As per the provisions of theEnvironment Protection Act and Regulations, MOESTis authorized to approve EIA reports on developmentprojects (like transmission lines and hydropowerplants). Nevertheless, the Forest Act 1993 says that incases where such projects involve forested areas,MOFSC also has the right to review and reject them.Lack of expertise and facilities means that theapproval process by MOFSC may take a long time,and often these delays compromise project viability.Experiences of program implementation reveal thatwhile awaiting an environmental decision,developers often take matters into their own handsand clear extra forests and inflict other damage.Legislation and human resources to monitor orprosecute this behavior are weak or lacking, and inthe process projects of possibly national importanceare jeopardized.Similarly, the National Parks and WildlifeConservation Act 1973, amended 1993, prohibits anyoutside interference in projects undertaken inprotected areas. While MOFSC cannot overrule the132 Environment Assessment of Nepal : Emerging Issues and Challenges
park management, this legislation neverthelessconflicts with MOFSC’s mandate to oversee all forestadministration. Similarly, if in trying to fulfill itsmandate as the overseer of all forests MOFSCundertakes projects in forested protected areas,these can be vetoed by park authorities. Otherconflicts over forested areas arise from the fact thatunder Environment Protection Act rules, MOEST candeclare certain forested areas to be conservationareas. MOFSC has the same mandate under theForestry Act. While the discussions over jurisdictioncontinue, important forest areas continue todegrade, as do watersheds, wetlands, and riverbasins.Agriculture-based private industries registeredwith the Ministry of Industry, Commerce andSupplies can sell imported products such asfertilizers and pesticides to farmers. When theseproducts are of low quality, they can wreak havoc onagricultural production, the soil, the environment,and people’s health. Since these industries are notregistered with the Ministry of Agriculture andCooperatives and one ministry cannot interfere withthe jurisdictions of another, the Ministry ofAgriculture and Cooperatives cannot prosecute theirwrongdoing. In this turf war, the farmer ultimatelyloses. Yet another area of conflict arises becauseministries have an obligation to monitor projectsimplemented under their jurisdiction; however,MOEST can also intervene to monitor them under theEnvironment Protection Act and Regulations. Thiscreates confusion and conflicts between MOEST andthe ministries concerned.These examples illustrate the need forharmonization. In this process the advisory andpolicy making public sector bodies shouldcoordinate efforts in consultation with the privatesector organizations, corporate bodies, and localbodies.Lack of Consolidated and ParticipatoryActionsAlthough government policies and plans commonlyadvocate the need for greater participation betweenthe public sector, its central and local bodies, localNGOs, communities, and users’ groups, it is difficultto see sufficient progress in this direction. While it iscommonly acknowledged that the participation of allof these groups is a prerequisite to securing holisticsupport, timely delivery, and continued implementationof almost any environmental program, thisadvice remains largely unheeded; moreover, the willto secure this common participation needsprompting.To date there are a few concrete vehicles foractive community feedback. One such is the EIAprocess. Public hearings and consultations at projectsites are required several times as part of the EIAprocess. These consultations take place withdifferent public and private agencies, NGOs, and themedia. Major projects on hydropower developmentsuch as the Kali-Gandaki A project, the PanchesworHigh Dam Project, Upper Karnali Hydro Project, andMiddle Marshyangdi Hydro Project; some largeirrigation projects like the Mahakali irrigation, theSunsari Morang irrigation, and the NarayaniIrrigation; and the Melamchi Water Supply projectshave been widely discussed. The local communities,media, donors, and major stakeholders allparticipated; however, there is still room forimprovement which would involve standardizing theprocess and ensuring that it is conducted morefrequently.Public consultations also take place in projectsthat involve community water supplies, farmermanaged irrigation systems, and others. Herecitizens’ groups are actively encouraged to givefeedback through public hearings. There is alsoregular coverage in the media on majorenvironmental issues, mostly related to differenttypes of pollution. Many environmental NGOs like theMartin Chautari Society, the Society of EnvironmentalJournalists, and others have been voicing environmentalconcerns in different seminars and throughFM radio and television channels.Experiences of MOFSC and Nepal Water Supplyand Sewerage Department indicate that projects thathave active community participation like thecommunity forestry programs and water supplyschemes in rural areas often have better successrates. Efforts should be made to foster thisparticipation by encouraging greater interactionamong the project teams, contractors, consultants,communities, and local social groups on environmentalprojects, especially by promoting theinvolvement of Nepali environmental experts asconsultants, advisors, and monitors, and by involvingNepali field-based NGOs.Difficulties in Utilizing Donor SupportAs government allocations are admittedly marginal,environment management in Nepal has beenessentially donor-driven, and this situation hasoccasionally led to difficulties. It is often felt thatdonors could spend more time interacting with theGovernment to better understand Nepal’sdevelopment needs, since it is always useful toharmonize government priorities and donorconcerns, terms, and conditions. Donors often applycommon models for all developing membercountries when formulating their programs, whereaslocal socioeconomic and environmental conditionsChapter 9: Environmental Governance133
can vary considerably. Both sides have recognizedthat more face-to-face interactions between theGovernment and donors are needed. The NepalDevelopment Forum, a group of differentdevelopment partners of Nepal, has been addressingthis need. Another common complaint is that theGovernment’s lack of coordinating capability hasoften led to duplication in selection andimplementation of projects. The Nepal Aid Group ishelping donors to sort these issues out amongthemselves to enhance effectiveness of theirassistance to Nepal.Another common difficulty is that Nepal canoften not accept all of the needed aid in a givensector because it does not have enough absorptivecapacity to utilize all the available assistance fromthe donors. Often, significantly more capacity mustbe built before sophisticated or wide-rangingprojects on the environment can be undertaken.There are also occasional differences of opinionon the conditions set by different donors forproviding loans, as their requirements, terms, andconditions often differ from each other. A commondisappointment is that donors tend to select andapprove consultants unilaterally, only completing theformalities of consultation with the client country justbefore signing the agreement. Given that paymentsto foreign consultants often take a significant amountof the loan, the frustration is understandable.Institutional Strengthening and CapacityBuildingAfter the establishment of MOPE (now MOEST) in1995, a substantial number of environmental lawsand regulations were developed. About half of theprevailing environmental laws now in force in Nepaldate from 1992. Widespread public concern overpollution led to legislation to curb emission ofeffluents and airborne pollutants, while concern overthe depletion of natural resources led to legislationfor preserving conservation areas such as nationalparks and wildlife areas with special biodiversityvalue. While the laws exist in principle, institutionalweaknesses continue to prevent the effectivemonitoring and implementation of these laws.Institutions at all levels are weak, including theNPC, line ministries, local governments, and VDCs.Requisite technical skills are commonly lacking, andpoor morale is a systemic issue. These deficienciesstem from the general weakness of the publicadministration system itself—over-staffing, lowsalaries, political interference in appointments andtransfers, and inadequate performance recognition.These in turn affect public resource management.The capacity to monitor the implementation of lawsand public expenditures is weak at all levels.Inadequate supervision, poor financial management,dilatory government procedures, and lack ofcoordination among government entities are someother indicators, all of which lead to poorperformance generally and to a serious neglect ofenvironmental issues in particular.Nepal needs to build up its capacity for nationaland regional development so that it can effectivelyparticipate in the global economy. There is a need tostrengthen the public and private sectors,institutions, systems, processes, procedures, andpractices that support development efforts. Improvedcapacity is needed to entrench and sustain goodgovernance, design and manage effective policiesand programs, manage the environment, addresspoverty, and apply science and technology todevelopment problems. Capacity is also needed toaccelerate regional development and for Nepal toparticipate with other regions as an effective partnerin the global economy.Improvements in the Legislative SystemA large number of environmental acts andregulations have been promulgated in Nepal duringthe last 10–15 years to facilitate the implementationof environmental plans and programs, but these havehad only limited success. This legislation now needsto be updated and amended to make it responsive tothe present requirements of complex environmentalconcerns 3 and rigorously enforced.In addition, new regulations are needed to helpNepal take full advantage of World Trade Organizationmembership, which Nepal recently entered,becoming the 147th member. The main aim ofmembership is to improve Nepal’s economy byopening up trade with the entire world. Policymakersand businessmen need to be aware of how to makethe most of these opportunities and how not to beovercome by an open trading regime. Onecommitment made by Nepal was to amend theEnvironment Protection Act 1996 to complement therequirements related to trade and the environment.Nepal also needs to include provisions fordeveloping additional environmental standards forprotection of human and plant life. Amendments toexisting legal provisions for capacity building ofenvironmental cells in the Federation of NepaleseChambers of Commerce and Industries and othermajor associations of commerce and industries willbe required. Industries should be motivated to adopt3For example there is no provision in the Environment Protection Act and Regulations for control and management of hazardous waste from hospitals and nursinghomes; and there are no guidelines on control of effluents being discharged by industries. Some other regulations related to the protection of the environment,conservation of biodiversity, and sustainable use of non-timber forest products also need amendments to prevent over-collection and illegal trade.134 Environment Assessment of Nepal : Emerging Issues and Challenges
and comply with International Standards Organization(ISO) standards and eco-labeling of industrialproducts.While it is clear that the existing environmentallaws and regulations need to be reviewed, they alsoneed to be enforced. Nepal’s poor performance inthe environmental sector has largely been a failure tofully empower regulatory bodies to enforceregulations, monitor compliance, and imposepenalties. The environmental commitment ofinstitutions nominally responsible for enforcement,such as NPC and MOEST, is weak and theenforcement piecemeal—there is a lack ofenforcement modalities and a lack of coordinationamong the different agencies.A strong institutional base is needed to monitorand back up the legal instruments applied toenvironmental conservation. In many cases lawenforcement is thwarted due to poor institutionalinfrastructure, lack of institutional decentralization,or the constant shifting of responsibilities from oneinstitution to another resulting in no one institutiontaking up the task at hand. A strong, transparent, andeffective monitoring system that can support properenforcement of laws and regulations is needed.For example, to comply with internationaltreaties, a list of rare and endangered species hasbeen prepared by MOFSC. However, whether theaforementioned species are still endangered or rareis never scientifically monitored. Surveillance of legalinstruments both internationally and nationally islacking. Creating a repository of all the relevantenvironmental information in the country andmaking it accessible to all stakeholders throughelectronic means would help to make the systemmore transparent and easier to enforce.Strengthening the EIA/SEA FrameworkAn effective monitoring and evaluation mechanismto review compliance with existing environmentallaws is also needed. Under the provisions of theEnvironment Protection Act and Regulations, it ismandatory to assess the technical, industrial, andsocioeconomic impacts of development projects onthe environment and on the population. The agencyconcerned needs to approve the requisite EIA reportsbefore any project is started. Projects withoutsignificant environmental impacts only need an IEEto be conducted by relevant agencies. The NPC hasadopted and applied the concept of SEA for projectdevelopment policies and programs included in theTenth Five-Year Plan (2002–2007). While the EIAassesses environmental impacts of developmentprojects at the project level, the SEA assessesenvironmental impacts of development projects atthe planning, policy, and programming stages andcan be used in evaluating strategic proposals forappropriate decision making.EIA and SEA capacity issues are acute. The EIAis still largely considered an “add-on” project burden,and EIA reports are commonly based on inadequatedata. Although MOEST has already approved 25 EIAreports from different projects, it has not been able tomonitor the proposed mitigation of identifiedimpacts. Recent experience based on a cross-sectionof development projects shows that the EIA processis usually enforced as part of the initial approvalprocess during approval of EIA reports by MOEST.However the problems come later at theimplementation stage when actual site conditionsdiffer from initial preliminary assessments.From this perspective, capacity development inaugmenting, mobilizing, and enhancing the EIA andSEA capability of a country, organization,professional body, or group of individuals is muchneeded for strengthening this sector. The knowledge,tools, and skills necessary to operate an EIA or SEAsystem to an acceptable level of performance haveto be developed. The scope of capacity developmentcan range from establishing preconditions for EIA orSEA development to benchmarking good practice.Supporting measures include research, policyanalysis, institutional design, information exchange,training and skills transfer, building networks,professional development, and guidance onimplementation of good practices.BibliographyAsian Development Bank (<strong>ADB</strong>). 2001. Asian EnvironmentOutlook. Manila.———.2004. The Country Environment Analysis for Nepal.Kathmandu: International <strong>Centre</strong> for IntegratedMountain Development.Asian Development Bank (<strong>ADB</strong>) and Ministry of Populationand Environment (MOPE). 1999. InstitutionalStrengthening of the Ministry of Population andEnvironment. Kathmandu: His Majesty’sGovernment of Nepal, MOPE.Bhattacharya, R.N. 2001. Environmental Economics: AnIndian Perspective. Delhi: Oxford University Press.Central Bureau of Statistics (CBS). 2002. Population Census2001. Kathmandu.Chhokar, K.B., M. Pandya, and M. Raghunathan. 2004.Understanding Environment. Delhi: <strong>Centre</strong> forEnvironment Education, Sage Publications India.Dahal, M.K., and D.R. Dahal. 1998. Environment andSustainable Development Issues in NepalesePerspectives. Kathmandu: Nepal Foundation forAdvanced Studies.Dash, M.C., and P.C. Mishra. 2001. Man and Environment.Kolkota: Macmillan India Limited.Chapter 9: Environmental Governance135
Dhungel, D.N., and A.B. Rajbhandari. 2004. IntroducingGood Governance in the Public Administration ofNepal. Kathmandu: <strong>Centre</strong> for Studies onDemocracy and Good Governance.Environment Protection Council (EPC). 1993. NepalEnvironmental Policies and Action Plan. Kathmandu.Eugine, T. 2004. Environmental Economics. Delhi: VrindaPublications.His Majesty’s Government of Nepal (HMG). 1990. TheConstitution of the Kingdom of Nepal 1990, Article 26,Directives for Environmental Protection.Kathmandu.Khadka, N.B. 2002. Resources Conservations andManagement. Kathmandu: Buddha AcademicPublisher and Distributors.Ministry of Agriculture and Cooperatives (MOAC). 1967.Food Act 1967, with amendments in 1973, 1991 and1992. Kathmandu.Ministry of Culture, Tourism and Civil Aviation (MOTCA).1996. Tourism Policy 1995. Kathmandu.Ministry of Forest and Soil Conservation (MOFSC). 1973.The National Parks and Wildlife Conservation Act1973, amended 1993. Kathmandu.———.1993a. Community Forestry Programs—1993.Kathmandu.———.1993b. Forest Act 1993. Kathmandu.———.1996. Buffer Zone Management Regulations 1996.Kathmandu.———.2002. Nepal Biodiversity Strategy. Kathmandu.Ministry of Industry (MOI). 1992. The Industrial Policy 1992.Kathmandu.Ministry of Law and Justice (MOLJ). 1999. Local Self-Governance Act 2055 (1999). Kathmandu.Ministry of Local Development (MOLD). 1996. The NationalSolid Waste Management Policy 1996. Kathmandu.Ministry of Physical Planning and Works (MOPPW). 1999.Environmental Management. Kathmandu.Ministry of Population and Environment (MOPE). 1996.Environment Protection Act 1996. Kathmandu.———.1997. Environment Protection Regulations 1997.Kathmandu.———.2000. State of The Environment. Kathmandu.———.2002. Enabling Activities for the Preparation of theInitial Communication Related to UNFCCC.Kathmandu.Ministry of Population and Environment (MOPE) andEnvironment Sector Programme Support (ESPS).2003. Final Report on Review of the Urban andIndustrial Environmental Legislations of Nepal.Kathmandu.Ministry of Population and Environment (MOPE), SouthAsia Co-operative Environment Programme(SACEP), United Nations Environment Programme(UNEP), and Norwegian Aid Agency (NORAD). 1999.“Environment Laws and Management.” Report ofthe National Workshop, His Majesty’s Government ofNepal, Ministry of Population and Environment,Kathmandu.Ministry of Water Resources (MOWR). 1993. IrrigationPolicy. Kathmandu.———.2001. Hydro Power Development Policy 2001.Kathmandu.National Planning Commission (NPC). 1992. Eighth Plan(1992–1997), Part 1, 3, and 4. Kathmandu.———.1997. Ninth Plan (1997–2002), Chapter 1, 2, 6, 9, 10,15. Kathmandu.———.2002. Tenth Plan (2002–2007), Chapter 2, and 22.Kathmandu.———.2003. The Sustainable Development Agenda forNepal. Kathmandu.National Planning Commission (NPC) and The WorldConservation Union (IUCN). 1991. A Legislative andInstitutional Framework For Environment andManagement in Nepal. Kathmandu. His Majesty’sGovernment of Nepal, National PlanningCommission.Pandey, G.N.1998. Environmental Management. NewDelhi: Bikash Publishing House .South Asia Co-operative Environment Programme(SACEP), Norwegian Aid Agency (NORAD), andUnited Nations Environment Programme (UNEP).2000. “State of Environment Asia 2000.” Draft Report,South Asia Co-operative Environment Programme,Colombo.Shinghe, M.M. and W. Cruz. 1995. “Economywide Policiesand the Environment.” ‘World Bank EnvironmentPaper No. 10. Washington, DC: The World Bank.Sijapati, B.S. 2004 (2060 B.S.). Environmental Protection,Law and Justice. Kathmandu: Nepal Asmita BooksPublisher and DistributorsUnited Nations Development Programme (UNDP). 1997.Human Development Report: South Asia. Chapter-IV.Available:http://hdr.undp.org/reports/detail_reports.cfm?view=100United Nations Environment Programme (UNEP), SouthAsia Co-operative Environment Programme(SACEP), and Norwegian Aid Agency (NORAD).2001. Hand<strong>book</strong> on National EnvironmentalLegislation and Institution in Nepal. Colombo: SouthAsia Co-operative Environment Programme.Uprety, B.K. 2003. Environmental Impact Assessment,Process and Practice. Kathmandu: ShikharSamundra Offset.Water and Energry Commission Secretariat (WECS). 2002.Water Resources Strategy Nepal. Kathmandu.———.2004. National Water Plan (2002–2027).Kathmandu.136 Environment Assessment of Nepal : Emerging Issues and Challenges
Appendix 9.1: Environmental Standards Developed by Different PublicSector Agencies in NepalStandards related to air quality are presented in Chapter 7, Appendix 7.1.Table A9.1.1: Generic Standard s: Tolerance Limit s for Industrial (Wastewater) Effluents Discharged into InlandSurface Waters and Public SewersTolerance LimitSerialNumberParameterIndustrial Waste intoInland SurfaceWatersWastewater intoInland SurfaceWaters from CWTP aIndustrial Effluentsinto Public Sewers b1 TSS, mg/l 30–200 50 6002 Particle size of TSS Shall pass 850 -micron Shall pass 850 -micronsievesieve3 pH Value 5.5–9.0 5.5–9.0 5.5–9.04 Temperature 0 C c < 40 < 40
Table A9.1.2: Industry-Specific Tolerance Limits for Industrial Effluents Discharged into Inland Surface WatersSerialNumberParameters Generic Leather WoolProcessingFermentationVegetableGhee and OilPaper andPulp1 TSS, mg/l 30–200 100 1002Shall pass 850 -Particle size of TSSmicron sieve100 1003 pH Value 5.5–9.0 6.0–9.0 5.5–9.0 5.5–9.0 6–9 5.5–94 Temperature 0 C b < 40 405 TDS, mg/L, max 21006 Color and odor Absent c7 BOD for 5 days at 20 °C,mg/l30–100 100 100 60 100 1008 Oils and grease, mg/ l,max10 10 109 Phenolic compounds,mg/l, max1.0 5 (as C 6 H 5 OH)10 Cyanides (as CN), mg/ l,max0.211 Sulfides (as S), mg/ l, max 2.0 2.0 2.012 Insecticides Absent13 Total residual chlorine,1 600 max.mg/l14 Hexavalent chromium (as0.10.1Total 2.0Cr), mg/l, maxTotal 2.015 Nickel (as Ni), mg/ l, max 3.0 250 316 Sodium, %, max 6017 COD, mg/l, max 250 250 250°C = degrees Celsius, max = max imum, mg/l = milligram per liter, BOD = biological oxygen demand , COD = chemical oxygen demand , TDS = total dissolved solids,TSS = total suspended solidsa Under enforcement since B.S. 2058/1/17 (30 <strong>April</strong> 2001) .b Shall not exceed 40 0 C in any section within 15 m downstream from the effluent outlet.c No standards for color .Source: MOPE (2003)aTable A9.1.3: Industry-specific Tolerance Limits for Industrial Effluents Discharged into Inland Surface WatersSerial Parameters Dairy Sugar Cotton Textile SoapNumber1 pH 5.5–8.5 5.5–8.5 6.0–9.0 6.0–9.02 TSS mg/l, max 150 100 150 2003 BOD (5 days at 20 °C) mg/l, max 100 100 100 1004 Oil and Grease, mg/l , max 10 105 COD, mg/l, max 250 250 250 2506 Phenolic compounds mg/l, max 1°C = degrees Celsius, max = maxim um, mg/l = milligram per liter, BOD = biological oxygen demand , COD = chemical oxygen demand ,TSS = total suspended solidsaUnder enforcement since B.S. 2060/3/9 (23 June 2003).Source: MOPE (2003)a138 Environment Assessment of Nepal : Emerging Issues and Challenges
Appendix 9.2 Some Major Environment-related International ConventionsParticipated in by NepalConventions Related toa. Natural Resource Management1. Plant Protection Agreement for the South East Asia and the Pacific RegionDate of entry into force in Nepal: 12 August 1965Major Objectives: To prevent introduction and spread of destructive plant diseases and pestsMajor Obligations: Regulate trade in plants and plant products2. Convention on the International Trade in Endangered Species of Wild Fauna and Flora (CITES)Date of entry into force in Nepal: 16 September 1975Major Objectives: To protect and regulate the trade of wild fauna and flora and their productsMajor Obligations: All species threatened with extinction should be legally protected with appropriate measures andtrade regulated3. Convention on Wetlands of International Importance Especially as Waterfowl Habitat (Ramsar Convention)Date of entry into force in Nepal: 17 <strong>April</strong> 1988. At the beginning Koshi Tappu included in the Ramsar List; BishajariyaTal in Chitwan, Ghodaghodi Tal in Kailali, and Jagadishpur Reservoir in Kapilvastu districts included in the Ramsar Listby the Ramsar Bureau on 17 September 2003Major Objectives: To prevent the loss of wetlandsMajor Obligations: Parties should designate at least one national wetland and ensure conservation and sustainableuse of migratory stocks of wildfowl4. International Tropical Timber AgreementDate of Ratification or Accession: 3 July 1990Major Objectives: To ensure conservation and sustainable use of timber and enhance international timber tradeMajor Obligations: To implement activities for forest management and any decisions on timber trade5. Agreement on the Network of Aquaculture Centers in Asia and the PacificDate of Ratification or Accession: 4 January 1990Major Objectives: To develop aquaculture for increasing production, improving rural income and employment, andincreasing foreign exchange earningsMajor Obligations: To expand network of aquaculture centers, strengthen institutional capacity, and promoteexchange of information6. Convention on Biological Diversity (CBD)Date of entry into force in Nepal: 21 February 1994Major Objectives: To ensure conservation, sustainable use, and equitable sharing of benefits of biological diversityMajor Obligations: To prepare and implement national strategies, plans, and programs, including a nationalbiodiversity action plan, for the conservation of biodiversity under both in situ and ex situ conditions. Nepal BiodiversityStrategy approved by the Government of Nepal in August 20027. UN Convention to Combat Desertification in those Countries Experiencing Serious Drought and/orDesertification, Particularly in AfricaDate of entry into force in Nepal: 13 January 1997Major Objectives: To combat desertification and mitigate the effects of drought through effective actions at all levelsMajor Obligations: To prepare and implement National Action Programmes, and to integrate strategies for povertyreduction; National Action Programme approved by the Government of Nepal on 2 February 2004Chapter 9: Environmental Governance139
. Cultural Heritage8. Convention for the Protection of the World Cultural and Natural HeritageDate of entry into force in Nepal: 20 September 1978Major Objectives: To protect cultural and natural heritage of universal valueMajor Obligations: To ensure implementation of effective measures for the protection, conservation and preservationof national cultural and natural heritagec. Nuclear Weapons9. Treaty Banning Nuclear Weapon Tests in the Atmosphere, in Outer Space and Under WaterDate of Ratification or Accession: 7 October 1964Major Objectives: To put an end to the armaments race and eliminate incentives to the production and testing of allkinds of weaponsMajor Obligations: To prohibit, prevent any nuclear weapon test at any place10. Treaty on Principles Governing the Activities of States in the Exploration and Use of Outer Space Including theMoon and Other Celestial BodiesDate of entry into force in Nepal: 10 October 1967Major Objectives: To establish an international legal regime for the exploration and use of outer spaceMajor Obligations: To prohibit placing objects carrying nuclear weapons or other weapons of mass destruction inouter space and avoid harmful contamination of outer space11. Treaty on the Prohibition of the Emplacement of Nuclear Weapons and Other Weapons of Mass Destruction onthe Sea-bed and the Ocean Floor and in the Subsoil ThereofDate of entry into force in Nepal: <strong>18</strong> May 1972Major Objectives: To reduce the arms race and international tensions, and to maintain world peaceMajor Obligations: To prohibit placement of any weapons of mass destruction on the sea bed, ocean floor or in thesubsoil thereof, and observe and verify the activities of other parties on the sea bedd. Marine Environment12. Convention on the High SeasDate of entry into force in Nepal: 27 January 1963Major Objectives: To codify the rules of international law relating to the high seasMajor Obligations: To take measures to prevent pollution of the sea by any activitye. Waste Management13. Convention on the Prevention of Marine Pollution by Dumping of Wastes and Other MatterDate of Ratification or Accession : 1 January 1973Major Objectives: To control pollution of the seaMajor Obligations: To prohibit dumping or deliberate disposal of wastes in the sea14. Basel Convention on the Control of Transboundary Movements of Hazardous Wastes (Basel Convention)Date of entry into force in Nepal: 13 January 1997Major Objectives: To regulate the transboundary movements of hazardous wasteMajor Obligations: To define hazardous waste, and prohibit and/or regulate the movements of such wastef. Ozone Layer Protection15.a Vienna Convention for the Protection of the Ozone Layer (Vienna Convention)Date of entry into force in Nepal: 4 October 1994Major Objectives: To protect human health and the environment against adverse effects of the modification of ozonelayerMajor Obligations: Limit and/or eliminate the use of ozone-layer depleting substances140 Environment Assessment of Nepal : Emerging Issues and Challenges
15.b Montreal Protocol on Substances that Deplete the Ozone Layer (Montreal Protocol)Date of entry into force in Nepal: 4 October 1994Major Objectives: To protect the ozone layer by controlling the emissions of substances that deplete itMajor Obligations: To control annual consumption and production of substances that deplete the ozone layer15.c London Amendment to the Montreal Protocol on Substances that Deplete the Ozone Layer (London Amendment)Date of entry into force in Nepal: 4 October 1994Major Objectives: To strengthen the control procedures and to establish financial mechanisms for the protocolMajor Obligations: To amend the protocol to phase out the production of some of the substances that deplete theozone layer, and to establish financial mechanisms and a clearing-house function for the implementation of theprotocolg. Climate Change16. United Nations Framework Convention on Climate Change (UNFCC)Date of entry into force in Nepal : 31 July 1994Major Objectives: To stabilize greenhouse gas concentrations in the atmosphere within a time frameMajor Obligations: Adopt precautionary measures to minimize or prevent the release of greenhouse gases andmitigate the effects of climate changeConventions Only Signed17. Convention on the Prohibition of the Development, Production and Stockpiling of Bacteriological (Biological)and Toxic Weapons and on their DestructionDate of Adoption: 10 <strong>April</strong> 1972Date of Nepal’s signature: 10 <strong>April</strong> 1972Major Objectives: To prohibit the development of biological weapons and eliminate themMajor Obligations: To prohibit development, production, stockpiling, or acquisition or retention of any biologicalweapons, and promote their destruction<strong>18</strong>. UN Convention on the Law of the SeaDate of Adoption: 10 December 1982Date of Nepal’s signature: 10 December 1982Major Objectives: To develop a comprehensive new legal regime for the sea with environmental provisionsMajor Obligations: To define territorial sea and exclusive economic zones, and to develop sea resources for humanbeings19. Convention on Fishing and Conservation of the Living Resources of the High SeasDate of Adoption: 29 <strong>April</strong> 1958Date of Nepal’s signature: 29 <strong>April</strong> 1958Major Objectives: To conserve the living resources of the seaMajor Obligations: To adopt necessary measures for the conservation of the living resources of the high seas, andsupply of food for human consumption20. Convention on the Continental ShelfDate of Adoption: 29 <strong>April</strong> 1958Date of Nepal’s signature: 29 <strong>April</strong> 1958Major Objectives: To delimit the rights of states to explore and exploit the natural resources of the continental shelfMajor Obligations: To regulate the interference with navigation, fishing or the conservation of the living resources ofthe sea by the exploration or exploitation activities of coastal states21. Stockholm Convention on Persistent Organic Pollutants (POPs)Date of Nepal’s signature: 5 <strong>April</strong> 2002Major Objectives: to eliminate or restrict production and use of Persistent organic pollutants including pesticides andindustrial chemicals as well as to restrict their trade with the final goal of banning production, trade and use of POPsMajor Obligations: Signatory countries are obliged to support and comply with the provisions of UNEP’s policy ofphasing persistent organic pollutants out or limiting their production and use.Chapter 9: Environmental Governance141
Appendix 9.3: Some Prominent Environmental NGOs in Nepal(i) Association for Protection of Environmentand Culture (APEC-NEPAL), established in1988, applies a multidisciplinary approach toprotection of wildlife, forests, and wetlands,and to management of renewable resources.Numerous programs are described.(ii) Clean Energy Nepal (CEN) promotesconservation and sustainable energy use,especially in Kathmandu Valley, throughcampaigns and public education. It has anewsletter and publications.(iii) Concern for Children and Environment —Nepal (CONCERN), established in 1993,(iv)works in child development.Discover Nepal, established in 1998, placestrained volunteers in rural and urbansecondary schools, as well as inenvironmental, health, and tourismprograms.(v) Institute for <strong>Himalayan</strong> Conservation —Nepal (IHC-Nepal) continues programsinitiated by IHC-Japan, which created theMulti-dimensional Annapurna Conservation(MAC) Project in Mustang and Myagdi. Theseprograms focus on forestry management,environmental education, use of appropriatetechnologies, health awareness, ecotourism,and local capacity building.(vi)International Institute for Human Rights,Environment and Development (INHUREDInternational), since 1987, monitorsviolations of human and environmentalrights. In 1993 it won a major campaign onthe Arun III Hydroelectric Project. It haspublications, audio and video cassettes, andarticles.(vii) IUCN Nepal, since 1973, works to protectenvironmentally sensitive areas and wildlifespecies through numerous projects. Manypublications are available. It is in the WorldConservation Union (IUCN).(viii) King Mahendra Trust for Nature Conservation(KMTNC) works broadly to protect andconserve the natural and cultural heritage ofNepal.(ix)(x)(xi)Nepal Forum of Environmental Journalists(NEFEJ), begun in 1986, promotes theparticipation of mass media in raising publicawareness about the environment andsustainable development.Nepal River Conservation Trust (NRCT),established in 1995, works towardsconserving Nepal’s <strong>Himalayan</strong> river system,preserving cultural heritage, and developingan environmentally responsible river tourismindustry.Rhododendron Research Project, sponsoredby the Norwegian Research Council, aims toidentify climatic limits for rhododendronsfound in Nepal, with the long-term aim ofstimulating local economies and helpingwith reforestation.(xii) South Asian Network for Development andEnvironmental Economics (SANDEE), startedin Kathmandu, addresses environmental anddevelopmental challenges for participatingSouth Asia countries.(xiii) The Mountain Institute (TMI) operatesprojects to protect the biodiversity andcultural heritage in the Himalayas.(xiv) World Wide Fund for Nature (WWF) NepalProgramme, working in Nepal since 1967,has numerous conservation projects andprograms.(xv) SEEDS (Social Educational EnvironmentalDevelopment Services), since 1998, funds awide range of grass-roots development andrelief projects in remote rural areas.(xvi) Alliance for Environmental Protection, Nepal(AEPN), provides consultancy services formatters related to environmentalmanagement and protection.(xvii) Environment and Public Health OrganizationNepal (ENPHO), conducts water and airquality analysis and provides laboratoryservices for the same.142 Environment Assessment of Nepal : Emerging Issues and Challenges
Chapter 10Environmental FinancingIntroductionEnvironmental financing is a new area ofconcern in Nepal. Once the benefits ofconserving the environment are understood,budgetary allocations for national and localenvironmental programs will increase. At presentenvironmental financing takes place in national andlocal budget allocations. Nepal has realized theimportance of conserving environmental and naturalresources through policies, legal measures, andinstitutional development. Institutions such as theMinistry of Environment, Science, and Technology(MOEST); and the ministries of Forests and SoilConservation, Water Resources, Agriculture andCooperatives, and Industry play major roles inenvironmental programs and therefore inenvironmental financing.Based on the State of the Environment report(UNEP 2001), Nepal has identified 17 environmentalissues of national significance, classified as mosturgent, moderately urgent, and less urgent butsignificant. The most urgent environmental issuesare: land degradation, forest depletion, solid waste,water pollution, and air pollution. The first two issuespertain to rural areas, where over 80% of thepopulation lives; the latter three are outcomes ofhaphazard urban development and inadequateconsideration of environmental aspects duringurbanization and industrialization.Moderately urgent environmental issuesidentified include: dwindling biodiversity, desertification,noise pollution, forest fires, groundwaterpollution, glacial lake outburst flood events, foodsecurity, and alternative energy. Of these, biodiversityand desertification also have long-term implicationsfor food security. Groundwater depletion, particularlyin Kathmandu Valley, has been a major concern.Other environmental problems that are less urgent interms of the need for implementation but stillsignificant include loss of aquatic fish, haphazardurbanization, depletion of biomass energy, andtransboundary movement of wastes.Environmental financing is required inmanaging forests and land resources, and inminimizing water and air pollution. In rural areas,most of the funds are required for the conservation,management, and sustainable use of the naturalresource base, particularly forest, soil, and waterconservation, water harvesting, and mineralresources. As most of the people depend uponagriculture, financing is necessary for promotion andexpansion of sustainable agricultural systems toreduce poverty and to ensure food security.Ultimately, this will reduce loss of fertile topsoil andpromote water retention. In urban areas,environmental financing is urgently required for theimprovement of water and air quality, solid wastemanagement, and reducing noise levels.Domestic SourcesA number of domestic sources could generate theneeded funds. Some of the potential areas are thesustainable use of water resources, and mining ofprecious metals, forests, and wildlife. There are vastpotentials for hydroelectricity generation,development of irrigation schemes, and promotionof navigation and recreational sports. Deposits ofprecious metals can be explored and utilized in anenvironmentally friendly way. In the forestry sector,there is a vast potential for sustainable utilization ofnon-timber forest products (NTFPs) such as leaf,bark, fruits, and roots. Commercially valued plantspecies could also be planted and harvested onbarren or public or private land as income generationactivities. Some of the nurseries developed forpromotion of NTFPs have shown potential fordevelopment and promotion. The public and privatesector have been developing such nurseries indifferent parts of the country. A nursery developedand maintained by the Rural Development ServiceCenter in Doti district can be taken as an example.Protected areas are an emerging sector where ecotourismcould be promoted. Some of the commonwild animals could also be utilized and/ordomesticated and marketed. These funds could berecycled for environmental and natural resourceconservation. The above activities are envisaged tobe undertaken by public-private participation withsupport from donors as needed.Chapter 10: Environmental Financing143
Some funding arrangements made by thegovernment for natural resource management aresummarized below.National Level FundingThe Ministry of Finance disburses funds on the basisof the approved annual budget. Reviewing thedevelopment outlay from 1985 to 2002, there is anincreasing trend towards funding sectors likeagriculture, forestry, water resources, mining, andlocal development. About 14% of the total budget hasbeen allocated to these sectors for the Tenth Plan(2002–2007) period. The budget outlay is severaltimes more in the water resources, electricity, andirrigation sectors than the environment in generaland forest management in particular.About NRs 11 million were allocated to theenvironment sector from 1985 to 1990. For the TenthPlan period, about NRs 111 million have beenallocated for environmental activities in the country,about 0.05% of the total proposed developmentoutlays of NRs 234,030 million (Figure 10.1).The Tenth Plan identified a number of environmentalactivities and prioritized them. The firstpriority programs included pollution control andprevention, environmental impact assessment, andenvironmental awareness raising. The second priorityprojects included urban parks, land use planning,environmental standards, and monitoring. MOEST isresponsible for implementing these programs.Similar funds have been allocated for theconservation, development, and management offorests and protected areas. Next to forest relatedactivities, land and watershed degradation is ofmajor concern in the sustainable management ofnatural resources. These activities receivecomparatively larger budgetary allocation.The development budget allocations for theforestry sector indicate higher Government fundingthan grants from bilateral and multilateral agencies(Figure 10.2). The Government’s policy has been todiscourage taking loans in the forestry sector and toincrease recycling of the funds generated throughmanagement of protected areas and through thesustainable use of forest resources. Nevertheless,foreign assistance in the form of grants has increasedfrom FY2001 onwards. The Department of Forest,which has a countrywide institutional network,receives funds both from the Government and fromdonors to carry out various forestry activities (Figure10.3). In the mean time the funds required formanagement of protected areas come from thenational consolidated fund.Budget allocations for plant resourcesmanagement, and forest survey and research arevery low, indicating inadequate attention to theseFigure 10.1: Development Outlay in Major Sectors(1985–2007)Source: 7th–10th Five Year Plan documentsFigure 10.2 Program Cost in the Natural ResourceManagement SectorSource: Ministry of Forest and Soil Conservation recordsFigure 10.3: Budget Allocation for Different Programs inthe Forestry SectorSource: Ministry of Forest and Soil Conservation records144 Environment Assessment of Nepal : Emerging Issues and Challenges
areas. Similarly, the Department of Plant Resourceswhich implements activities related to plantexploration, ex-situ conservation of plant diversity,and phyto-chemical research, has low funding. TwoGovernment companies, Royal Drugs Limited andHerbs Processing and Production Center Limited,were established to produce medicines from plantsand herbs. All phyto-chemical and bio-technologicalresearch activities for their establishment wereconducted by the Department of Plant Resources.Other ministries such as Agriculture, WaterResources, Physical Planning and Works, andTransport, and the municipalities also have fundsavailable for environment-related activities. Theseinclude funds for sector-specific environmentalimpact assessment activities, some environmentallyfriendly measures (such as organic agriculture androadside planting), and solid waste management.The funds committed by the Government for theseactivities are channeled to the research agenciesconcerned through related government departments.These agencies usually have difficulties inreceiving allocated funds on time.Environment Conservation FundThe Government of Nepal established the EnvironmentConservation Fund under the EnvironmentProtection Council in 1993 to finance environmentalactivities. Section 13 of the Environment ProtectionAct 1996 has provisions to establish a fund forprotection of the environment, control of pollution,and protection of National Heritage sites. Fundsreceived from the Government of Nepal, foreigngovernments or international organizations, andother sources are deposited in this fund, which isaudited by the Auditor General of Nepal.In order to administer this fund, the EnvironmentProtection Regulations 1997 also provide for aManaging Committee under the chairmanship of theSecretary of the Ministry of Environment, Scienceand Technology. The committee has representativesfrom the National Planning Commission Secretariat,Ministry of Finance, Nepal Rastra Bank (CentralBank), Federation of Nepalese Chambers ofCommerce and Industries, and an environmentalexpert or chief of an environment-related nongovernmentorganization (NGO).Over the years, about NRs 40 million has beendeposited in this fund. So far, no donor agencies orprivate sector groups have supported this fund. Thefund was used in 1997 and 1998 by 15–20 localenvironmental NGOs from different districts of thecountry for implementing environment conservationand pollution control activities. However, due to theunsatisfactory performance of these NGOs, furtherallocation of funds was abandoned.Poverty Alleviation FundThe Government of Nepal established the PovertyAlleviation Fund (NPC 2003) in 2004 with supportfrom the World Bank; it will remain effective until2009. The main objective of the fund is to supportNepal to reduce poverty by improving the access toincome generation projects and communityinfrastructure for marginalized groups, includingenvironmental management.The Poverty Alleviation Fund has also focusedon environmental management to improve thelivelihoods of the poor and conserve the environment.It seeks to reduce poverty by (i) preventing ormitigating negative environmental impacts that mayemerge from sub-projects, (ii) ensuring the longtermsustainability of benefits from sub-projects bysecuring the natural resources base on which theydepend, and (iii) facilitating projects that increasesustainable use and improvements in localenvironmental quality and human well-being.The Fund finances demand-driven projectsunder several broad categories: income generation,infrastructure, and innovative and special programs.The fund was to be provided in the areas of livestockdevelopment, minor irrigation, agricultural development,forest products, infrastructure development,and micro enterprises. These projects should meetthe criteria of productivity, equity, and sustainability.The fund has also focused on developing “environmentalcodes of practice” consonant with WorldBank guidelines. The Codes of Practice includeenvironmental compliance requirements and bestpractice guidelines for mitigation of environmentalimpacts.National Agricultural Research andDevelopment FundThe Government of Nepal established the NationalAgricultural Research and Development Fund inDecember 2001 in accordance with the provision ofthe Working Fund Act, 1986 (B.S. 2043) to providefunding for action research in the agriculture sector.The fund will be allocated for research anddevelopment in five areas: productivity of thefarming system, crop research and extension,livestock and fisheries research and extension,sustainable utilization of natural resources andprotection of the resource base and the environment,and NTFPs and crops in the Hills.The budget for the fiscal year 2005 is NRs 70million from the Hill Agriculture Research Project,which is funded by the UK Department forInternational Development (DFID), and the CropDiversification Project. The Fund has provided a totalof NRs 24 million for the development of 15 projectsChapter 10: Environmental Financing145
(NARDF 2004) for a period of 1 to 3 years startingfrom 2003 for individual projects (Table 10.1). Almostall the research projects are related to increasingagricultural products on a sustainable basis, whichrequires addressing many environmental issuesrelated to such things as the use of fertilizers andpesticides, water, and controlling soil erosion.Power Development FundThe Government established the Power DevelopmentFund for initial loan financing for promotinghydropower projects ranging from 1 to 50 MW. This isaimed at improving the rural population’s access toelectricity services. Initial funding of $35 million forselected projects will be provided by theInternational Development Association. Over time,resources from other international and domesticfinancial institutions will also be mobilized todevelop the aforementioned projects by the privatesector. The Fund operates under the directsupervision and management control of the PowerDevelopment Fund Board. It is administered by thePower Development Fund Administrator who isselected through competitive bidding. Currently theNepal Bangladesh Bank has been appointed as theAdministrator. For accessibility to the fund,investment projects must be environmentally soundand should have been scrutinized through an initialenvironmental examination (IEE) or environmentalimpact assessment (EIA) process as appropriate(PDFB 2005).Rural Water Supply and Sanitation FundThe Government of Nepal established the RuralWater Supply and Sanitation Fund in 1996 (B.S. 2052)as per Section 3(1) of the Development Board Act,1957 (B.S. 2013). The purpose is to develop ruraldrinking water and sanitation projects sustainably,reliably, and at reasonable cost by mobilizing andproviding financial, technical, and organizationalTable 10.1: Major Projects Funded by the National Agricultural Research and Development Fund (NARDF)SerialProject CostProjectDurationNumber(NRs)1 Improvement in post -harvest handling and ripening of banana s 3 years2,073,500(Jul '03–Jun '06)2 Development and dissemination of honey production technology 3 years17,21,550(Jul '03–Jun '06)3 Improvement in fruit set of brinjal and chillies 3 years 2,116,0004 Addressing food security through identification of farmer preferred crop 3 years2,858,800varieties and by strengthening local seed supply system s in the ruralcommunities of western Nepal(mid-Oct. '03–mid-Oct.'06)5 Study on the improvement of productivity and production of oilseed 3 years 2,146,800crops through integrated crop management practices in t he midwesternregion of Nepal6 Shiitake mushroom production promotion through entrepreneurship 2 years 1,845,750development among hill farmers7 Improvement of the vegetable marketing system through farmers 3 years1,595,463cooperative s in Chitwan an d Dhading districts(Jul '03–Jun '06)8 Identification and promotion of commercial agricultural opportunities for 3 years1,760,110farmers within the new Hile-Bhojpur road corridor(Jul '03–Jul '06)9 Understanding potential and critic al constraints to marketing goats in 1 year527,563the western hills of Nepal1 Nov. '03–31 Oct. '0410 Improving livelihoods of resource -poor farmers through on -farm seed 2.5 years 1,067,200priming in the western hills of Nepal11 Increase the income , nutrition, and food security of hill farmers through 2 years 827,885introducing the French bean in maize -based cropping system s12 Development of technologies for year -round production of cucumber in 3 years 1,864,150the hills of Nepal13 Development of nutrition management strategies to improve the 2 years and 10 months 1,973,837productivity of Pakhribas pig14 Promotion of wilt management technology on lentil, chickpea, and 3 years1,519,265pigeon pea in mid - and far-western Terai15 Exploring the formation of well -organized marketing cooperatives inJumla and Dailekh for promoting commercial production and exportmarketing of apples and oranges, respectively, including other highvalue agricultural productsSource: NARDF (2004)Jul '03–Jun '062 years 1,903,025Total 24,100,915146 Environment Assessment of Nepal : Emerging Issues and Challenges
support to consumer groups and cooperatingagencies. This fund is administered by the RuralWater Supply and Sanitation Fund DevelopmentBoard established on 14 March 1996. It promotessustainable and cost effective demand-led ruralwater supply and sanitation services in partnershipwith NGOs and private organizations, with fullemphasis on community ownership in conformitywith the Government’s Eighth Plan (1992–1997),Ninth Plan (1997–2002), and Tenth Plan (2002–2007)policies.The Ministry of Physical Planning and Works isthe line ministry for the Board. The Board is designedbased on the experience of a field testing pilotproject, JAKPAS (the Nepali acronym of Janata KoKhanepani Ra Sarsafai Karyakram, meaning People’sWater Supply and Sanitation Programme). The Fundis supported by the United Nations DevelopmentProgramme and a grant from the Japanese GrantFacility. The World Bank executed a pilot project forthree years during 1993–1996, financed by twoadditional Japanese Grant Facility grants. The Boardhas completed its First Phase (1996–2003)successfully and entered into the Second Phase(2004–2009) to support rural communities onimplementing water supply and sanitation schemes.The Board is being funded by the World Bank,International Development Association, and DFID.The Board has full operational autonomy and issupervised and managed by seven members.The Board has adopted a demand-ledparticipatory approach for increasing communitycapacity to sustain the project; enhancement of therole of women in all aspects of the project; andintegration of hygiene and sanitation education withtechnically, environmentally, and operationallysustainable water supply.Nepal has gained experience in managing thisfund. It has been operated to supply additionaldrinking water and sanitation facilities to the ruralpoor. This fund also has direct input in improvinghealth and sanitation conditions and reducing theenvironmental health problems that rural peopleface.Funds Generated by Community-basedOrganizationsThere are different types of community-basedorganizations involved in natural resourcemanagement activities. Community forestryprograms were launched by the Government ofNepal as early as 1978. They have been implementedmore vigorously since promulgation of the Forest Actin 1993. Community forest user groups (CFUGs) havebeen involved in the development, conservation, andsustainable use of forest resources. The Forest Act1993 empowers the CFUGs to generate funds fromcommunity forests and utilize them for communitydevelopment. However, the CFUGs have to invest atleast 25% of the total income in forest managementand development. The total income of CFUGsincludes income from the sale of forest products andother sources. About 90% of the total income in theHills is from the sale of forest products (Table 10.2).Most of the income has been spent forcommunity development activities, in particularinfrastructure development (MOFSC 1993). TheCFUGs are spending about 30% on forestry activitiessuch as forest watchers and silvicultural operations.Community forestry has become one of the majorsources of income in rural Nepal, and this incomehas been instrumental in enhancing communitydevelopment activities.Another important source of income for naturalresource management and community developmentis from the protected areas, which cover about <strong>18</strong>%of the total area of the country and have generatedsubstantial revenue through ecotourism activities.The National Parks and Wildlife Conservation Act1973 in its fourth amendment in 1993 provides that 30to 50% of the total revenue generated in the nationalparks and wildlife reserves be used for buffer zonemanagement and community developmentactivities. In accordance with this Act and BufferZone Management Regulations 1996 (MOFSC 1996),the Government has declared buffer zones for 6national parks and 2 wildlife reserves. The bufferzone area totals nearly 4,300 km 2 out of the country’stotal land area of 147,000 km 2 .The Buffer Zone Management Regulations 1996authorizes collection of resources for communitydevelopment, particularly in buffer zone areas. Theprotected areas are divided into national parks, andwildlife reserves and conservation areas. The sourceof revenue is the tourist flow in the protected areas.The national parks are generating more income thanthe wildlife reserves, hunting reserves, andconservation areas (Figure 10.4). Regardingconservation areas, the Government only managesand collects revenue from the KanchenjungaConservation Area, while the Annapurna andManaslu Conservation Areas are managed by theKing Mahendra Trust for Nature Conservation(KMTNC). The amount shown in Figure 10.4 onlyreflects the Government’s revenue.Buffer zone users are using the funds receivedfor a number of community development activities,including community forestry development, conservation,and management; riverbank protection andcompensation to affected families from riverbankcutting; community plantation and conservation;nursery establishment and sapling distribution;Chapter 10: Environmental Financing147
Table 10.2: Annual Income and Expenditure of Community Forestry User Groups (NRs)Items Terai % Hills % Total %Income SourceForest product sale 143,305,329 59.15 604,074,653 90.40 747,379,982 82.08GO/NGO grants 4,040,627 1.67 4,040,627 0.60 8,081,254 0.89Fine/punishment 1,921,990 0.79 2,981,133 0.45 4,903,123 0.54Membership fees 5,062,717 2.09 6,688,963 1.00 11,751,680 1.29Entrance fees 2,359,803 0.97 2,417,298 0.36 4,777,101 0.52Other income 85,487,836 35.29 27,040,978 4.05 112,528,814 12.36Last year balance 90,253 0.04 20,999,190 3.14 21,089,443 2.32Total income 242,268,555 100 668,242,842 100.00 910,511,397 100.00Annual ExpenditureForest watcher 27,488,708 14.99 <strong>18</strong>,674,938 6.83 46,163,646 10.10Silvicultural operations 31,108,914 16.97 52,773,342 19.29 83,882,256 <strong>18</strong>.36Training, study tour workshops 2,908,653 1.59 5,838,382 2.13 8,747,035 1.91Stationery 3,780,050 2.06 26,556,550 9.71 30,336,600 6.64Building construction 12,097,447 6.60 17,875,924 6.53 29,973,371 6.56Rent/equipment 2,004,638 1.09 1,902,831 0.70 3,907,469 0.86Salary/allowance 13,893,684 7.58 5,494,599 2.01 19,388,283 4.24Meeting/assembly 7,520,316 4.10 1,390,590 0.51 8,910,906 1.95Other group operational 0 0.00 226,268 0.08 226,268 0.05School support 11,120,1<strong>18</strong> 6.07 23,872,342 8.73 34,992,460 7.66Road construction 995,638 0.54 22,361,760 8.17 23,357,398 5.11Other infrastructure <strong>18</strong>,5<strong>18</strong>,452 10.10 57,491,735 21.01 76,010,<strong>18</strong>7 16.63Pro-poor program 1,608,566 0.88 11,041,367 4.04 12,649,933 2.77Miscellaneous 50,301,431 27.44 28,096,062 10.27 78,397,493 17.16Total cost (NRs) <strong>18</strong>3,346,615 100.00 273,596,690 100.00 456,943,305 100.00GO = government organization, NGO = non government organizationSource: Kanel (2004)conservation of endangered species; tourismdevelopment and conservation of historical andarchaeological sites; and wetland conservation anddevelopment within the buffer zone areas.As empowered by the Buffer Zone ManagementRegulations 1996, the buffer zone users have alsostarted community savings and biodiversity funds. Asthe protected areas are set aside for the conservationof biodiversity, buffer zone users have emphasizedconserving species of plants and animals in thenational parks and wildlife reserves and also in thebuffer zones. In four national parks and three wildlifereserves, a total of NRs 62 million have been saved inthe form of community savings during 1997 to 2004;of these NRs 26 million have been set aside as abiodiversity fund (Figure 10.5). The biodiversity fundwill be extensively utilized for the conservation oflegally protected, endangered, rare, threatened, andvulnerable species.Community development groups have alsobeen mobilized for the conservation of soil and waterresources. The Department of Soil Conservation andWatershed Management has promoted theformation of such groups. The Government providedup to 80% of the total cost for terrace improvementand off-farm conservation activities during the early1980s. As per the information provided by theDepartment, the Government has been phasing outthe subsidies, which had been reduced by about 50%by 2002. The cost sharing is based on the nature ofthe activity and the magnitude of the problems.Figure 10.4: Government Revenue from ProtectedAreas (excluding the Annapurna and ManasluConservation Areas)Source: Ministry of Forest and Soil Conservation records148 Environment Assessment of Nepal : Emerging Issues and Challenges
Figure 10.5: Community Savings and Biodiversity Fundsin Protected AreasKNP = Khaptad National Park, KTWR = Koshi Tappu Wildlife Reserve,PWR = Parsa Wildlife Reserve, RBNP = Royal Bardia National Park,RCNP = Royal Chitwan National Park, RNP = Rara National Park,RSWR = Royal Suklaphanta Wildlife ReserveSource: Ministry of Forest and Soil Conservation recordsThese additional incentives and formation ofcommunity development groups have beeninstrumental in encouraging local people to improvenatural resources management, particularly soil andwater conservation.The Government has also initiated collaborativeforest management since 2003 in selected districts ofthe Terai with the objective of managing the foreststhrough the joint participation of users, local bodies,and the Government. The major stakeholdersinclude forestry organizations, particularly theregional forestry directorates and district forestoffices, local bodies such as district developmentcommittees and village development committees,and user groups. The Collaborative ForestManagement Manual (MOFSC 2004) provides forestablishing both “revolving funds” and“development funds.” The former will be utilized forthe commercial felling and transportation of forestproducts (timber and firewood), and thedevelopment fund will be used for developmentactivities. The Government has planned to replenishboth funds though donor assistance. Thedevelopment fund will later be converted to a districtforest sector investment fund and utilized forintensive forest management.The Government of Nepal has also developed amechanism to share the Collaborative ForestManagement benefits. Twenty-five percent of therevenue generated from the sale of timber andfirewood under the scheme will be deposited in thelocal fund and the remainder will go to the nationalconsolidated fund. Funds for local use will bedispersed by the District Forestry SectorDevelopment Coordination Sub-Committee, andsome portion of this fund will be set aside for theimplementation of the Collaborative ForestManagement scheme (MOFSC 2004).The Irrigation Policy 2003 acknowledgespeople’s participation in irrigation development,particularly the involvement of water usersassociations. The policy outlines the framework forcost sharing for the construction of irrigation canalsystems and also provides a framework forownership development (Table 10.3).The Irrigation Policy provides the frameworkshown in Table 10.3. The benefit sharing is based onthe workload for management of the irrigationschemes. After construction of the irrigation project,The Government can hand over managementresponsibility to the water users association, andabout 95% of the benefits derived from irrigation feesare deposited into the users’ fund. This enhances thepossibility for generating more funds for irrigationwater management and opportunities for involvingthe beneficiaries in the process (see Table 10.4). Asthe irrigation projects are scattered, there aredifficulties in fully assessing the funds generated bythis policy. However, they are expected to besignificant.Table 10.3: Users’ Share in Irrigation ProjectConstructionAverageIrrigable AreaPercentage of Share (of TotalInvestment)Main BranchCanal CanalHeadworkDistributionCanalLess than 0.5 ha 0 0 0 10O.5 ha–1.0 ha 0 0 5 101.0 ha–5.0 ha 1 3 7 125 ha or above 3 5 10 15ha = hectareSource: MOWR (1993)Private Sector InvestmentPrivate sector organizations are also involved inenvironmental management, particularly forpollution control. Some of the breweries such asTuborg Beer Company at Nawalparasi District andSan Miguel Beer Company at Chitwan District havedeveloped effluent treatment plants to treat theirchemical and biological wastes. The Governmenthas also introduced an environmental managementsystem and energy conservation scheme in selectedindustries with the assistance of Danish InternationalDevelopment Agency (DANIDA) to reduce pollutionload at source. Some industries are practicingenvironmental management systems. For example,the Godavari Marble Factory located at Godavari inLalitpur district of Kathmandu Valley has joined theenvironmental management systems program. Anumber of environmental problems have cropped upduring mining and processing of marble. The areaexperiences the loss of topsoil and plants, noise, andChapter 10: Environmental Financing149
Table 10.4: Users’ Share in Benefits from Irrigation ProjectsParticipation in Irrigation System Implementationdust from drilling and blasting activities. Duringmarble processing activities, significant amounts ofsludge are also generated. The factory has had toinvest in many areas to improve the quality of theenvironment.External SourcesBesides national and local level environmentalfinancing, Nepal also receives assistance from theinternational community and funding agencies.Grant Assistance from DonorsThe Government has continuously received grantassistance in the forestry sector (Table 10.5). Thefunding ranges from forestry management tolivelihood issues. Currently, the Government hasimplemented forestry development andmanagement programs with assistance totalingslightly over US$ 47 million. In the forestry sector,DANIDA and DFID are the two major donors of recentyears. As DANIDA’s current support ended in July2005, DFID will be the most important donorproviding grant assistance to the forestry sector.Similarly, the agricultural sector receives grantsfrom donor agencies for the implementation ofagricultural programs and projects. At present, thissector has a total of 14 projects (Table 10.6).Loan Assistance from DonorsAlthough the Government has attempted to avoidloan assistance in the forestry sector, it hasnevertheless taken about $11.7 million in loans fromthe International Fund for Agricultural Developmentto implement the Leasehold Forest and LivestockDevelopment Programme for the period fromJanuary 2005 to December 2013.Sharing of Benefits Obtained from Irrigation Fee (%)Central MaintenanceFund, Department ofIrrigationGovernmentRevenueTariffs and SubsidiesWater UsersAssociationGovernment-managed scheme (kulo) area before water distribution 40 40 20Government-managed irrigation canal above distribution canal 30 30 40Government-managed irrigation canal above branch canal 20 20 60Government-managed irrigation canal abo ve main canal 10 10 80Government’s involvement only in headwork management 5 5 90All management responsibility handed over to users 0 5 95Note: the remaining parts of the kulo or canal are managedSource: MOWR (1993)by the water users associations.TariffsTariffs and subsidies for environment and naturalresources related sectors are another source offunds. The Government provides subsidies ontariffs/prices for electricity, water supply, communityforestry, and community irrigation schemes asincentives for improved environmental management.Many of these initiatives are relatively new.The Nepal Electricity Authority has implementedtariffs on the consumption of electricity for domestic,industrial, commercial, transport, and otherpurposes; the tariffs vary by type of use and quantityof energy consumed. It uses the revenues generatedthrough application of these tariffs for extension ofthe power grid, maintenance and operation of itssystem, and debt servicing. The Nepal Water SupplyCorporation charges tariffs for the use of municipalwater and sewage. Currently the tariff onconsumption of tapped drinking water is NRs 15.00per thousand liters. In principle some of this revenueis reinvested to help improve the system. The NepalWater Supply Corporation and Nepal Water Supplyand Sewerage Department develop water supplysystems in small towns and hand them over to users’groups. In return for maintaining these systems, theGovernment provides the users’ groups grants of50%, and loans of 30% (at 8% interest, withrepayment in 12 years) from town developmentfunds so that only 20% of the requirements need tobe met by the community itself.Similarly, royalties are imposed on the utilizationof forest products, water resources, and othersthrough the licensing process. Through the Forest Act1993 and the Forest Regulations 1995 (MOFSC 1995)the Government collects revenue on the use oftimber and NTFPs and medicinal and aromatic150 Environment Assessment of Nepal : Emerging Issues and Challenges
Table 10.5: Some Major Grant Projects in the Forestry Sector (as of March 2005)ProjectBudgetNameFunding AgencyDurationCoverage($‘000)Livelihood and Forestry Project 15 districts DFID–UK Government Mar. '01–Feb. '11 26,882Nepal Australia Communi ty ResourceManagement and Livelihood ProjectCommunity Development and Forest WatershedConservation (Phase II)Biodiversity Sector Programme for Siwaliks andTeraiParticipatory Conservation Programme(Phase II)Terai Arc Landscape Conservation Project2 districts Aus-AID Feb. '03–Jan. '06 12,3942 districts JICA/JOVC Jul '04–Jul 2005 —8 districts SNV 2002–2005 10,6907 nationalparks andbuffer zonesUNDP May '04–Dec. '06 1,000Landscape of WWF Nepal Program Jul '01–Jul '06 6,000Terai Arc4 districts CARE Nepal/ USAID 2002–2006 5,600Strengthened Advocacy for Governed Utilization ofNatural Resources ProgrammeWestern Terai Landscape Complex Project 3 districts UNDP, SNV, WWF, IPGRI, Oct. '03–Oct. '11 12,827NARC, LIBIRDConservation and Sustain able Use of Wetlands in 4 districts IUCN/UNDP 2004–2009 4,988NepalChuriya Watershed Management Project 2 districts CARE Nepal Mar. '01–Feb. '06 1,978Community Incentives to Reduce LanduseConflict and Conserve Biodiversity in NepalNatural Resource Management Sector AssistanceProgramme (Phase I extension)Sustainable Management and Utilization of NTFPsin the Terai Region of NepalKoshi Tappu GEF/UNDP 2004–2005 194WR38 districts DANIDA Jul '04–Jul '05 3,8463 districts ITTO 3 years (afteragreement)— = not available , AusAid = Australian Aid, DANID A = Danish International Development Agency , DFID = Department for International Development ,GEF = Global Environment Facility , IPGRI = International Plant Genetic Resources Institute, ITTO = Inte rnational Tropical Timber Council, IUCN = World ConservationUnion, JICA = Japan International Cooperation Agency, JOVC = Japan Overseas Volunteer Cooperation, LIBIRD = Local Initiatives for Biodiversity Research andDevelopment, NARC = Nepal Agricultural Research Council, SNV = Netherlands Development Organiz ation, UK = United K ingdom, UNDP = United NationsDevelopment Program me, USAID = United States Agency for International Development, WW F = World Wide Fund for NatureSource: MOFSC (2005)312Table 10.6: Some Major Grant Projects in the Agricultural SectorName Project Coverage Funding Agency Duration BudgetJanakpur Agricultural Development Project Dhanusa, Mahottari Japan KR-2 1972 and yearly —and Siraha, and otherTerai districtsDistrict and National Implementation of 20 districts DFID 2003–2007 £9.87 millionAgricultural Perspective PlanLivestock Service Extension Programme 61 districts Yearly NRs 60 millionCrop Diversion Project12 districts of MWDR <strong>ADB</strong> 2002–2007 NRs 11 millionand FWDRMaize-based Cropping SystemMaize-based cropping SDC 2003–2007 NRs 2.7 millionareasSustainable Soil Management Project 12 districts SDC 2003–2007 SwF 4.5 millionAgriculture Training and Extension Project 5 districts JICA 2004–2008 —Food Security Programme for Nepal 4 districts France 2004–2007 —Support to the National Integrated PestManagement Programme in NepalHimalaya Tea Technology Outreach andExtension Programme31 districts Norway 2004–2006 —JICA —— = not available , £ = pounds sterling, NRs = Nepalese Rupees, SwF = Swiss francs , <strong>ADB</strong> = Asian Development Bank, DFID = Department for InternationalDevelopment, FWDR = Far West Development Region, JICA = Japan International Cooperation Agency, MWDR = Mid West Development Region,SDC = Swiss Develo pment CooperationSource: Data from project annual progress reports (2003); MOAC (2003)Chapter 10: Environmental Financing151
From Hands Around Everest <strong>book</strong>From Women, Energy and Water in the Himalayas - Project Learning <strong>book</strong>Finance is needed for many types of environmental interventions: bridges to link communities; hazard mitigation;water harvesting; beekeeping trainingKeshar Man Sthapit ICIMOD file photo152 Environment Assessment of Nepal : Emerging Issues and Challenges
plants. The Government provides timber to theTimber Corporation of Nepal at subsidized royaltyrates approved in 1995. A review of the royalty ratesfor licensing trade of NTFPs and medicinal andaromatic plants, making them more in-tune withcurrent market prices for these products, couldsubstantially increase the revenue collected. Areview of these legal provisions could also ensurethat tariffs were levied regularly and that the revenuecollected from them was used to directly addressdifferent environmental issues around forests. In thecase of community forests, users are obligated tospend 25% of the total income earned from the saleof forest products in the conservation andmanagement of the forests at their disposal.Power developers installing and operatingisolated micro-hydro plants and diesel plants forsupply of electricity in off-grid areas, as well ascommunity-based users’ groups operating with therural water supply schemes, decide for themselveson the structure of tariffs for the maintenance of theirschemes.The Government, through the Nepal OilCorporation, the sole importer and distributor ofpetroleum, oil, and liquefied natural gas, sets theprice of these products and provides subsidies onkerosene to consumers in village developmentcommittee and rural areas. However, in somelocations this must be rethought since higher pricesin the border towns of India have caused thissubsidized fuel to slip back across the border, whilethe Nepal Oil Corporation has been operating at aloss of about NRs 3.6 billion annually (NOC 2005). Atariff on petroleum products can be used to combatpollution, and indeed the Financial Act andRegulations do authorize the national environmentalagency to collect NRs 0.50/liter on petrol, diesel, andkerosene in Kathmandu Valley to generate funds tocombat pollution. It is estimated that about NRs 100million per year could be collected from tariffs leviedon sales of petroleum products in Kathmandu Valleyalone. The above process applied throughout theKingdom could generate as much as NRs 400 millionper year.In recent years, the Government has givenpriority to the introduction of alternative energytechnologies like improved cooking stoves, biogasdevelopment, solar photovoltaic, and developmentof micro-hydro plants in remote areas. The subsidiesamount to as much as 50–55% of the installationcosts of the systems. By 2004, about 175,000improved cooking stoves of different types, 125,000biogas plants, and 250 micro-hydro plants were inuse; while around 61,000 families were beingsupplied electricity by solar photovoltaic modules ofdifferent capacity and types (AEPC 2005). Theincreased application of these technologies isbeginning to yield visible dividends on improvingindoor pollution and ambient air pollution, and asignificant reduction in fuelwood consumption inremote areas, which has also helped to improve thehealth of the rural population 1 .BiogasBeing an agricultural country, livestock plays animportant role in the Nepalese farming system. Cowdung and other bio-products such as plants can beutilized for the production of biogas—a viablealternative source of energy. Nepal has the technicalpotential for establishing about 1.9 million biogasplants and the economic potential for about 1million. By the end of 2004, 123,395 biogas plants hadbeen established under the Biogas SupportProgramme (Table 10.7). About 97% of these biogasplants are functioning at present. The total equivalentpower output produced from biogas is 330 MW. It hasalso contributed to saving 239,386 tons/year offuelwood, 3.83 million liters/year of kerosene, and203,478 tons/year of bio-compost. The biogas sectoralso employs about 11,000 people (AEPC 2005)The Government initiated biogas developmentin the mid-1970s on the occasion of “AgricultureYear” when it started funding the development ofalternative energy; biogas, micro-hydro, solar energy,and wind energy receive subsidies under thisscheme. To promote the development and use ofbiogas, the Government provided a subsidy of NRs6,000 for plants installed in Kathmandu Valley,Hetauda municipality, Dang, and Terai districts; NRs9,000 for plants installed in hill districts; and NRs11,000 for plants installed in remote districts notaccessible by road. In addition, NRs 1,000 is providedfor plants below 6 cubic meters (m 3 ) capacity, and afurther NRs 1,000 for plants installed in lowpenetration districts. The subsidy rate for the fiscalyear (FY) 2004 ranges from NRs 5,500 to NRs 11,500(Table 10.8).Table 10.7: Phase -wise Production of Biogas in NepalSN Phases No. of Plants1 First Phase (1992 –1994) 6,8242 Second Phase (1994 –February 1997) 13,3753 Third Phase (March 1997 –June 2003) 91,1964Fourth Phase (July 2003 –December2004)12,000Total 123,395Source: AEPC (2005)1Personal communication with staff of Tribhuvan University’s Research Center for Applied Science and Technology (RECAST).Chapter 10: Environmental Financing153
Table 10.8: Subsidy Rate for Biogas PlantsRegionEighteen districts (Achham, Baglung, Baitadi,Dadeldhura, Dailekh, Dhanusha, Doti, Mahottari,Okhaldhunga, Panchthar, Parsa, Rautahat, Rolpa,Rukum, Salyan, Saptari, Siraha, and Taplejung) aredefined as low penetration districts for the FY 2006,and these districts receive an additional NRs 500subsidy per plant.ConclusionCapacity4 and 6m 3 8 and 10m 3Terai districts NRs 5,500 NRs 5,000Hill districts NRs 8,500 NRs 8,000Remote hill districts NRs 11,500 NRs 11,000m 3 = cubic metersSource: AEPC (2005)Although there are complaints of inadequate fundsfor environmental activities, this preliminary reviewshows that there is fairly substantial funding fromdifferent sources. The direct allocations from thecentral treasury to national environmentalorganizations may be relatively limited, but the totalamounts from different sources at various levelscannot be considered small. The most encouragingsources are the natural resources organizations andcommunity groups involved in natural resourcesmanagement. There are also new sources formobilizing resources such as the pollution tax onpetroleum products being used by the transportsector.At present the financial contribution of urbanareas towards resolving their environmentalproblems is quite limited. Therefore opportunities forenhancing such contributions in the future should begiven priority for a more effective management ofurban environment. This will necessitate a moreexhaustive study of possible potential environmentalfinancing in the future.BibliographyAlternative Energy Promotion <strong>Centre</strong> (AEPC). 2005. AnnualProgress Report 2004/05. Kathmandu: His Majesty’sGovernment of Nepal, Ministry of Environment,Science and Technology.Biogas Sector Partnership Nepal (BSP Nepal). 2004. BiogasNepal 2004 Report. Lalitpur.Kanel, K.R. 2004. “25 Years of Community Forestry:Contributions to Millenium Development Goals.”Proceedings of Fourth National Workshop onCommunity Forestry, August 4–6, 2004, Kathmandu.Ministry of Agriculture and Cooperatives (MOAC). 2003.Annual Progress Report 2003. Kathmandu.Ministry of Forest and Soil Conservation (MOFSC). 1993.Community Forestry Management Programs 1993.Kathmandu.———.1995. Forest Regulations 1995. Kathmandu.———.1996. Buffer Zone Management Regulations 1996.Kathmandu.———.2004. The Collaborative Forest ManagementManual 2004. Kathmandu.———.2005. Projects Index Report 1999: Projects underMOFSC. Kathmandu.Ministry of Water Resources (MOWR). 1993. The IrrigationPolicy. Kathmandu.Ministry of Science and Technology (MOST). 2001.Arrangements of Subsidies fro Development ofRenewable Energy. Kathmandu.National Agricultural Research and Development Fund(NARDF). 2004. “Project Compilation Report: BriefIntroduction and Summary of 15 Projects Funded byNARDF,” Kathmandu.National Planning Commission (NPC). 2003. PovertyAlleviation Fund Ordinance 2003. Kathmandu.Nepal Oil Corporation (NOC). 2005.Power Development Fund Board (PDFB). 2005. Guidelinesfor Availing Financing from PDF 2005. Kathmandu.United Nations Environment Programme (UNEP). 2001.Nepal: State of the Environment. Bangkok: UnitedNations Environment Programme, RegionalResource Center for the Asia Pacific.154 Environment Assessment of Nepal : Emerging Issues and Challenges
Chapter 11Environment and Conflict: AReview of Nepal’s ExperienceIntroductionHuman history is rich with examples of conflictthat have plundered the environment. Todaythe imprints of civilizations are not only thedeserts from deforestation, soil erosion, and miningbut also include sewers of rivers, eutrophied lakes,dumping sites of industrial waste and nuclearmaterials, and military test sites. Although in the pastmany quietly suffered the sad consequences of theseenvironmental atrocities, today affected parties arebeginning to raise their voices and go to court oreven take up arms and stake their claims for rightingpast wrongs. Environment-related conflict isincreasing and attracting attention as a developmentagenda item along with poverty and human rights.Research to better understand the dynamics of theenvironment-conflict relationship has increased.Some are trying to understand the linkages, whileothers are searching for ways to restore peace andcooperation.At the local level, conflicts are closely related tolack of access to critical resources. With changingprices, markets, and breakdowns in traditionalinstitutional mechanisms for mediation, conflictshave become more the rule than the exception in theuse of forest, water, pasture, and other naturalresources. While many of these local conflicts arenot violent and are resolved peacefully, in othercases disagreements and tensions are very high andviolence has erupted in some (Homer-Dixon 1999;Conca and Dableko 2002).At the national level, mainstreaming theenvironmental agenda, adoption of livelihood-basedapproaches to poverty reduction, and the movetowards greater democracy and human rights havestrengthened efforts to overcome past environmentalinjustices. Development has not only displaced manygroups of people in the past, but has also failed toprovide adequate compensation. Today there isincreasing discussion about who benefits fromdevelopment, who loses, and the transparency of theunderlying decisions. Development projects mayChapter 11: Environment and Conflict: A Review of Nepal’s Experienceincreasingly become subjects of court battles tosafeguard the traditional environmental entitlementsof people whose livelihoods have been closely linkedwith the diversity of environment (PANOS 2002).At the global level, many internationalagreements such as the Convention on InternationalTrade in Endangered Species of Wild Fauna andFlora (CITES) 1973 and the Convention on BiologicalDiversity 1992 have tried to curb trade in endangeredflora and fauna. With high stakes in someenvironmental products, conflicts are rampant inmany areas with shared ecosystems and sharedresources like water (IDRC 2005; APCSS 1999). Effortsto exploit resources have been a source of unendingconflict in some parts of the world (Ehrlich et al.2000). Problems related to the management of theglobal commons—air, climate, oceans—have alsobecome a source of continuing conflict, fortunatelynot a violent one so far.The issue of environment and conflict hasbecome serious at all levels of society. While there isgrowing recognition of the problems, ways to dealwith them are less clear and filled with controversy.This chapter will review the changing environmentconflictnexus generally and for Nepal in particular.Before discussing the Nepal scene, it is necessary tosummarize recent discussions on this topic. Thesituation in Nepal clearly indicates that conflictconditions are abundant. However, while some arequick to identify the “green roots of the red rebellion”in Nepal (Bhurtel and Ali 2003), some caution isnecessary in trying to establish a cause and effectrelationship in this complex issue.Environment, Resource Scarcity,and ConflictWebster’s Dictionary defines “environment” as “thetotality of the physical conditions of the earth or partof it, especially as affected by human activity”. Itincludes all ecosystems. “Ecosystems” are defined as“a dynamic complex of plants, animals, and155
microorganism communities and the non-livingenvironment interacting as a functional unit” (MEA2003). Humans are an integral part of mostecosystems. Whenever changing socioeconomicconditions affect the continued access or use ofecosystems by some groups relative to others, thereis the potential for conflict if the problems that ensueare not resolved in a satisfactory manner. Everysociety must have institutional mechanisms to dealwith changes, or unresolved problems can easilyturn into serious conflicts; and the mechanisms mustbe maintained as solving one problem does notmean that new ones will not emerge.Renewable and Nonrenewable ResourcesSome authors consider that only exploitation ofrenewable resources should be considered in thecase of an environmental conflict (Libiszewski 1995).Renewable resources are important because theyare linked to life-supporting processes. Exploitingnon renewable resources such as minerals depletesbut does not necessarily degrade the environment,but the potential for environmental damage iscertainly high. The violent movement to secedeBougainville island from Papua New Guinea beganover environmental concerns at a large copper mine(MEG 1996).Resource ScarcityFour types of resource scarcity have been identified(Libiszewski 1995). Physical scarcity is the mostcommonly experienced type; because of the limitednature of a physical material, its increasing useincreases its relative scarcity. There tends to beintense struggle for control of all valuable resources,which can lead to conflict if negotiations fail.Notions of physical limitations with respect tomost resources, however, are relative. While someresources such as sunlight and ecosystem processesthat support life cannot be substituted, based uponour present knowledge and capacity, and thereforemust be taken as finite, other natural resources havebeen substituted for over time. Substitutability is animportant dimension in the discussion of the scarcityof natural resources (Swanson 1996).The next type of scarcity arises from prevailingsocioeconomic conditions. It is referred to asdistributional scarcity. Societies have distributednatural resources (such as land) in different ways,and some distributions are more equal than others.Where there is inequality in distribution, somegroups face scarcity and have limited access andownership of natural resources such as land, forest,and water.Geopolitical scarcity is another dimension.Some countries have plenty of some resources whileothers may lack them. The concept of “resource” isan economic one. There was a period when crudeoil was seen as a nuisance because the knowledgeand the technology to use it were lacking (Swanson1996). Trade has alleviated scarcity of a resource inany one place. However, genuine instances ofscarcity in particular countries need to berecognized.The fourth type of scarcity is environmentalscarcity. This is related to the environmentaldegradation that may take place. A resource thatused to be plentiful is no longer so because ofchanging environmental conditions brought about byimproper management of natural resources, overharvesting,or institutional failure. For example, freshwater that used to be abundantly available in urbanareas is becoming increasingly scarce because ofpollution, poor management, and waste.According to Libiszewski (1995) anenvironmental conflict is one caused byenvironmental scarcity, because of its roots in theenvironmental problem. Other types of scarcitieshave their roots in socioeconomic and politicalissues and not in environmental ones.In real life it becomes very difficult to isolateenvironmentally rooted problems. Most problemsare dynamic and quickly impact other areas.Shortages of diesel fuel generate shortages in otherareas. Even if we agree that environmental conflict isrooted only in environmental scarcity, the solutionsmust often be found in other sectors and resources.We cannot avoid examining the entire spectrum ofinterrelated factors and processes.Different Types of ConflictsAs is evident from the above discussion, there maybe some debate about what constitutes anenvironmental conflict as opposed to a civil strife.Conflicts are also of differing degrees. Some are veryviolent while others are almost routinedisagreements related to day-to-day activities incommunities. For the purpose of this discussion,conflict is interpreted in a very broad sense as anystate of opposition or hostilities between parties oversome aspect of the environment. In its broadestsense it is possible to distinguish a number ofpossibilities.Conflict over environmental resources isprobably the most common type of conflict today atthe local, national, and regional levels. All conflictsbetween different parties regarding the use andownership of land, water, minerals, and such likebelong to this category.The next type of environmental conflict isdifferences over understanding the problem and themeasures to cope with it. An example of this would156 Environment Assessment of Nepal : Emerging Issues and Challenges
e the differences in countries’ positions regardingglobal warming.The third type of conflict may occur when civilstrife impacts environmental resources. Conflictingparties may initiate deforestation for their ownreasons, or may want to control the use of certainenvironmental resources.Theories Behind EnvironmentalConflictThe world is experiencing changes in the prices ofgoods and services, technology, socioeconomicconditions, demand, and regional and internationaltrade. Accordingly, the concept of “scarcity” cannotbe viewed as an absolute. Economies are increasinglymoving towards specialization in their areas ofrelative advantage, hoping to overcome the scarcityof any particular resource through internationaltrade. Given this trend, how can we explain thescenario of increasing environmental conflict overnatural resources? It is useful to review some of thetheories that explain environmental conflict.Pressures Related to Population GrowthRapid population growth has long been consideredone of the most important factors behinddeteriorating environments and ensuing conflicts.The world population is expected to stabilize around2050 at approximately 8.9 billion; much of theincrease will continue to be among the lessdeveloped countries where people depend onsubsistence agriculture and the use of naturalresources for their livelihoods (UN 2003). The use ofmarginal lands for agriculture, increasing soilerosion, deforestation, overgrazing, declining soilfertility, and decrease in land productivity are someof the major issues that derive from rapid populationgrowth. The sheer increase in population is likely tooutstrip available food supply and the capacity ofnatural systems to support human needs (Ehrlich etal. 1997)—a strong basis for much of the conflict.However, some consider that human populationgrowth made a turning point around 1962/63 whengrowth peaked at 2.2% per annum (UN 2003). Sincethen growth has continued to fall, and in 2001 it wasonly 1.2%. If this trend continues, human populationwill stabilize sooner than expected. However, thisdoes not mean that all environmental pressures andconflict will disappear; if population is one factorbehind increasing use of and competition for naturalresources, the other is increasing demand throughover consumption, including unequal distributionand access to resources.Neo-Malthusian notions of scarcity maintain thatpopulation pressure is behind the growing scarcity ofnatural resources (Gleditsch 2004). High levels ofconsumption have led to overexploitation anddepletion of resources, increasing competition forscarce resources, and eventually leading to conflictand at times even violent conflict. Thomas F. Homer-Dixon (1999), a prominent advocate of this positionand one of the better-known figures in the analysis ofenvironment and conflict, maintains thatenvironmental scarcity is likely to promote internalconflict. Related to rapid population growth, there isalso a youth bulge in some societies. As there are fewoutlets for the productive engagement of youth, theybecome vulnerable to depressing economicconditions and easier to recruit for violent activitiesthan other age groups.South Asian countries with large and poorpopulations impose a substantial demand on water,arable land, forests, and other resources. Alreadyproblems such as deforestation, soil erosion, andscarcity of fresh water are widespread and the areais being seen as a region of high environmentalinstability (Swain 2002).Policies, Markets, and InstitutionalFailuresExplanations about resource-related conflicts havefocused on the issue of common property resources.Where institutional mechanisms for managing theresource are weak, such as the absence of welldefinedproperty rights, it is inevitable that the“tragedy of the commons” will occur (Hardin 1968).Put simply, the tragedy of the commons statesthat when all members of a group have equal andunlimited access to a resource held in common, thatresource will inevitably be depleted. However,instances of collectively well-managed naturalresources do exist; adherence to principles of equityand institutional variables have been important insuch cases (Jodha 1986; Ostrom 2000). Economistshave attributed the tragedy of the commons to afailure of markets—the price mechanism fails tosignal the relative scarcity of a resource—and to thefailure of institutional mechanisms (Mason 1996). Ifthe price mechanism always worked, overexploitedresources held in common would provide incentivesfor better management because of the increase inthe value of these resources. This would be theopposite of conflict, but this does not occur becauseinstitutions are not able to function quickly inresponse to complex situations. Solutions are noteasily apparent, or involve a price that somemembers of society may be unwilling to pay. Theremay be problems of high transaction costs. Certainpolicies may now favor some groups throughChapter 11: Environment and Conflict: A Review of Nepal’s Experience157
subsidies (Mason 1996). All these are differentaspects of institutional failures which if not resolvedin a timely fashion, can lead to conflicts overresources.Human activities tend not to take into accountthe true costs to the environment. This may be due togovernment subsidies, lack of knowledge of impacts(especially if these are ex situ), the absence of lawsand regulations to control environmental damage,undefined access rights to natural resources, conflictsituations where both parties do not observeenvironmental safeguards, poorly developedmarkets for environmental goods and services, and alopsided development that forces large numbers ofpeople to depend on limited natural resources fortheir livelihood. Market failure occurs whenresources are not used efficiently based upon marketsignals or because of externalities (Mason andSwanson 1996). In many instances, markets areunable to put a price on outputs or the impacts ofactivities. This situation pertains to manyenvironmental problems such as disposal of waste inwater bodies, dumping toxic substances, or pollutingthe atmosphere. This happens either becausepolluters think they can get away with it, or the costsof proper disposal are too high. The social costs inthis case can be much higher than the costs to aprivate producer.Solutions to the problem lie in making the pricesignal work more effectively by taxing the producerfor the pollution. Permits provide permissible quotasof pollution beyond which fines can be imposed. Insome cases, when pollution levels are lower than thepermitted levels, the industry can also sell part of apermit to another polluter (EPA 2005).Examples of policy distortions include subsidiesand protections given to certain industries thatdamage the environment. Many public sectorindustries with high degrees of pollution continue tooperate only because of the huge subsidy andprotection provided by governments (UNEP 2002).Other distortions arise because of the hugeadministrative and transaction costs involved ingetting government approvals, licenses, export andimport permits, and so on.Conflicts here may be more implicit thanexplicit. But as societies realize the long-termconsequences of environmental damage, affectedgroups are playing a bigger and bigger role.Other Theories Regarding EnvironmentalConflictAnother explanation holds that the inequities of theworld’s economic systems and the process ofglobalization are responsible for the increasingnumber of violent environmental conflicts (Matthewet al. 2004). The world’s trade system has alwaysbeen biased against natural resources export fromthe developing countries (Khor 1996). Timberexports have uprooted many indigenouscommunities from their traditional homes anddamaged their livelihoods. Many have had to fightagainst these companies.Having plentiful resources is a curse for somecountries as it provides a favorable base forenvironmental conflicts (Gleditsch 2004). Whereresources are abundant, there is a tendency tomisuse them. Slow economic growth despiteplentiful resources, skewed distribution ofdevelopment benefits, and weak institutions providea set of factors that encourages political instabilityand armed conflict for control over resources. Thesehave also been referred to as the “greed andgrievance” theories (Gleditsch 2004). The motivationfor conflict in the grievance theory is the opportunityto right past wrongs, while in the greed theory themotivation is for seizing the resource through violentmeans. It is also necessary to distinguish differenttypes of natural resources. The more valuable theresource, the more likely that it could become asource of conflict.Efforts are being made to examine ways toresolve conflicts through promoting cooperation andpeace building (Dabelko and Carius 2004; Conca andDabelko 2002). There is little value in explainingconflicts if those explanations do not identify or leadto a peaceful resolution of the problem. So far mostconflicts have affected rural areas, but there may alsobe conflicts that affect urban areas in the future,especially with the growing scarcity of fresh waterand clean air (Matthew et al. 2004). Conflicts neednot always be negative. They may provide valuableexperience for innovative solutions to naturalresources management.As increasing competition for valuableenvironmental resources becomes the cause ofconflict at a larger scale than at present, there isgrowing interest in “ecological security” (Conca andDabelko 2002). Increasingly, developed countries arecarefully tracking the availability of critical naturalresources, assessing the chances for eco-violence,and urging their governments to develop ecologicalsecurity guidelines and policies. Developingcountries, on the other hand, see this as anotherhurdle being put before them by the developedcountries in their efforts to promote sustainabledevelopment. Any limitations on harnessingavailable environmental resources could jeopardizetheir prospects for improving the wellbeing of theirpeople (Conca and Dabelko 2002).158 Environment Assessment of Nepal : Emerging Issues and Challenges
Environmental Conflict in Nepal:The Overall ContextJudging from the paucity of published materials, it isclear that Nepalese scholars have not given muchattention to the issue of environmental conflict.Attention to environmental conflict has been mainlylimited to the conflict between people and protectedareas, but recently some concerns have been raisedabout the impact of political conflict on theenvironment. The issue that has attracted the mostattention is the poaching of endangered wildlife andtrade in endangered wildlife species banned byvarious international agreements (AmericanEmbassy 2005; Hakahaki 2060 [2003 ]; Murphy et al.2004).The complex interrelationship betweenenvironment and conflict makes it difficult to bringtogether relevant facts, and the scope of the presentexercise does not give the flexibility or the time todeeply analyze these critical multidimensionalaspects of environment and conflict. In manyrespects, conflicts indicate that existing socialrelationships are beginning to change (Banskota andChalise 2000; Pradhan et al. 2000). For an agrarianeconomy like Nepal, environmental relationshipsmay be at the root of changing social, economic, andpolitical interactions (Bhurtel and Ali 2003). Someforces may be on their way out, some may still beemerging, while others might have clearlyestablished their foothold until new pressures begindemanding further changes.The available evidence has been broughttogether in the following to describe the differentdimensions of environment and conflict in Nepal,bearing in mind its limitations.Nepal is and has been an agrarian economywith over 80% of the people still dependent onagriculture for their livelihood. Given thatlandholdings in Nepal have been distributed veryinequitably (Yadav 1999; Aryal and Awasthi 2003),there is a huge land hunger in the country. The poorare squeezed onto small and marginal landholdingsof less than one hectare that can barely support afamily’s needs for a few months of the year. There isintense and widespread competition for availablenatural resources, leading to conflicts for space,ownership, and control. The average size oflandholdings has decreased despite bringing largetracts of forest land under cultivation. The skewedland distribution system has remained virtually intactdespite numerous policies to bring about landreform. Acute problems of insecure tenancy haveresulted in conversion of large numbers of tenantfarmers into wage laborers. The large increases ofinstitutional credit to the agricultural sector have nothelped the poor who are still unable to access it(Bhattarai and Pradhan 2004). All these factors havecontributed to increasing pressure and conflictsregarding all the important natural resources ofNepal.The rapidly increasing population has played animportant role in this scenario because developmentefforts have not succeeded in diversifying theeconomic base of the country to the extentnecessary for its rising population. Nepal’sgeography, with its very distinct ecological belts andthe fragility of the Hill and Mountain areas, has alsocontributed to the increase in competition andconflicts. Prior to the eradication of malaria, whichwas endemic to large parts of the plains, thelowlands of Nepal were sparsely populated. Most ofthe population lived in the climatically morefavorable and less disease-ridden Hills, where manystruggled to eke out a survival often supplementedby seasonal migration to India. Malaria eradicationduring the 1950s opened the flood gates to migrationfrom the Hills to the Terai, giving many an opportunityfor a better life. However, for some it was anunending set of problems—sometimes with theGovernment and at other times with other migrantsfrom the Hills and neighboring parts of India (Panday1985).This opening of the Terai plains after malariaeradication was a politically unstable period.Frequently changing governments, each wanting totake maximum advantage of the opportunity of newland available in the Terai, established commissionafter commission to look into the problems of landdistribution and settlement. Groups of illegal settlers,landless groups, insecure tenants, and interestinglyenough “political sufferers” actively pressed theirclaims to land ownership. Depending on who was inpower, decisions favored one group and angeredothers, resulting in many demonstrations andclashes, some of which were violent (Ghimere1992). A major land reform launched in 1964 had afew notable aspects, but many later reviews (IDS1985; SEEPORT 2000) were quite critical of itsapproach. Land reform is still a hot issue and animportant agenda item of all political parties, but asin the past, despite strong rhetoric, actualachievement has been minimal.The latest case is that of the Kamaiyas orbonded laborers in southern parts of far westernNepal. In July 2000, the Government declared theKamaiya system illegal and freed the laborers of theTharus living in the Terai and inner Terai districts offar western Nepal (Global IDP 2004), an area that hadbeen the scene of many forest and settlement relatedconflicts in the past. Freeing them, however,Chapter 11: Environment and Conflict: A Review of Nepal’s Experience159
addressed only part of the problem. Feeding,housing, providing new land for settlement, access tocredit, and other inputs to begin their farming hadnot been given adequate attention. What has beenoffered in compensation has been woefullyinadequate to resolve the day-to-day plight of thesepeople. “The Kamaiyas have since grabbed morethat 10,000 acres of government forest land againstthe state’s failure to rehabilitate them, more than fouryears after their release” (Global IDP 2004). Delays inproviding land were caused by a conflict betweenthe Ministry of Forest and Soil Conservation and theMinistry of Land Reform (Global IDP 2004). Initiallythere was no plan to allocate any forest area to them,but now this appears to be unavoidable.One estimate (IDS 1985) puts the number oflandless families in Nepal at one million, with most ofthese belonging to low caste and indigenous groupsin the Terai, displaced people from the Hills, andeven some labor migrants from India.In terms of property rights and entitlements toproductive assets and natural resources, thefarmers of Nepal have limited access to suchresources. Land and land based resourceshave served as the principal source ofeconomic surplus generated by the rulingclass. Concentration of land, and exploitationof the peasantry through excessiveexpropriation of labor and land revenue hasincreased the wretched condition ofpeasantry. (SEEPORT 2000)Unless these problems are addressedcomprehensively, green conflict in the form of landgrabbing, illegal settlers, eviction of peopleoccupying forest areas, and issues of resettlementand displacement could easily become aninseparable part of the violent movement going on inthe country.Forest Resources and ConflictsForests cover over 30% of the country. Includingshrub area, the share of forest goes up even more.Forests provide about 14% of the gross domesticproduct (GDP), 80% of the fuel, and 50% of livestockfodder (Uprety 2003). In the agrarian economy ofNepal, forests play an enormously important role. Asforests of the Hills have been intensively used andare now more carefully managed, the attention forthe past five decades has been on the forests of theTerai plains for settlement, agriculture, timberextraction, infrastructure development,establishment of protected areas, and many otherpurposes.Nepal’s community- and state-based forestmanagement practices have been protectionoriented. Managing a finite resource in the face ofrapidly increasing demand will not be easy, and therewill be gainers and losers. Where there are fewlosers their voices will be subdued, but once thenumber begins to increase, the flags of conflict willbegin to wave far and wide. It has been argued(Grosen 2000) that if forest management movedtowards an active production orientation, the currentcontribution of $58 per hectare could go up to $162per hectare. With increased productivity, the forestsector could play a major role in poverty reductionand in dealing with the problems of illegal settlers,landless groups, and others by providingemployment opportunities. On the other hand, ifforests are managed as they are now, with lowproductivity and a protection orientation, they couldbecome an even greater source of conflict in thefuture.Illegal Settlements in Forest AreasMany of the problems of the agricultural sector aretransferred to forest resources. People’s hunger forland during the past five decades has been metlargely by bringing more forest area of the Teraiunder cultivation (IDS 1985). Many of the ongoingconflicts regarding tenants, landless groups, andillegal settlers have occurred in occupied forest areas(Ghimere 1992). Many of the new settlements in theTerai have also come from cleared forest areas.Ghimere (1992) discusses the experience ofNawalparasi district, pointing out that given the highdemand for land and the relatively low cost ofresettlement, the Terai provided an excellent optionfor people in the Hills as well as those across theborder in India.Many Nepalese from Assam and Myanmar wereencouraged to return and settle in this area (Ghimere1992). On the other hand many of the earlierresidents were dispossessed of their lands throughvery unpleasant means, and illegal settlements wereofficially encouraged although the landless peoplewere never a target for settlement.The resulting chaos in land ownership, dealtwith only cosmetically by numerous commissionsset up to look into problems, has been the basis oflongstanding tension between landowners andlandless groups, richer landowners and marginal andsmall farmers, and local groups and immigrants(Ghimere 1992). Although these issues appear inmany Terai districts, they are most prominent in thewest, the far west, and around protected areas of thecountry.Forest and Other LegislationMany contradictions between forest and otherlegislation are sources of problems and confusion.160 Environment Assessment of Nepal : Emerging Issues and Challenges
Some of these have remained unresolved fordecades (Grosen 2000), which only shows the extentto which governments have been unconcernedabout removing conflicts. Research should clarifywho benefits from these legal contradictions andtheir impact. There has been a rush to pass newlaws, but few efforts to ensure that new laws do notconflict with earlier ones. Based on the manycontinuing contradictions, it is obvious that a newcommission is urgently needed to look into this veryserious matter.Some of the more obvious conflicts related tothe use of forest resources are listed below (Grosen2000):(i) There are differences in the amount of landthat can be owned under the Forest Act andthe Land Act. It would be interesting to seehow many cases have been recordedbecause of these conflicting provisions.(ii) The absence of a cadastral survey in manyareas has made it very difficult to separateprivate and government land, and thus madeit very difficult to identify encroached lands.Similar confusion has been noted amongcommunity forest groups.(iii) Provisions under the Forest Act and theNepal Mines Act overlap. The Forest Actmaintains that anything in a forest isgoverned by the Forest Act while the MinesAct maintains that all minerals are governedby the Mines Act.(iv) Provisions have been made forcompensating landowners when property isacquired for development schemes, but asland demarcation is not clear compensationhas often remained pending for a very longtime.(v) Similarly, many overlapping provisions havebeen found between the Forest Acts and theLocal Self Governance Act, which has greatlyhampered decentralization. The centralagencies responsible for the different Actshave not removed provisions regarding localresources, creating overlapping jurisdictionand confusion for the public.Problems in Community ForestryAlthough community forestry has been a successfulmodel for community-based management of forestresources in the Hills, it has not been completely freeof problems. While it was a very innovative approachfor rescuing parts of the hill forests from furtherdegradation, which accelerated after theGovernment took over all the forests in the country,over time new challenges and difficulties have beenidentified (Britt 2002).Problems within forest user groupsFormation of forest user groups has been animportant feature of the community forestryprogram. There has been an increasing tendency toform groups without adequate homework regardinggroup harmony based on traditional interactionswithin the community. Exclusion of communitymembers who belong to low caste anddisadvantaged groups, as well as those who may bepart-time users, is leading to tension in forest usergroups. Rules regarding sharing of benefits and costshave always been a major source of tension.Questions of personality clashes, differencesbetween active and inactive members, and fundmisuse and embezzlement are other problems notedin hastily formed user groups (Bhatia 1995; Springate-Baginski et al. 2003).Problems between user groupsOne of the most common problems between usergroups has been confusion with respect to the forestarea. Without clearly identifiable boundaries, there isoverlapping jurisdiction, and without good basesurvey maps the problems are arbitrarily put on holdto resurface again. Because of the lack of good maps,there have been instances of mistaken handover offorests that are temporarily resolved after intensenegotiations involving cumbersome administrativeand legal processes (Bhatia 1995; Springate-Baginskiet al. 2003).Problems Between Forest User Groups and theForest OfficeThe Forest Office has many discretionary powers,and without its active support, approval for acommunity forest group may never come. Manyrequirements need to be fulfilled before the ForestOffice can provide approval, and each of theserequirements can be a source of difficulties for theuser groups. Over time a lot of experience has beengained by user groups, but if the Forest Officeimposes difficulties, this experience may not beuseful. Traditional mechanisms for resolving localconflicts have weakened for a number of reasons.Having access to the Government and getting timelydecisions can be very difficult and costly for weakergroups without the right political linkages. A study ofland disputes (New Era 1989) showed that tenantshad to pay substantially more court expenses thanlandlords, and also encountered more delays.Community Forestry in the TeraiAttempts have been made to introduce communityforestry in the Terai, which unlike the Hills has noChapter 11: Environment and Conflict: A Review of Nepal’s Experience161
historical practice of community-managed forestresources. The objective of introducing this practicewas to prevent further degradation of forests and toimprove the quality of existing forests for the benefitof the local community. However, the experience sofar has not been very encouraging. The Governmentmaintains that the Terai lacks the ecological andsocial conditions needed to make communityforestry work, while others argue that thegovernment programs did not do enough to provideownership and local institutional development, andfailed to target those who would have benefited (Britt2002). Community management of Terai forestsPoaching of Endangered Species and Overharvestingare a Major Source of Local ConflictIUCN IUCN C. Richardfaces an uncertain future with significant difficultiesfor local communities to legally use forest resourcesin their areas.Customary Practices and Forest ActsWith the implementation of national Forest Acts, thefate of all customary practices is open to question. Insome cases (Pant 2002), respect for customary rightswas negotiated as part of a package recognizing theauthority of the rulers in Kathmandu. However, thecontext has changed to such an extent that thecurrent position of many customary rights is notclear. In some instances local communities stillassert that their customary privileges are valid but theGovernment has a different understanding (Pant2002). Some traditional practices are importantbecause of the size of the group and area involved.The most obvious case is the traditional kippatsystem of land holding among the Rai and Limbucommunity in the far eastern Hill and Mountainareas. It is a system of communal land managementwhere the community members have the usufructright to use the pasture but no powers to sell it. Thisright was recognized by the Government in return fortheir submission to the authority in Kathmandu (Pant2002). However, while the people have acceptedcommunity forestry, they are not abiding by its rules.Under community forestry rules, there arerestrictions on non-forest uses of the communityforest land, especially for cultivation of new crops,although this is also a subject of discussion. Theforest areas are now being used for cultivation ofcardamom. When locals are questioned theymaintain that their kipat heritage gives them thefreedom to use the forest in any way they decide, butthe Government understands the situationdifferently. The existence of this dual system hasperpetuated tensions and severely limited theopportunities for further development of forestresources (Uprety 2003).Traditional practices of indigenous groups havebeen replaced by state laws. Sometimes thesechanges take a very heavy toll on the livelihood of theindigenous groups because the new laws haveopened access to outside groups. The resourcestraditionally enjoyed by indigenous groups are thenquickly depleted or controlled by more powerfuloutside groups. The plight of the Rautes—one of thelast remaining groups of forest dwellers of Nepal—isa sad example. These people roamed the jungles insearch of food, hunting and collecting edibleproducts, and making wooden products which theyexchanged for food grain in the villages. Today theforest they used cannot provide for their needs andthey are often hungry—some children have died ofstarvation (The Rising Nepal 2004). In the case of162 Environment Assessment of Nepal : Emerging Issues and Challenges
Factors that Could Reduce Local Conflicts in Natural Resources UseCommunity ParticipationHarnessing Indigenous KnowledgeMobilizing Community ParticipationWorking TogetherIUCNanother semi forest-dwelling group near the capital,the story is a little more positive. Leasehold forestryhas successfully restored over 7,000 hectares (ha) ofdegraded patches of land, and 1,600 leaseholdforestry groups are nurturing forests on otherwisehopeless slopes and ravines. The livelihoods of thepoor have improved, and empowerment of womenhas advanced (IFAD 2004).Conflicts in Parks and Protected AreasNepal has had a long and successful history ofestablishing protected areas. The Royal ChitwanNational Park was established in 1973 and the latestprotected area—a buffer zone, for SagarmathaNational Park—was approved in 2002. Both arerecognized as World Heritage Sites. To date Nepalhas nine National Parks, three wildlife reserves, onehunting reserve, three conservation areas, and sixbuffer zones. A total of 26,970 km 2 (<strong>18</strong>% of thecountry) has been set aside, of which 38% is nationalparks, 4% wildlife reserves, 5% hunting reserve, 43%conservation area, and 10% buffer zone. Threewetland sites have also been recognized recently asRamsar sites—Beeshayar and associated lakes,Ghodaghodi lake, and Jagadishpur Reservoir—inaddition to Koshi Tappu. Protected areas contain atChapter 11: Environment and Conflict: A Review of Nepal’s Experienceleast 80 of the country’s 1<strong>18</strong> ecosystems, which helpspreserve Nepal’s biodiversity (CBS 2004). However,so far no comprehensive study has been carried outof the actual flora and fauna contained within theseprotected areas.Shrestha (2001) points out that the Governmenthas followed a number of distinct phases in themanagement of parks and protected areas. Duringthe 1970s and 1980s the policy was to exclude peoplefrom these areas. In the 1980s, conservation areas forecotourism were promoted. During the 1990s thefocus shifted to resolving park-people conflictsthrough buffer zones and other programs to betterintegrate people in the conservation and sharing ofbenefits of protected areas.Nepal and Weber (1993) have identified anumber of major conflicts between parks andpeople. These include illegal extraction of parkresources such as firewood, fodder, timber, livestockgrazing, hunting and fishing; frequent crop raids bywild ungulates; and loss of human life and property.In the early years, the problems were few andinfrequent. However, with rapid increases inpopulation and settlements around protected areas,the conflicts have increased in number andseverity—at times entire villages have had to be163
moved or relocated. The fact that since 1996 bufferzones have been declared around six of the nationalparks is an important indicator of the extent of thisconflict and the Government’s response to theproblem. However, many problems still remain. Theopen boundaries of parks have facilitated the entry ofdomestic animals into the National Parks in theabsence of alternative sites for grazing. Wild animalsin turn are attracted by the domestic livestock. Thedesperate situation of people around the park isindicated by one of the comments of the residentnear a park: “Unless a suitable solution is made, wewill continue our illegal activities regardless of theprice or penalty we will have to pay” (Nepal andWeber 1993). A similar finding is made by anotherreview (IUCN Nepal 2004) which points out thatwildlife reserve-people conflicts are serious becausepeople lack viable alternative livelihoods tocompensate for the loss of access to naturalresources inside the reserve, and the customaryrights of the people have been ignored.Because the bigger animals such as elephantsand rhinos raid crops, and others such as tigers killlivestock, locals are only too eager to get rid of theseanimals, which often become easy prey to poacherswho need local support. Elephants, although few innumber in Nepal, have become a regular menaceand a permanent source of tension in the easternplains.The true outcome will not be determined forsometime, though if the current trendcontinues, it seems most plausible that theelephant population will continue to diminishand the conflict will be resolved by itsdestruction (Bosley et al. 2000). With the breakin the ecosystems, mega fauna that needlarger spaces and have seasonal movementsare coming into increasing contacts andconflicts with human settlements. (WWF2003)Conflicts in Trade in Non-timber ForestProducts, Medicinal and Aromatic Plants, andWildlife ProductsNepal is home to many non-timber forest products,medicinal and aromatic plants, and wildlife speciesbecause of its rich biodiversity. NTFP and medicinaland aromatic plants products have been harvestedsince time immemorial and are important in manylocal rituals and healing practices. Traditionally,many of these have also been exported to India.Trade in wildlife products is more recent andbecause of its more lucrative markets is also moreprone to violent conflicts. Trade in all of theseproducts was generally free until recently. Some havebeen brought under government control to conservebiodiversity, others have been regulated because ofrevenue considerations, and still others like wildlifeproducts have been controlled because of bansimposed by international conventions on trade inendangered fauna. This control has createdproblems for people who have been dependent onharvesting these products for their livelihoods. Thereis confusion in policy regarding different aspectssuch as royalty payments for non-timber forestproducts, and medicinal and aromatic plants that arenot cultivated (Tiwari et al. 2003).There is no mechanism in place to certify origin,and in its absence, royalties are imposed on allproducts without a careful study of the differentmargins. This has made it very unattractive for thecollector. In trying to avoid royalty payments, largeparts of the trade have moved underground, resultingin constant tension in areas where these productsare collected.Trade in several wildlife products is completelyillegal, but because of the huge premiums for someof the products this has not only increased the risksfor some endangered animals but also for the peoplewho live around the areas where these animals arefound. Poaching around national parks is a full-timebut risky activity for some people (Nepal and Weber1993).Nepal has also been identified as a safe passagefor trade in wildlife products (Asia Rain ForestConservation News and Information 2000). Whileauthorities are making regular seizures ofendangered wildlife parts (World EnvironmentalJournalist Egroup 2002), there is increasing dangerthat this lucrative trade can get out of hand withheightened insecurity all over the country. Even if thelocal people are not involved, its escalation couldalso affect them.Water Resources and ConflictNepal has so far been seen as a country withabundant water resources, at least in terms ofendowments. However, as the country harnessesmore water resources, many different water-relatedconflicts are becoming evident. Irrigation areaincreased from 729,886 ha in 1994/95 to 943,860 ha in2001/02 (CBS 2004). Public water supply fromdifferent sources increased from 62.2 million litersper day in 1994/95 to 228 million liters in 2001/02(CBS 2004). This increasing demand and supply hasnot been smooth. Conflicts have been identified atthe local level regarding water rights and sharing ofwater between different user groups. In urban areas,scarcity of water, water pollution, and rural-urbanwater linkages are sources of conflict. At the nationallevel, mega water projects have created much164 Environment Assessment of Nepal : Emerging Issues and Challenges
tension and conflict (Dixit 1994). Although India andNepal share many common river basins, they havenot succeeded in developing a mutually agreeablebasis for harnessing water resources. Some of theseaspects are discussed below.Rural Water IssuesWater rights in rural areas have closely followed landrights (Banskota and Chalise 2000; Pradhan et al.2000). The distribution of water rights is almost amirror image of the prevailing skewed distribution oflandholdings. Within the landholding groups,however, water rights are not static and are changingdue to various circumstances. Changes inlandholdings, particularly their fragmentation, haveincreased complexities of water distribution.Similarly, one-crop systems are moving quickly tomultiple-cropping systems that produce cropsthroughout the year, increasing water demand andplacing maximum strains on limited supply, weakdelivery channels, and informal managementstructures. In many instances disputes may remainlargely implicit and dormant (Pradhan et al. 2000).Conflicts among different groups are also quitecommon. Religious laws with their implied rules ofcleanliness and untouchability regarding water, andresulting exclusion, have created much difficulty forlower caste people and untouchable groups(Pradhan et al. 2000). Differences over water use,regulation, its transport, and related activities are notuncommon between landed and landless, betweenrich and poor farmers, between upstream anddownstream farmers, and sometimes also betweenthe community and the state. Although local wateruser groups have been an important innovation formanaging local water resources, they are not free ofconflicts. There are important questions of equitybetween members who have different status andresources. While benefits from the use of water areproportional to landholdings, cost and othercontributions are generally equal among members.Even when smaller holders object to this, thesesystems are not easily altered (Matrin and Yoder1987). Another aspect of the conflict is betweendifferent water user groups when they share thesame source (Pradhan 1990). During peak demandfor water, there are inevitable tensions as supply isnever adequate. Other sources of tension arechanges in cropping patterns and cropping intensity.Political groups have always been very willing toemphasize water issues during elections.Historically, water rights have rested with thecommunity and local sharing rules, and have beenmodified by the community over time as a responseto changing circumstances. The Water Resources Actof 1992, however, changes this by asserting that allwater resources belong to the state. Pradhan et al.(2000) argue that this is the opposite of what hashappened in land rights, which over time havemoved from the state to the individual. This legalassertion of state ownership is very significant in thecontext of agreements with the private sectorregarding investment in water resourcedevelopment.Urban Water ProblemsA number of water-related conflicts have begun toemerge in the urban areas of Nepal. There are anumber of acute problems relating to adequate andsafe supply of water, pollution of existing waterbodies, and finding ways to augment presentsupplies. Kathmandu’s experience has been verymixed, and satisfactory solutions are still not in sight(MOPE 2000). The conflict here is more implicit—between rich and poor, present and futuregenerations, urban and rural residents. Richer urbanresidents may be able to pay a higher price for waterbut may also succeed in making the nation pay forvery costly projects.First is the problem of adequate and safe supply.Although public supply is unable to meet rapidlyescalating demands, some continue to access thehighly subsidized public supply while others mustpay to buy water from private agencies. Publicdrinking water supply has become so unreliable inboth quantity and quality that many households haveto purchase bottled water (whose quality is alsooften questioned) for drinking. Rural water sourcesare being leased to private companies who then sellthe water in tankers. What conditions have beenmaintained for harvesting these water sources is notclear. In most cases, protection of water sources andpriority access to local people have not even figuredin the calculation except for payment of royalties. Forall practical purposes, these public resources arebeing privatized. A highly unsatisfactory situationwith respect to the urban water issue is becomingincreasingly obvious. In the past the focus has onlybeen on developing big projects like Melamchiwithout looking at all the numerous decentralizedwatershed-based water sources that are beingexploited by the private sector.The second major problem is the pollution ofexisting water bodies in urban areas. The historicponds found in many parts of the older towns ofKathmandu Valley have become disgusting eyesoresof the urban landscape. Most of the public stonewaterspouts—very important traditional watersources—are either completely dry or bring watermixed with sewage (Paudel 1996). A significantaspect of water pollution has been the worseningconditions of the Bagmati River, which runs throughChapter 11: Environment and Conflict: A Review of Nepal’s Experience165
Kathmandu Valley and receives a large part of thewaste from the two cities of Patan and Kathmandu,as discussed in Chapter 8 of this volume.Paudel (1996) points out that the decline in riverquality has resulted in increasing incidents ofdiarrhea, typhoid, jaundice, cholera, and skindiseases among users, who have few alternatives.Livestock is also affected, but the most serious effecthas been the loss of almost all the aquatic life of theriver.The Melamchi Project has been undertaken tomeet the long-term needs of Kathmandu Valley. Theproject has been under construction for the past fewyears and is already embroiled in many conflicts(Siwakoti-Chinton 2003). Local people complain thatthe project has adversely affected many areas oflivelihood and food security. It does not address thedry-season water needs of the people, and there areoutstanding issues of compensation andresettlement.Groundwater mining has been an importantsource of supply in Kathmandu Valley and otherurban areas in the plains. The long-term implicationsof pumping excessive groundwater in the Valley havenot been studied. Harvesting this resource requiressubstantial investment, and clearly the poor cannotafford it. With decreasing levels of groundwater, thecost of accessing it has also increased. At differentplaces it is rich in mineral contents that may beharmful to health. Using it with poor treatment is ahealth hazard for many. The fact that it is not properlyregulated or its exploitation properly guided is amajor gap that needs to be corrected before aserious problem occurs (Pradhan 1999; CBS 2004).National Debate on Water ProjectsWater projects used to be considered simple andstraightforward engineering decisions. Today waterprojects are being screened carefully for theireconomic, social, and environmental effects. Eventhose affected people who had been silentspectators in the past are taking leading roles inasserting their rights in project decision making andmanagement, advocating for adequate compensationif affected adversely (Chintan undated).Nepal is a country with substantial waterresources and huge potential for developing them.While all agree about the untapped potential, there isincreasing controversy about future development(Bandyopadhyay and Gyawali 1994; Dixit 1994;Pandey 1994). The position favored by theGovernment and private-sector developers is thatlarge-scale projects offer multiple opportunities forflood control, irrigation development, andhydropower development. Many of these benefitsaccrue to downstream areas and urban centers,along with possibilities for export. The benefitstreams are projected to be fairly substantial,although the costs of such projects are alsoextremely large—quite often impossible to meetwithout outside funding.Global experience on dams and developmenthas concluded that past projects have not been aseconomically, socially, or environmentally sound asthey were originally made out to be (Dixit et al. 2005).In the context of mountain areas such as Nepal,large-scale projects (i) have high unit costs (Pandey1994), (ii) have directly and indirectly displaced hugenumbers of people and failed to provide adequatecompensation (Dixit 1994), (iii) dams haveexperienced high levels of sedimentation and largescaledams in mountains may be risky because ofhigh seismic activity, and (iv) these dams have veryoften neglected to help the people in the project areaitself (Bandyopadhyay and Gyawali 1994).In large projects, the entire exercise of planningand implementation is not transparent and once theproject starts moving ahead, it appears to beunaccountable to anyone (Chintan undated). Downstreamareas and even countries are not willing topay for the increased water available in lean seasonsbecause of reservoirs (Pandey 1994). Much time hasbeen wasted over big dams with few results.Paranjapye (1994) had this to say in the case ofthe Arun 3 project: “a juggernaut that will inevitablydistort, undermine and prevent the process ofplanning and decision making”. He proposed thealternatives of going small, with a decentralizedsystem, encouraging local entrepreneurs. There willbe larger local benefit through lesser displacementsand reduced construction periods and earlier flow ofbenefits (Pandey 1985). Even smaller systems cansupply the electric grid.Clearly the odds against large dams areincreasing, but that model retains its advocates andon a case by case basis large dams may bewarranted sometimes. The issues of scale are clearlyrelative based on what a country can afford and whatis realistic in terms of socioeconomic andenvironmental conditions (Dixit et al. 2005). Themost important implications of this development arethat the debate has forced projects to be far morecareful in considering many different parameters,including the voice of those who will be displaced.There is also an urgent need for greater transparency,and participation of all stakeholders.Nepal–India Differences over WaterProjectsAlthough agreements on water projects were signedto develop the Kosi (1954) and the Gandak (1959),and both projects were completed, these bilateral166 Environment Assessment of Nepal : Emerging Issues and Challenges
Lakhpa Norbu SherpaMin BajracharyaSources and solutions of environmental conflict: clockwise from top left-collecting medicinal plants; communityforest user group; poachers in Sagarmatha National Park; queuing for waterBrian Peniston J. Gabriel CampbellChapter 11: Environment and Conflict: A Review of Nepal’s Experience167
cooperative ventures provided neither dependablenor adequate supply of water to Nepal or India andhave been unable to improve agriculturalproductivity (Dixit 1994, Gyawali and Dixit 1994).Another author points out that trust andunderstanding have been eroded, creating a majorimpediment to cooperative development (Kumar etal. 1994).The most recent example of a project that hasrun into problems is the Mahakali Project, which hasbecome a hot political issue in Nepal. Although therehave been several rounds of negotiations, there arestill numerous outstanding issues that need to beresolved before the project can move ahead (Swain2002). India’s unilateral construction of dams inborder areas to prevent summer floods and to storewater during the dry season has created problemson the Nepalese side. Every year some dam iscontroversial; recent cases include the Mahalisagardyke and the Khurdolotan dyke. During summer bothof these have inundated large areas in Nepal (The<strong>Himalayan</strong> Times 2003).Urban Environment and ConflictsGiven the rapid increase in urban population, it is notdifficult to imagine that intense competition forspace and other resources will lead to conflicts. Incities around the world, conflicts over water,dumping sites, air quality, and noise levels areleading to litigation and outright violence (Matthewet al. 2004). In the early stages of urban development,there is a high tolerance for environmental problems,but with further growth a point is reached whenawareness, and the ability to afford a cleanerenvironment, increases and urban renewal begins totake place.Urbanization in Nepal is still among the lowestin the world, although it has been rising quite rapidly.In 2001, 12% of the population—roughly 3.2 millionpeople (Sharma 2003)—were urban dwellers.However, the distribution is very skewed becausefive of the bigger centers with over 100,000population had 39% of the total urban population andthe remainder was distributed among 53 othercenters. Increasing the size of an urban area gives itmany advantages, but it also appears to bring manyenvironmental problems and associated conflicts.Kathmandu’s notoriety as a polluted city hasgrown over the years and so have the conflicts.Because it is the capital city and the biggest urbancenter in the country, its experience provides a goodidea of what can be expected overall if problems arenot dealt with in their early stages. Some of theconflicts are related to certain types of industrial anddevelopment activities. Fortunately many of theproblems have not sought violent solutions andpeople have instead opted to go to court. Some ofthese court cases and decisions are presented belowas examples of the environmental conflicts facingurban areas. These cases have been taken from thecollection of environmental cases put together by ProPublic (Sharma et al. 2000).One of the earliest recorded cases of urbanenvironmental conflict was in 1968/69 when aconcerned citizen filed a case against the cityauthority’s plans to construct stalls for shops arounda public park in the heart of Kathmandu City whichhad a historic significance (Sharma et al. 2000). Thecase was dismissed but was reopened when thepersistent individual took his grievance to the RoyalPalace and succeeded in getting a Royal directive tothe court to reconsider his case. However, theplaintiff died before the second hearing and the courtstated that accordingly there was no need for adecision and dismissed the case, although in itsearlier decisions the court had ruled that theconstruction had no personal impact on theindividual.Another case appeared in 1972/73 when anindividual complained against his neighbor’sactivities to destroy a public pond next to his propertyfor construction on the site (Sharma et al. 2000,pp.13-<strong>18</strong>). Again the court went through severalrounds of deliberations. Dissatisfied with the court’sfirst ruling, the complainant filed a petition to theRoyal Palace and succeeded in obtaining a directivefor reconsidering the case. The city also had aninterest in the case, had formed a committee to lookinto the public significance of the pond, and hadearlier recommended that the pond was indeed avery holy site with significant religious value for thelocal people. In its second deliberation the courtreiterated this aspect of religious significance andordered that the pond be preserved.The next case, in Bhaktapur, may be the first ofits kind in Nepal on air and noise pollution control. In1978/79 a person complained about a factory’sexhaust fumes, pointing out that it had adverselyaffected the health of the people living around thefactory and that this had increased after the ownerhad illegally expanded the factory’s capacity(Sharma et al. 2000). He also pointed out that the cityauthority and the department responsible for givingthe license to the industry had neglected their dutiesby not looking into the expansion proposal carefully.The court considered the facts and gave a surprisingdecision that there was no evidence of damage tothe person or the property of the complainingindividual and dismissed the case. Pollution was anew subject and empirical evidence of the healthimpacts of deteriorating air quality was probably not168 Environment Assessment of Nepal : Emerging Issues and Challenges
available at that time. The Supreme Court did not seea conflict between the polluter and the public,although the complaining individual was clearlyahead of his times.The Godavari Marble Factory, located on theoutskirts of Kathmandu Valley, was charged withpolluting the air and water of the area and withemitting dust that was destroying the biodiversity ofthe forest. The court took the position that thecomplaining individuals were not directly affected bythe activities of the factory and dismissed the case. Itwas resubmitted in 1992/93 and again in 1995/96. It isinteresting that the court was becoming proenvironment during this time. The Rio Summit in1992 received global attention, and environmentalissues were hot in every society around the globe.This probably had some role in changing the laterrulings, which pointed out that environment was aconcern of every citizen and could not be dismissedas in the earlier cases. The court directed the factoryto install proper safeguards (Sharma et al. 2000).The case of the pollution in the Bagmati River issimilar. Although in this case no single offenderexisted, the court did identify numerousorganizations as responsible for correcting thepollution of the river (Sharma et al. 2000). The courtalso directed the organizations concerned to protecthistoric monuments, keep proper records of theproperty of these monuments, stop construction ofan unplanned road, establish a sewage treatmentplant, and improve cremation grounds. All of theseinterventions were also to ensure that the maternityhospital was not adversely affected.The changing position of the courts has been amost welcome development. Future cases are likelyto be even more complex, with additional issues ofcompensation and related measures to right pastwrongs. A persisting anomaly and a major source ofconflict in countries like Nepal is the readiness of theGovernment to introduce environmental legislationwithout ensuring adequate supervision, monitoring,and implementation—which permits offenders tocontinue polluting the environment.The Maoist Insurrection and theEnvironmentThe Maoist insurrection is now close to nine yearsold and has affected all aspects of Nepali lifeincluding the environment. While only post-conflictevaluation can reveal the actual extent of changescaused by the conflict, there are scattered reports ondifferent aspects of environmental changes that maybe attributed to it. The conflict has directly damagedthe environment in terms of destruction and damageto environment-related personnel, resources,infrastructure, and conditions. Furthermore, theenvironment has impacts on the conflict.First let us look at the direct impacts. Based ona field review commissioned by the WorldConservation Union (IUCN), the Nepal Forum ofEnvironmental Journalists did a selected review ofsome areas of the conflict’s impact on theenvironment (IUCN 2004). The review identifiedseveral points of impact.(i) Deforestation is widespread and differentsides blame each other. It should be notedthat deforestation is not unique to theconflict. It has been an ongoing part of Nepalisociety. What part of the deforestation canbe attributed to the conflict is difficult toascertain.(ii) Setting forests on fire has many impacts onwildlife. Again, this is not unique to theconflict and it is difficult to know what type ofwildlife has been affected and how.(iii) Poaching of wildlife has increasedsubstantially. This is highly plausible with thereduction in security in the national parks.While the Maoists may not be poachingdirectly, they may be involving traditionalpoachers and benefiting from the trade, butthere is no hard evidence.(iv) Impact on drinking water supply eitherbecause of increased demand or because ofdamage to water supply systems has beenreported by the local newspapers in anumber of areas.(v) There has been significant displacement ofhouseholds from conflict-affected areas,primarily due to the difficulties of meetingthe different demands of the Maoists.(vi) There is an inability to access forest productsbecause of fear of the Maoists who camp inthe forest areas.Another recent study (Murphy et al. 2004) hasalso identified some of the impacts of the conflictbased on reports from newspapers, publications,and discussions with concerned people. Some of themajor impacts reported are listed below.(i) Destruction of park infrastructure in almostall the national parks, making theseunusable. This has been reported by others(American Embassy 2005) when as many as54 endangered one-horned rhinos werekilled in two national parks but mostly inChitwan National Park. The absence ofprotection in national parks is seen as themajor reason behind this. In 2003, 50 peopleconcerned with poaching were arrested andChapter 11: Environment and Conflict: A Review of Nepal’s Experience169
further poaching has not been reported sofar. During 2003 the officials also made a bigcatch of 32 tiger skins, 579 leopard skins, and660 otter skins. Authorities have caughtpeople with shatoosh skins. The origins ofthese materials are not yet established but itis widely speculated that Nepal has becomea favorite spot for illegal trade in wildlifeparts (Asia Rainforest Conservation Newsand Information 2000; World EnvironmentJournalist Egroup 2002), and the reducedsurveillance in this area could havemotivated poachers and others to takeadvantage of the prevailing situation inNepal.(ii) Organizations working in conservation havehad their work adversely affected eitherbecause of direct threats or because of theprevailing insecurity in rural areas. Manyorganizations have relocated their staff to thedistrict headquarters or to Kathmandu.(iii) Encroachment of park land has also beenmentioned.Some positive impacts have been reported. Iftimber smuggling has increased in some areas, it isreported to have been reduced in others. Similarly, insome areas people say that because they are afraidto go into the forests, the forest has recovered andsome of the wildlife has returned. It is difficult toestablish the precise nature of these changes asverification from the field is difficult.Having reassigned security forces to conflictareas, the national parks are now more vulnerable topoachers, encroachers, and others who value thedifferent resources of the parks. In some areas thesecurity forces have reportedly cleared forests thatwere hiding grounds for Maoists (Hakahaki 2060[2003]). At times of conflict, getting hard evidence isnot easy, and causes and effects may be verycomplex. Only the future will provide a more firmbasis for knowing the real impacts.Many writers both from within and outsideNepal have identified the deteriorating physicalenvironment as a major factor for the insurrection.Sharma argues that there is a strong ethnicdimension to this conflict and that ethnic groups areconcentrated in relatively difficult environments(Sharma et al. 2000). Murshed and Gates (2003) pointout that horizontal inequality across the regions ofNepal is a major factor behind the conflict. Bhurteland Ali (2003) argue that the deterioratingenvironment with its combinations of factors such asfragile mountains, deforestation, soil erosion,decreasing land productivity, and high levels ofpopulation growth and poverty mixed with socialfactors of exclusion, discrimination, marginalization,and disempowerment of ethnic minorities produceda violent eruption that has now lasted for almost adecade.It may also be noted that there has been anincrease in the militarization and politicization ofethnicity in the northeast of India. According toBarbora (2004) this is due to the state’s failure to dealwith the changes brought about by radically differentland use regimes. The Hill areas may beexperiencing the inevitable involution. Authoritiesand indeed society may have neglected, overlooked,or suppressed many smaller implosions in the pastwhich today have boiled over in the form of a violentconflict. The environment in these societies is bothan important cause as well as a victim of theescalating conflict.ConclusionsThis review has provided an overview of theprevailing conflicts regarding natural resourcesutilization and some aspects of the rural and urbanenvironment in Nepal. Conflicts appear to be fairlyextensive regarding some natural resources likeforests and water. In other areas such as theimplications of urban development on naturalresources and the environment, the future isworrying because of the weak nature of theinstitutional mechanisms available for resolvingthese problems.What has been or can be the impact onecosystems and the economy because of theunresolved conflicts? Some problems appear to haveremained for so long that they look almostunsolvable. A major part of the problem is relatedstrongly to the increasingly active role of the state intrying to regulate the harvesting of natural resourcesand taking on responsibilities for which it does nothave adequate resources or capacity. The moresurprising revelation is that the Government still hasnot recognized the continuing nature of conflicts inthe use of natural resources and responds only inspurts when conflicts become too difficult to ignore.This is not to say that there has not been somepositive action by the Government—the mostsignificant has been the move to legitimize the role ofuser groups in the management of forest and waterresources. However, there is still a long way to gobecause the Government is holding on to many areasof authority, which limits autonomy and initiative toresolve problems at the local level.The next issue is related to the laws. A majorcleanup is necessary here because the practiceappears to be to simply carry on as in the past evenas new laws are promulgated. This has not only170 Environment Assessment of Nepal : Emerging Issues and Challenges
created confusion and hindered progress in manyareas, it has served to retain the Government’smonopoly, even when the spirit of the new lawsindicates that this is not the intention.Once environmental decisions are taken by thecourts, the Government, and civil society, whoshould do the enforcement? Conflicts mean that oneparty is not going to change its position voluntarilyunless under the threat of punitive action. This aspecthas been most lacking in the history of naturalresources management. The recommendations ofone commission are simply reiterated by another,and the process has gone on ad infinitum in the caseof resettlement, illegal settlers, and encroachment. Asimilar story is being enacted regarding the SupremeCourt’s decisions in environmental matters.As a mountainous country with a beautiful butfragile environment, it is critical that Nepal manageits environment by using its natural resources in asustainable manner. The prevalence of conflict in allthe major natural resource areas suggests thatgovernance has been ineffective and in some areaseven harmful, especially when short-sighted policiesand decisions promote wanton destruction of naturalresources. Clearly the Government has a majorresponsibility to clean up its act regardingenvironment and conflict in Nepal.BibliographyAmerican Embassy. 2005. “The Impact of Nepal’s ArmedConflict on Conservation Efforts.” RegionalEnvironment Hub, American Embassy, Kathmandu.Available:http://kathmandu.usembassy.gov/env_page5.htmlAsia Pacific <strong>Centre</strong> For Security Studies (APCSS). 1999.Water and Conflict in Asia? Honolulu. Available:http://www.apcss.org/Publications/Report_Water&Conflict_99.htmlAryal, G.R. and G. Awasthi. 2003. Agrarian Reform andAccess to Land Resource in Nepal: Present Statusand Future Perspective Action. Philippines:Environment, Culture, Agriculture, Research andDevelopment Society (ECARDS)—Nepal. Available:http://www.cerai.es/fmra/ archivo/nepal.pdfAsia Rainforest Conservation News and Information. 2000.“Wildlife Contraband Finds Easy Route throughNepal.” January 21. Available:http://www.forests.org/archive/asia/wlcontfi.htmBandyopadhyay, J. and D. Gyawali. 1994. “Ecological andPolitical Aspects of <strong>Himalayan</strong> Water ResourcesManagement.” Water Nepal 4(1): 7–24.Banskota, M. and S.R. Chalise, eds. 2000. Waters of Life:Perspectives of Water Harvesting in the Hindu Kush-Himalayas. Kathmandu: International <strong>Centre</strong> forIntegrated Mountain Development.Barbora, S. 2004. Land Class and Ethnicity: Permutations ofEnvironmental Conflict in Assam Shillong: NorthEastern Hill University.Bhatia, A., ed. 1995. “Nepal Madhyasthata Samuha.”Seminar on Conflict Resolution in Natural Resources,organized by Participatory Natural ResourceManagement Programme of International <strong>Centre</strong> forIntegrated Mountain Development (ICIMOD),Kathmandu.Bhattarai, B.N., and K.K. Pradhan. 2004. “The Future ofRural and Agriculture Finance Institution in Nepal.”Paper presented at a Symposium on Future of RuralAgricultural Finance Institutions, organized by AsiaPacific Rural and Agricultural Credit Association inTeheran, Iran, October 2004. Available:http://www.agri-bank.com/Static/English/Apraca/PDF/Nepal.pdfBhurtel, J., and S.H Ali. 2003. The Green Roots of RedRebellion: Environmental Degradation and the Riseof the Maoist Movement in Nepal. Burlington: TheUniversity of Vermont. Available:http://www.uvm.edu/~shali/Maoist.pdfBosley, C., I. Rucker, and S. Theisman. 2000. Elephants inthe Border Region of Nepal and India. Washington,DC: American University, School of InternationalService. Available: http://www.american.edu/TED/wildlife-india.htmBritt, C.D. 2002. “Changing the Boundaries of ForestPolitics: Community Forestry, Social Mobilization,and Federation-Building in Nepal Viewed Throughthe Lens of Environmental Sociology and PAR.”Dissertation presented to the Faculty of the GraduateSchool of Cornell University in partial fulfillment ofthe requirement for the degree of Doctor ofPhilosophy. Ithaca: Cornell University.Central Bureau of Statistics (CBS). 2004. Hand<strong>book</strong> ofEnvironment Statistics 2003. Kathmandu.Conca, K. and G. Dabelko. 2002. The Case forEnvironmental Peace Making. Baltimore: JohnsHopkins University Press.Dabelko, G. and A. Carius. 2004. “Institutional Responses toEnvironment, Conflict and Cooperation.” InUnderstanding Environment, Conflict andCooperation, pp. 21–33. Nairobi: United NationsEnvironment Programme. Available:http://www.unep.org/pdf/ECC.pdfDixit, A. 1994. “Water Projects in Nepal: Lessons FromDisplacement and Rehabilitation.” Water Nepal 4(1):74–85.Dixit, A., P. Adhikari, and S. Bishankhey, eds. 2005. Badh RaBikash: Rachanatmak Sambad [in Nepali].Kathmandu: The World Conservation Union (IUCN),Nepal.Ehrlich, A.H., P. Gleick, and K. Conca. 2000. “Resources andEnvironmental Degradation as Sources of Conflict.”Draft Background Paper for Working Group 5,Pugwash Conference on Science and World Affairs,“Eliminating the Causes of War”, Queens’ College,Cambridge, UK, 3–8 August. Available:Chapter 11: Environment and Conflict: A Review of Nepal’s Experience171
http://www.pugwash.org/reports/pac/pac256/WG5draft.htmEhrlich, P., A.H. Ehrlich, and J.P. Holdren. 1997. EcosciencePopulation, Resources, Environment. San Francisco:W.H. Freeman and Company.EPA (US Environmental Protection Agency). 2005. “CleanAir Markets—Allowance Trading.” Downloaded onJanuary 30, 2006. Available:http://www.epa.gov/airmarkets/tradingGhimire, K. 1992. Forest or Farm: The Politics of Poverty andLand Hunger in Nepal. New Delhi: Oxford UniversityPress.Gleditsch, N.P. 2004. “Beyond Scarcity vs. Abundance: APolicy Research Agenda for Natural Resources andConflict.” In Understanding Environment, Conflictand Cooperation, pp.16–<strong>18</strong>. Nairobi: United NationsEnvironment Programme. Available:http://www.unep.org/pdf/ECC.pdfGlobal, IDP. 2004. “Ex-Kamaiyas Encroach on 10,000 Acresof Government Land in Protest Over State’s EmptyPromises to Rehabilitate Them.” Norwegian RefugeeCouncil/Global IDP Project, Geneva, Switzerland.August. Available: http://www.internaldisplacement.org/8025708F004CE90B/(httpEnvelopes)/85744F58B8384B29802570B8005AAD85?Open<strong>Document</strong>Grosen, J. 2000. “Policy and Legal Framework Issues.” In:Community Forestry in Nepal: Proceedings of theWorkshop on Community Based Forest ResourceManagement, November 20–22, Godawari, Lalitpur:Joint Technical Review Committee.Gyawali, D. and A. Dixit. 1994. “The Himalaya-Ganga:Contending with Inter-linkages in a ComplexSystem.” Water Nepal 4(1): 1–6.Hakahaki. 2060 [2003]. “Sasatra Dwandako Mar maPrakirti” [Impact of Armed Conflict on Nature],Weekly publication in Nepali, year 6 no. 6.Kathmandu.Hardin, G.J. 1968. “The Tragedy of the Commons.” Science162 (1968): 1243–48.Homer-Dixon, T.F. 1999. Environment, Scarcity andViolence. Princeton, New Jersey: PrincetonUniversity PressInternational Development Research <strong>Centre</strong> (IDRC). 2005.Cultivating Peace : Conflict Over Natural Resources.Ottawa. Available: http://www.idrc.ca/en/ev-28105-1-Do_TOPICIntegrated Development Systems (IDS). 1985. RuralLandlessness in Nepal. Kathmandu.International Fund for Agriculture Development (IFAD).2004. Nepal: Degraded Land Use Helps the PoorChange Their Lives. Kathmandu: Inter Press Service.Available:http://www.ifad.org/media/news/2004/020604.htmIUCN (The World Conservation Union). 2004. “SustainableLivelihoods, Environmental Security and ConflictMitigation in Nepal: Trends and Challenges in theKoshi Tappu Area of Nepal.” Revised draft report,Kathmandu, IUCN Nepal Country Office.Jodha, N.S. 1986. “Common Resources and Rural Poor.”Economic and Political Weekly, 21(27): 1169–81.Khadka, N.S. 2005. “Kali Gandaki “A” Finds itself in $50Million Controversy.” In Nepali Times, 25–31 July,Kathmandu.Available:http://www.environmentnepal.com.np/articles_d.asp?id=154Khor, M., ed. 1996. “Environment Debate Heating Up.”Penang: Third World Network. Available:h t t p : / / w w w . s u n s o n l i n e .org/trade/areas/environm/07050196.htmKumar, S., A.K. Sinha, and N. Prakash. 1994. “Cultural andWater Bonds.” Water Nepal 4 (1): 62–66.Libiszewski, S. 1995. “What is an Environmental Conflict.”Environment and Conflict Project, ENCOPOccasional Paper, <strong>Centre</strong> for Security Studies ,Zurich, Swiss Peace Foundation.Martin, E.D. and R. Yoder. 1987. “Institutions for IrrigationManagement in Farmer-managed Systems:Examples from the Hills of Nepal.” InternationalIrrigation Management Institute, Sri Lanka. Available:http://www.sristi.org/cpr/cpr_detail.php3?page=16&Mode=InstitutionsMason, R. 1996. “Market Failure and EnvironmentalDegradation.” In The Economics of EnvironmentalDegradation: Tragedy of the Commons? Edited byT.M. Swanson, pp. 29–54. Brookfield, VT: EdwardElgar.Matthew, R.A., M. Brklacich, and B. McDonald. 2004.“Analysing Environment, Conflict and Cooperation.”In Understanding Environment, Conflict andCooperation, pp.16–<strong>18</strong>. Nairobi: United NationsEnvironment Programme. Available:http://www.unep.org/pdf/ECC.pdfMEG. 1996. Personal Communication to Metals EconomicsGroup Halifax, Canada.Millennium Ecosystem Assessment Working Group (MEA).2003. Ecosystem and Human Well-being, AFramework for Assessment. London: Island Press.Ministry of Population and Environment (MOPE). 2000.State of the Environment Nepal. Kathmandu.Murphy, M.L., K.P. Oli, and G. Stephan. 2004. Conservationin Nepal: A Review of Impact from the MaoistsConflict. Kathmandu: The World Conservation Union(IUCN).Murshed, S.M. and S. Gates. 2003. Spatial-HorizontalInequality and the Maoist Insurgency in Nepal. Paperprepared for the United Nations University/ WIDERProject Conference on Spatial Inequality in Asia,28–29 March, United Nations University <strong>Centre</strong>,Tokyo. Available: http://www.wider.unu.edu/conference/conference-2003-1/conference-2003-1-papers/s%20mansoob%20murshed%20-%20scott%20gates.pdfNepal, S.K., and K.E. Weber. 1993. Struggle for Existence:Parks-People Conflict in the Royal Chitwan National172 Environment Assessment of Nepal : Emerging Issues and Challenges
Park, Nepal. Bangkok: Division of Human SettlementDevelopment, Asian Institute of Technology.New Era. 1989. The Dynamics of Poverty in Nepal.Kathmandu.Ostrom, E. 2000. “Reformulating the Commons.” SwissPolitical Science Review 6(1): 29–52.Panday, S.R. 1985. The Political Economy of Nepalese LandReform. Kathmandu: <strong>Himalayan</strong> Pioneers for PublicService and Research.Pandey, B. “Dams and Civil Society in Nepal: MajorConcerns.” Available: http://www.dams.org/kbase/submissions/showsub.php?rec=soc031Pandey, B. 1994. “Small Rather than Big: Case forDecentralized Power Development in Nepal.” WaterNepal 4(1): <strong>18</strong>1–190.PANOS South Asia. 2002. Justice For All. Kathmandu.Available: http://www.panos.org.np/ resources/publications/panos_reports.htm#justicePant, R. 2002. Customs and Conservation, Cases ofTraditional and Modern Law in India and Nepal.Pune: Kalpavriksh.Paranjapye, V. 1994. “Preliminary Look at Arun III in Light ofTehri Experience.” Water Nepal 4(1): 30–35.Paudel, A. 1996. “Environmental Management of theBagmati River Basin.” Case Study 28, EIA TrainingResource Manual, United Nations EnvironmentProgramme, Nairobi.Pradhan, B. 1999. “Water Quality Analysis of the BagmatiRiver and its Tributaries in Kathmandu Valley UsingBacterial and Saprobic Measures.” Proceedings ofThird National Conference on Science andTechnology. Kathmandu: Royal Nepal Academy ofScience and Technology.Pradhan, P. 1990. Farmer Managed Irrigation Systems inNepal. International Irrigation Management Institute,Kathmandu. Common Property ResourcesInstitutions (CPRI). Available: http://www.sristi.org/cpr/cpr_detail.php3?page= 34&Mode=InstitutionsPradhan, R., F. von Benda-Beckmann, and K. von Beda-Beckmann, eds. 2000. “Water, Land and Law:Changing Rights to Land and Water in Nepal.”Proceedings of a Workshop held in Kathmandu,<strong>18</strong>–20 March, 1998. Kathmandu: Jagadamba Press.Socioeconomic and Ethnopolitical Research and TrainingConsultancy (SEEPORT). 2000. Land Policies, LandManagement and Land Degradation in the Hindu-Kush Himalayas. Nepal Study Report, pp. 1–98,International <strong>Centre</strong> for Integrated MountainDevelopment (ICIMOD), Kathmandu.Sharma, P. 2003. “Urbanization and Development.” InPopulation Monograph of Nepal, Vol. 1, pp. 375–412.Kathmandu: His Majesty’s Government of Nepal,Central Bureau of Statistics.Sharma, S. 2002. The Ethnic Dimension of the MaoistInsurgency. Kathmandu.Sharma. B., M. Prakash, B.R. Ayer, L.B. Thapa, and B.P.Pokharel. 2000. Environmental Protection RelatedCases Collection. Kathmandu: Pro Public.Shrestha, K., and J. Grosen. 2000. “Protection Versus ActiveManagement of Community Forests.” In: CommunityForestry in Nepal: Proceedings of the Workshop onCommunity Based Forest Resource Management,November 20–22, Godawari, Lalitpur: JointTechnical Review Committee.Shrestha, T.B. 2001. Status Review National Strategies forSustainable Development Forest/Rangeland/Biodiversity. Paper submitted to the WorldConservation Union (IUCN). Available:http://www.nssd.net/country/nepal/nep09.htmSiwakoti-Chintan, G. 2003. “Request for a review of <strong>ADB</strong>policy compliance in case of Kali Gandaki “A” andMelamchi projects in Nepal and undertakenecessary remedial actions in case of both projects.”Letter sent to the <strong>ADB</strong> President and Secretary ofMinistry of Water Resources by the Water and EnergyUsers’ Federation—Nepal (WAFED). June 27.Kathmandu: Available: http://www.forumadb.org/PDF-Manila/wafed_melamchi&kalijun03.pdfSpringate-Baginski, O., N. Yadav, O.P. Dev, and J. Soussan.2003. “Institutional Development of Forest UsersGroups in Nepal.” Journal of Forest and Livelihood3(1) 21–35.Swain, A. 2002. “Environmental Cooperation in SouthAsia.” In Environmental Peacemaking edited by K.Conca and G.D. Dabelko, pp. 61–85. Washington, DC,Baltimore, and London: Woodrow Wilson CenterPress/Johns Hopkins University Press.Swanson, T.M. 1996. “The Economics of EnvironmentalDegradation: An Institutional Approach.” In TheEconomics of Environmental Degradation: Tragedyfor the Commons? Edited by T. M. Swanson.Cheltenham: United Nations EnvironmentProgramme and Edward Elgar.The <strong>Himalayan</strong> Times. 2003. “Dam Puzzle.” 29 July.Available: http://www.environmentnepal.com.np/articles_d.asp?id=152The Rising Nepal. 2004. “Rautes Against JungleEncroachment.” 4 January. Kathmandu. Available:http://www.gorkhapatra.org.np/pageloader.php?file=2004/03/15//topstories/main7Tiwari, S., J. Robinson, and G. Amatya. 2003. “PromotingSustainable Livelihoods of Poor and Dalits throughCommunity Based Approaches to Conservation andSustainable Management of Medicinal and AromaticPlants in Doti District: Experience of IUCN Nepal.”Paper presented at the National Workshop on LocalExperience Based National Strategy for OrganicProduction and Management of Medicinal andAromatic Plants/Non Timber Forest Products inNepal. Organized by Ministry of Forests and SoilConservation in collaboration with InternationalDevelopment Research <strong>Centre</strong> and the CanadianCooperative Office, Kathmandu.Chapter 11: Environment and Conflict: A Review of Nepal’s Experience173
United Nations. 2003. World Population Prospects. NewYork.United Nations Environment Programme (UNEP). 2002.UNEP’s Global Environment Outlook 3. London :Earthscan.Uprety, D.R. 2003. “Evaluation of Forest Sector Policy inConnection to Community Forestry of Nepal.”Submitted for the partial fulfillment of the Doctoratestudy at the University of Natural Resources andApplied Life Sciences, Vienna.World Environmental Journalists Egroup. 2002. “IllegalWildlife Trade Rampant in Nepal.” In People andPlanet, <strong>18</strong> November. Available:http://www.peopleandplanet.net/doc.php?id=<strong>18</strong>04World Wide Fund for Nature (WWF). 2003. “New PolicyProhibits Domesticated Elephants Inside NationalParks.” WWF-Nepal, Kathmandu. Available:http://www.wwfnepal.org.np/ WildlifeNews/PolicyDomElephants.htmYadav, R.P. 1999. “Land Tenure Situation in Nepal.” PolicyOutlook Series, No. 5, His Majesty’s Government ofNepal, Ministry of Agriculture/Winrock International,Kathmandu.174 Environment Assessment of Nepal : Emerging Issues and Challenges
Chapter 12Environment and TradeIntroductionThis chapter is not about trade or about theenvironment; it is about the increasing overlapbetween trade and environment where thereare trade-related environmental issues andenvironment-related trade issues. Trade-relatedenvironment problems can be seen in the exports ofnatural resources such as forest products and theresulting deforestation that could impact awatershed and lead to serious environmentalconsequences for an area’s people and biodiversity.Export industries may be using so much of scarcewater resources that the increasing competitionactually keeps people and ecosystems fromaccessing this resource. In addition there may besignificant water and air pollution, as there is rarelyonly one environmental problem associated with anytype of manufacturing industry.Environment-related trade issues deal withenvironmental measures taken to control or regulateenvironmentally undesirable trade because ofthreats to human and plant life or to the overallenvironment. The World Trade Organization’s (WTO)sanitary and phyto-sanitary measures are goodexamples of environment-related trade measures.There is a wide ranging discussion about many ofthese environment-related trade measures becausedeveloping countries are arguing that this is anotherform of protectionism being introduced bydeveloped countries.On the one hand we see a strong move towardsliberalization, with countries like the People’sRepublic of China and India coming up as neweconomic powerhouses following their gradualliberalization, but there is also a strong push fromdeveloped countries to impose new restrictions andsanctions on trade related with environmental,social, labor, and even human rights issues. Some ofthe environmental standards have adversely affectedexports from developing countries. Many issuesremain unresolved. Over the next few yearssignificant changes will occur in the areas of tradeand environment relationships. To the extent thatdeveloping countries can benefit from environmentallyfriendly exports, trade will have a positiveimpact on the environment. However, experienceshows that this need not always happen. Exports arebeing lost on environmental grounds, given the highcosts of changing industry practices, which may notbe possible in the short run. In such cases both theenvironment and the economy may suffer.Nepal is a relatively small and new player in thefield of environment and trade. This may be bothgood and bad for the country. It may be goodbecause its small trade means current investments indirty equipment, management practices, and laborskills may be altered relatively easily. It may be badbecause as a poor country it has few options andlimited resources to exercise any option fully. Nepalis already a member of the WTO, having agreed toplay by its rules. Exports to the European Union (EU)and United States of America (US) are limited butextremely significant in terms of overall exports.These are also the main destinations with toughenvironmental standards that are getting morestringent every year and are also being rigorouslyenforced by these countries. In addition there aremultilateral environmental agreements, many ofwhich Nepal has ratified or signed. How successfulNepal will be in promoting its trade in the context ofthese developments only time can tell.The challenges for this poor nation areformidable not only on account of the increasinglystringent standards abroad but more significantly onaccount of the terribly disorganized state of thedomestic institutions responsible for promoting tradeand improving the environment.This chapter reviews Nepal’s current situationregarding trade and environment. The next sectionoutlines the ongoing discussion in the areas of trade,environment, and sustainable development. This isfollowed by a review of the different trade-relatedenvironmental obligations under multilateralenvironmental agreements, and then a review of thetrade environmental agreements that Nepal has withthe WTO and India, and the restrictions imposed byNepal. The next part reviews Nepal’s exports,imports, and trade with different regions of theworld. As Nepal’s trade is relatively small, any seriouseffort to increase it will mean understanding betterChapter 12: Environment and Trade175
how other countries with substantially larger tradehave been faring so far. This is briefly discussed in thefollowing section. The chapter closes with someobservations on the future implications for Nepal’strade and environment.Trade, Environment, andSustainable DevelopmentLiberalization of TradeThe rationale for free trade is based on the principlesof comparative advantage. Interregional tradebenefits both partners, as each can gain from theother’s comparative advantages and have access tocheaper goods, raw materials, and new ideas;market discipline can also be enhanced. Trade alsobrings in critical foreign exchange. Although thedirect relationship of trade to economic growth iscomplex, throughout history countries open totrading have always enjoyed greater prosperity thanthose that have remained relatively isolated. Intoday’s world, with increasing global interdependence,few countries can pursue completelyisolationist policies.Bhagwati (2001) points out that India hasexperienced healthy growth since 1991 afterreversing past protectionist policies and excessivereliance on the public sector. With the opening of itseconomy, India benefited from a growing worldeconomy and direct foreign investment, which wasmade possible by changing past policies regardingtaxes, licensing, foreign exchange, and others. Hefurther points out that it is easy to fall prey to notionsthat markets, globalization, and privatization reformsare not for the poor. Without denying the need forsupplemental policies, growth-oriented policies suchas free trade are seen as necessary for reducingpoverty.Commenting on the performance of theBangladesh economy, Ahmed and Sattar (2004)point out that trade liberalization and economicderegulation have contributed to output growth andhelped to reduce poverty, although this might nothave been to the extent desired. Other findings arethat greater reduction in poverty will require morefocused and targeted programs in agriculture andrural non-farm sectors (Ahmed and Sattar 2004). Thedirect effects of liberalization have been positive,with overall manufacturing growing more rapidlythan before the new policies. The textile sector,which is fairly labor intensive and employs manywomen, has been a major beneficiary. The fears ofde-industrialization and import rush have proven tobe unfounded.Going back a little further, we find that even indeveloped countries, trade was liberated in stages.Tariffs on manufactured products were graduallylowered over a fairly long period through successiverounds of international trade negotiations (SouthCenter 1996). Although current account convertibilitywas introduced in the 1950s, capital accountconvertibility has been relaxed very slowly and insome cases only recently. This has variedsignificantly from country to country. Liberalization inlabor flows has been even slower.Insofar as developing countries are concerned,the creation of the United Nations Conference onTrade and Development (UNCTAD) was significantbecause for the first time the General Agreement onTariffs and Trade (GATT) accepted that industrializedcountries would provide preferential access in theirmarkets to goods from developing countries, whilepermitting developing countries to impose tariffs onproducts from the developed countries. However,with the establishment of the WTO, some of this haschanged. Whenever liberalizing reforms have beensudden and imposed by multilateral lendingagencies, countries have faced a crippling debt crisis.When reforms have been voluntary, gradual, andguided as in some Asian countries, the results havebeen encouraging (South Center 1996).Environment and Trade DiscussionsTrade and environment relationships have beendiscussed since the 1970s, but without concreteresults. With the mounting evidence of environmentaleffects on all aspects of daily life, strongervoices were raised in various international forums. In1982 the developed countries raised issues of healthhazards from products already prohibited in theircountries (WTO 2005). From 1982–1993 a series ofhealth-related trade measures were introduced bythe developed countries. These have been integratedinto WTO rules and regulations. Trade discussionshave proceeded almost parallel to discussions onsustainable development and multilateralenvironmental agreements where trade plays animportant role. While there are many overlaps, WTOreiterates that it is not an environmental agency.United Nations Environment Programme(UNEP) reviewed the experience of a number ofdeveloping countries on trade liberalization andenvironment and concluded that trade liberalizationis good for trade but not for the environment, andthat specific attention must be paid to the environment(UNEP 1999). If environmental factors are notrecognized at the outset and included in the policydesign, irreparable damage may occur. Full valuationof resources and full cost pricing of resources areessential. A judicious mix of market instruments and176 Environment Assessment of Nepal : Emerging Issues and Challenges
standard setting is the most appropriate approach.Access to information, methods of gathering data,and techniques of integrated analysis need to beimproved.WTO and EnvironmentThe issue of environment has been highlycontroversial in the past few years and is likely toremain so in the future. WTO’s position on theenvironment is reflected by the principles guiding itsCommittee on Trade and Environment. These are: (i)WTO is not an environmental protection agency andits competence is limited to trade and to thoseaspects of environmental policies that are traderelated and may have significant effects on WTOmembers’ trade; (ii) The WTO agreements(including earlier agreement under GATT) alreadyprovide significant scope for countries to pursue nondiscriminatorynational environmental policies; (iii)Increased coordination and internal cooperation arenecessary to address environmental concerns; and(iv) Secure market access opportunities are essentialto help developing countries work towardssustainable development (Boyer 2001; WTO 2005).WTO’s overall position is that trade can be bothgood and bad for the environment, and experienceshows cases of both. “Win-win” outcomes can beassured through well-designed policies in both thetrade and environment fields.Some argue that trade and environmental issuesneed to be reviewed in the context of sustainabledevelopment. Sustainable development emphasizes,among other things, environmentally sound andsustainable production practices and the capacity tofulfill the basic human needs of present and futuregenerations. Trade plays a key role in promotingparticular types of technology.Trade has been strongly linked to inequalities,environmental degradation, and poverty (Khor 1996).A major task before sustainable development is toreform trade. Arguing that free trade is always goodfor the environment ignores the large number ofenvironmental problems in the world today.Although the toxic intensity of emissions andpollution as a proportion of gross national producthas declined in the developed countries, theabsolute levels are still going up (Boyer 2001). Otherconcerns raised in the context of world trade includethe following:(i) Many non-trade issues such as environment,labor, social standards, and human rights,especially those within the areas of domesticpolicy and national decision making, havebeen included.(ii) It is maintained that environmentalmeasures have been imposed on developingcountries through the threat of tradesanctions.(iii) There is a need to recognize the widedifferences in endowments; levels ofpollution, waste, and absorptive capacity;production systems; and levels of development,when determining environmentalstandards.UNEP (2003) under its Global EnvironmentOutlook scenario analysis undertook an exercise tolook into the future, using four scenarios to explorewhat the future could be depending on differentpolicy approaches. These scenarios are “MarketFirst”, “Policy First”, “Security First”, and“Sustainability First”. Market First is basicallyfollowing the practices of the present industrializedworld. Policy First makes a deliberate effort to givepriority to environmental and social concerns.Security First gives priority to overcoming strikingdisparities where inequality and conflict prevail.Sustainability First introduces a new environmentand development paradigm. Some of the resultswere as follows:(i) Carbon dioxide and other greenhouse gasesincrease significantly in the next 30 yearsunder Market First and Security Firstscenarios. Global emissions start reducingaround 2030 under the Policy First scenariobecause of carbon tax and investments innon-fossil-fuel energy sources.(ii) Biodiversity, however, continues to be underthreat unless urban and infrastructureexpansion and climate change can beeffectively controlled.(iii) The Market First scenario sees some declinein percentage of basic human needs met,but the absolute numbers increase. UnderPolicy First and Sustainability First scenarios,a targeting of hunger helps to reducesignificantly the percentages and totalnumbers of people affected. The SecurityFirst scenario leads to a sharp increase.(iv) The report points out that “the overridingneed in policy development is for a balancedapproach towards sustainable development.From the environment perspective thismeans bringing the environment from themargins to the heart of development.”Nepal—Trade, Environment, andSustainable DevelopmentNepal’s present development strategy is outlined inthe Tenth Five-Year Plan (2002–2007) which is alsothe Poverty Reduction Strategy Programme. Theprogram has four major thrusts:Chapter 12: Environment and Trade177
(i) Broad-based and sustainable economicgrowth,(ii) Improving the quality and availability ofsocial and economic services,(iii) Ensuring social and economic inclusion ofpoor and marginalized groups, and(iv) Vigorously pursuing good governance.Nepal has been moving strongly towards aliberalized economy. It has drastically reduced tariffsand removed licensing requirements for manyimports. It has divested many public enterprises,relinquished its public-sector monopoly on importsof fertilizer, and removed the subsidy on someagricultural inputs. The economy was showing manyhealthy signs regarding growth, trade, and evengovernment revenue until very recently. However,the country’s widening conflict has slowed theeconomy and many critical indicators have showndiscouraging signs during fiscal year (FY) 2004 (MOF2004).Although the environment has not figuredamong the high-priority overall policies, it getsmentioned in sectoral policies such as forestry,infrastructure, urban development, and a few others.However, even under the Poverty Reduction StrategyProgramme, it is inconceivable that rural poverty canbe addressed without considering the available localnatural resources and their sustainablemanagement. Improved management of land, water,and forest resources and their better distribution arefundamental for reducing poverty in rural areas, inaddition to developing rural non-farm sectors.Important issues regarding governance of naturalresources need to be urgently addressed in thecontext of poverty reduction.In addition to these measures, different actionplans like the National Biodiversity Strategy 2004, theClean Production Measures Programme, and theEnvironment Sector Support Programme are trying toaddress the country’s environmental issues.Nepal and MultilateralEnvironmental AgreementsNepal has ratified the following conventions relevantto trade:(i) Plant Protection Agreement for the South-East Asia and Pacific Region 1956.(ii) Convention on the International Trade inEndangered Species of Wild Fauna and Flora(CITES) 1973.(iii) Montreal Protocol on Substances thatDeplete the Ozone Layer 1987 and itsamendments.(iv) Basel Convention on the Control ofTransboundary Movement of HazardousWastes and Disposal.(v) Convention on Biological Diversity (CBD)1992, and the Cartagena Protocol on(vi)Biosafety 2000.United Nations Framework Convention onClimate Change 1992, and the Kyoto Protocol1997 (accession).(vii) International Tropical Timber Agreement1994.There are a few other agreements that Nepalhas not signed at present, but may eventuallybecause of the issues they address.Each of the agreements is reviewed brieflybelow regarding trade implications.The Plant Protection Agreement for the South EastAsia and Pacific Region, 1956 or Asia Pacific PlantProtection Convention. The main objective of thisagreement is to prevent the introduction into andspread of destructive plant diseases and pests withinthe South East Asia and Pacific Region. In Nepalvarious measures have been implemented such asthe Plant Protection Act 1972 (2029 BS), PlantProtection Regulations 1975 (2031 BS), Forest ActAmendment 1993, and National Parks and WildlifeConservation Act 1973. However, implementationhas been very weak due to an open border, insufficientcheckpoints, and inadequate laboratories andquarantine stations (Sapkota undated).Convention on the International Trade inEndangered Species of Wild Fauna and Flora(CITES) 1973. CITES has a number of articlesrelevant to trade. Article II deals with trade inendangered species and defines conditions underwhich trade may take place. Protected species areclassified and listed in three appendices. Article IIIrefers to species threatened with extinction. Trade inthese species is subject to strict regulation andpermitted only under exceptional circumstances.The general thrust is that trade should not be forcommercial purposes and should not be harmful tothe species. The Convention of Parties under CITESregularly reviews illicit trade problems andrecommends suspension of trade with countries thatfail to comply with CITES provisions. Tradesuspension is recommended when there is (i)significant trade, and (ii) absence of domesticmeasures to enforce the provisions of conventions.More recently in the Convention of Parties 11 it wasagreed that trade suspension recommendationswould apply to countries that did not submit annualnational reports as required by Article VIII (7) (a) forthree consecutive years.178 Environment Assessment of Nepal : Emerging Issues and Challenges
Nepal has implemented various acts, rules, andregulations including a ban on collection, use, sale,distribution, transportation, and export of two plants—Cordyceps misirensis (yarcha gumba) and Orchislatefolia (paunch ounle). Similarly, the Governmenthas banned transportation, exports, and sale ofkhayar (Acacia catechu), chanp (Micheliaehampaca), and sal (Shorea robusta). However,experts consider the existing provisions andmeasures taken insufficient to fulfill the obligationsunder CITES (Sapkota undated).Montreal Protocol on Substances that Deplete theOzone Layer 1987 and its amendments. The mainfocus is on controlling the production and use ofozone-depleting substances (ODS). Articles focus oncontrolling imports and exports of all types of ODSand changing chlorofluorocarbon technologies tomore ozone-friendly options. Support has beenreceived for institutional strengthening and technicaladvice for reducing the use of ODS. Parties havingdifficulties meeting their obligations under theprotocol have to notify the Member of Parties. Nearly2,500 projects are being implemented in developingcountries to shift to non-ODS substances. Nepal hasagreed to reduce chlorofluorocarbon use at the rateof 3 tons per annum, phasing it out entirely by 2010.For halons being used by agriculture, hospitals, andfire brigades, it was agreed to reduce the amountannually and phase it out by 2040 (Mainali undated).Basel Convention on the Control ofTransboundary Movement of Hazardous Wastesand Disposal. This convention is directed towardsenvironmentally sound management of hazardouswaste as it is moved from one country to another.Countries can ban the imports of such hazardouswaste. Exports must have written consent of theimporters. If an importing country lacks the capacityto manage hazardous substances, parties can stoptheir exports. No hazardous waste can be exported toAntarctica, and there are packaging, labeling, andtransport requirements for hazardous waste. Limitedsupport is provided for capacity building.Convention on Biological Diversity 1992. Thepurpose of this convention is the conservation ofbiological diversity, promotion of sustainable use,and fair and equitable sharing of benefits arising fromthe use of genetic resources. Although it does notdirectly refer to trade measures, there are activitieswith trade implications. Those relate to preservingand maintaining knowledge, innovation, andpractices of indigenous and local communities, useof biological diversity, and fair and equitabledistribution of the use of genetic resources.Translating these into actual legislation and otherprocedures will need to clarify conditions of access,sustainable use, and benefit sharing of a country’sbiological resources.Nepal has instituted various policies, legislation,and institutional measures to implement theprovisions of the convention, and completed aNational Biodiversity Strategy in 2002. However, thereis an urgent need for updating the biodiversitydatabase so that the changes can be betterunderstood over time and endangered flora andfauna better monitored and protected. At present,little is known of the extent of trade in endangeredflora.Cartagena Protocol on Biosafety, 2000. Thisprotocol seeks to ensure safe transfer, handling, anduse of living modified organisms that may haveadverse impacts on biological diversity and humanhealth. It maintains that trade and environmentshould be mutually supportive, withoutcompromising biosafety for humans andenvironment. This protocol does not seek to changethe rights and obligations of a party under existinginternational agreements like the WTO. However,parties can take more protective actions than calledfor in the protocol. It specifies an Advanced InformedAgreement procedure that will hold in theinternational transboundary movement of livingmodified organisms. There are provisions for abiosafety clearinghouse that will focus on riskassessment in accordance with specified proceduresand time periods. There are specific handling andtransport requirements for living modifiedorganisms.United Nations Framework Convention on ClimateChange 1992. The objective here is the stabilizationof greenhouse gas concentrations in the atmosphere.It does not directly restrict trade, but actions relatedto reducing greenhouse gases could impact trade. Itpoints out that actions taken to combat climatechange should not be discriminatory to internationaltrade. A Global Environment Facility (GEF) providesfinancial resources to help countries reducegreenhouse gases by adopting appropriatetechnologies.Kyoto Protocol, 1997. This protocol to the UnitedNations Framework Convention on Climate Changeseeks to reduce emission of carbon dioxide throughenhancement of energy efficiency in all greenhouseemittingsectors. It supports the use of economic andfinancial incentives for adopting energy efficienttechnologies. It introduces the concepts of cleandevelopment mechanisms and emissions trading.Chapter 12: Environment and Trade179
Although progress is encouraging, much remains tobe done. EU countries have ratified the KyotoProtocol but the US has not. In the absence ofParliament, Nepal became a Party to the Protocolthrough a Royal ordinance in September 2005.International Tropical Timber Agreement (ITTA),1994. This Agreement seeks to promote internationaltrade in tropical timber, the sustainable managementof tropical forests, and development of tropical forestindustries. Trade-related aspects deal with providinga forum for consultation on promoting nondiscriminatorytimber trade practices, helpingcountries to develop strategies for sustainablemanagement of timber products (including exports),diversification of international trade in tropicaltimber on a sustainable and equitable basis, bringinggreater transparency in the international timbermarket, and promoting information sharing on theinternational timber market. Nepal is a member ofthe Agreement and has been participating in itsmeetings.Agreement for the implementation of theProvisions of the UN Convention on the Law of theSea of 10 December 1982 relating to theConservation and Management of Straddling FishStocks (UN Fish Stocks Agreement 1995). Thisagreement seeks to ensure the long-termconservation and sustainable use of straddling fishstocks and highly migratory fish stocks by requiringcoastal states and states fishing on the high seas tocooperate in implementing agreed measures. Thereare provisions to deter activities of fishing vessels thatundermine the effectiveness of internationallyagreed conservation measures. There are alsoprovisions to help build the capacity of leastdeveloped countries and small island nations towork towards meeting the agreement’s goals.Rotterdam Convention on the Prior InformedConsent Procedure for Certain HazardousChemicals and Pesticides in International Trade1998. The objective is to promote sharedresponsibility and cooperation in the internationaltrade of certain hazardous chemicals to protecthuman health and the environment. It focuses onpromoting environmentally sound use throughinformation sharing in all aspects of such hazardouschemicals. Trade in certain listed chemicals shouldbe on the basis of prior informed consent.Obligations of a party under any other existinginternational agreements are not changed by thisagreement. There are also provisions for providingtechnical assistance to countries if requested.Stockholm Convention on Persistent OrganicPollutants 2001. This convention aims to reduce oreliminate releases of persistent organic pollutantsinto the environment to protect human health andthe environment from such harmful substances. Theconvention makes provisions to prohibit or eliminatethe production, use, import, and export of thepollutants listed in Annex A (Elimination) andrestricts the production and use of those listed inAnnex B (Restriction). It calls for development ofnational plans to implement the agreement and alsoprovides technical assistance.WTO and NepalThe WTO was established to promote the free flowof trade and to ensure that trading rules are clear-cutand observed by all members; there is an acceptedmechanism within the WTO for settling all tradedisputes. It follows from the negotiations undertakenover many years in the GATT. WTO is not anenvironmental agency. However, a fewenvironmental issues are trade related in the sensethat environmental barriers could be erected bycountries to restrict trade and that trade could bedamaging to the environment. Such issues are withinthe domain of the WTO if members decide to seekits assistance. Further details about WTO areavailable on the WTO web site (www.wto.org ).Nepal was not a member of GATT, which wasstarted in 1947 following the Bretton WoodsConference of 1944, which established theInternational Monetary Fund and The World Bank,and discussed the need for an international tradeorganization. GATT’s focus was on reducing tariffsand trade barriers for promoting multilateral trade.Between 1986 and 1994 global trade talks werepursued under the Uruguay Rounds, which resultedin establishment of the WTO on January 1, 1995. InMay 1989 Nepal applied for membership in GATT,and on September 11, 2003 Nepal was invited tobecome a WTO member. The period in betweeninvolved submitting it’s Memorandum on ForeignTrade to be circulated within GATT, followed byvarious rounds of extensive questions from GATTand answers by Nepal before WTO grantedmembership.By joining the WTO, Nepal cannot bediscriminated against by another WTO member andit has the option to use the WTO’s dispute settlementprocedure, but there are also many obligations. Inthe area of services, Nepal has made broadcommitments in 11 service sectors. Regarding tariffs,Nepal has accepted average tariffs of 42% onagricultural products and around 24% on industrial<strong>18</strong>0 Environment Assessment of Nepal : Emerging Issues and Challenges
goods. Most imports will be within the duty range of10–20%. Nepal agreed to progressively implementthe Agreement on Customs Valuation in accordancewith the action plan, and full implementation willstart from January 1, 2007. Nepal will implement fullythe provisions of the Agreement on Sanitary andPhyto-sanitary Measures by January 1, 2007. Nepalwill prepare an action plan, to be implemented instages after it adopts the Food Act andimplementation of the Codex Alimentarium. It willestablish and operationalize a single enquiry point.Nepal will progressively implement the agreementon Technical Barriers to Trade in accordance with anaction plan and implement those provisions fully byJanuary 1, 2007. Nepal has agreed to incorporate allthe substantive provisions of the Trade-RelatedIntellectual Property Rights Agreement in its newIndustrial Property (Protection) Act to bepromulgated no later than January 1, 2006.Nepal has not become a member of theInternational Union for the Protection of New PlantVarieties. Nepal seeks to adopt an effective suigeneris system for the protection of plant varieties asprovided under Article 27.3 (b). In answeringquestions about the benefits to Nepal from WTOmembership, Shrestha (2004) points out that this willavoid the risks of non-membership, as well asprevent any unilateral decision by a trading partneragainst Nepal. He further points out that Nepal willneed to amend or enact 40 laws, although WTOrequired compatibility only in customs valuation,technical barriers to trade, sanitary and phytosanitarymeasures, and intellectual property rights.This was to be achieved over a period of four years.Regarding questions of import surges affectingdomestic products, he did not believe that this wouldoccur. Regarding subsidy for some of the primaryproducing sectors, some level of subsidy was stillpossible and there were provisions to address theproblems of the primary sector through investmentsin infrastructure, research, and human resourcesdevelopment. At present Nepal’s protection levelsare nowhere near the levels permitted by the WTO,so there is no question about WTO membershipreducing subsidies to farmers.Nepal–India Trade Treaty of 2002India has been and will continue to be Nepal’s mostsignificant trading partner because of Nepal’slandlocked position with India enclosing it on threesides. The new trade treaty is far more restrictivethan the earlier one and is likely to create manyuncertainties for Nepal. The most significantdevelopment has been that India has imposedquantitative restrictions on four items—vegetableghee, acrylic yarn, copper oxide, and zinc oxide—based on rules of origin, quota allocation, and nontariffbarriers (NTCS 2003).Nepal’s Own Trade RestrictionsAs a WTO member Nepal must inform WTO aboutany ban notifications coming into effect.(i) Nepal has banned the following products frombeing exported (FNCCI 2004):(a) Articles of archaeological and religiousimportance;(b) Conserved wildlife and related articles: wildanimals, musk, bile, and any part of wildanimals, snake skin, lizard skin;(c) Drugs, marijuana, opium, hashish;(d) Metals and jewellery: valuable metals andjewelry (exceptions permitted);(e) Articles of industrial importance, explosivematerials, and related materials used in theproduction of arms and ammunition;(f) Industrial raw materials: raw hides and skins(including dry salted), raw wool, allimported raw materials, parts and capitalgoods;(g) Other products: turmeric has been banned;and(h) Export to India: all goods imported fromcountries other than India.(ii) Nepal has banned the following products frombeing imported (FNCCI 2004):(a) Products injurious to health: narcotic drugs;liquor containing more than 60% alcohol;(b) Arms and ammunition and explosives(except under license): materials used inproduction of arms and ammunition, gunsand cartridges, caper without paper, arms,and other explosives;(c) Communications equipment (except underlicense);(d) Valuable metals (except under license);(e) Beef and beef products;(f) Plastic rags and recycled plastic goods;(g) 1<strong>18</strong> azo dyes harmful to the environment;and(h) Any other product designated by theGovernment.Chapter 12: Environment and Trade<strong>18</strong>1
Nepal’s Changing Pattern of Tradeand its Environmental AspectsCurrent trade with IndiaIn FY1966 Nepal’s total trade was only NRs 1157.1million, of which 98% was with India (Table 12.1).Exports amounted to only NRs 375.1 million or 33% oftotal trade. Ten years later in FY1976 exports to Indiadropped to 75% and imports from India declined to62% while overall trade more than doubled to NRs3,167.5 million. In FY1986 exports to India furtherdropped to 40% while imports from India decreasedto 43% and overall trade increased almost four-fold toNRs 12,419.2 million. This pattern of changecontinued during the next decade, and in FY1996exports to India were only 19%, and imports fromIndia 33% of total trade, which had increased byalmost seven times to NRs 94,335.6 million. However,on account of a highly favorable Nepal–India TradeTreaty in FY1997, exports to India continued toimprove, increasing from 24% in FY1997 to 59% inFY2004. A similar pattern was seen in imports, whichincreased from 2% of total trade in FY1997 to about41% in FY2004 (Table 12.1).The structure of exports has undergone majorchanges in recent years, shifting to manufacturedgoods, although trade with India still consists mainlyof primary products and some processed materials.The trade balance has persistently remained againstNepal’s favor; trade deficit/gross domestic product(GDP) ratio was 14% in FY2002 (Table 12.2). The totaltrade/GDP ratio increased from 22% during the 1980sto 41% in the latter 1990s. The rapid increase in tradehas been attributed largely to the trade liberalizationpolicies pursued by the Government since the early1990s. The International Monetary Fund TradeRestrictiveness Index for Nepal was 2, with scores of1–4 indicating an open regime and scores of 7–10indicating a restrictive regime (NDF 2003). Differenttrade-related ratios are shown in Table 12.2.Table 12.3 shows the major types of exports toIndia in FY2003 and FY 2004. Vegetable ghee toppedthe list, followed by jute goods and jute-relateditems, textiles, forest products including herbs,agricultural products, and miscellaneousmanufactured items. Toothpaste and soapaccounted for over 80% of the latter. There has beena great deal of fluctuation in the items from year toyear. For example, some items exported in one year(like Chyawanprash) do not show up in next year’strade. Decreases in export value have been seen inmany items, including vegetable ghee and 26 otherimportant exports, although the total value of exporttrade has registered an <strong>18</strong>% increase. The increasehas been due to items such as wheat flour, hessiansacking, cattle feed, hides and skin, polyester yarn,readymade garments, and a few other items. Thelargest increases were in toothpaste and readymadegarments.Table 12.4 shows the major imports from Indiafor two fiscal years. There was an overall increase inimport value of about <strong>18</strong>%. Petroleum products werethe single largest imported item followed by textiles,cement, medicines, vehicles and spare parts, andmachinery and parts. There was a decrease in some25 imports between FY2003 and FY2004. The majordecreases were in textiles and cement. About 16imports registered increases, the major ones beingchemicals, vehicles and spare parts, machinery andparts, and petroleum products.Current Trade with Overseas CountriesNepal’s overseas trade was only NRs 23 million inFY1966 but increased to NRs 66,254 million threedecades later. Thereafter it registered an annualgrowth rate of 10% until FY2001, when it reached NRs100,100 million. After this it declined significantly toalmost the level of the 1980s. It increased slightlyduring FY2004 to NRs 78,969 million. In FY2004 themajor overseas exports were readymade garments,followed by woolen carpets, woolen and pashminashawls, and handicrafts. Other exports includedhides and goat skins, tea, pulses, cardamom (large),sugar, silverware and jewelry, towels, Nepali paperand paper products, and wooden goods (Table 12.5).The top ten countries for Nepal’s exports are shownin Table 12.6. India, the United States (US), andGermany are the major importers of Nepali exportswith shares of 57%, <strong>18</strong>%, and 6.6%, respectively, inFY2004. Table 12.7 shows the top ten countries thatare sources of imports to Nepal. India, Singapore,and the People’s Republic of China were the majorsuppliers of Nepal’s imports with shares of 59%, 6.3%,and 3.9%, respectively, in FY2004.Environmental Dimensions of TradeInternal TradeAlthough there has not been any reference to internaltrade in this chapter so far, clearly in the context ofenvironmental impacts, this cannot be neglected.The problem is that domestic trade, its growth andimpact, and so on have not been studied to date.There are no records of any type regarding internaltrade.If we look at the national accounts, trade hasbeen lumped together with restaurants and hotels,although the latter two will be fairly small comparedwith the value of domestic trade. This sectorcontributed 11.6% of GDP and was second only to<strong>18</strong>2 Environment Assessment of Nepal : Emerging Issues and Challenges
Table 12.1: Direction of Foreign Trade (NRs million)Item FY1966 FY1976 FY1986 FY1996 FY1997 FY1998Export (FoB) 375.1 1,<strong>18</strong>5.8 3,078.0 19,881.1 22,636.5 27,513.5India370.5 893.7 1,241.1 3,682.6 5,226.2 8,794.4(98.8) (75.4) (40.3) (<strong>18</strong>.5)(23.5) (32.0)Other countries4.6 292.1 1,836.9 16,198.5 17,410 <strong>18</strong>,719.1(1.2) (24.6) (59.7) (81.5)(76.9) (68.0)Imports (CIF) 782 1,981.7 9,341.2 74,454.5 93,553.4 89,002.0India763.5 1,227.1 3,970.9 24,398.6 24,853.3 27,331.0Other countries(97.6 )<strong>18</strong>.5(2.4)(61.9 )75.6(38.1)( 42.5)537.03(57.5 )(32.8)50,055.9(67.2)(26.6)68,700.1(69.3)(30.7)61,670(69.3)Trade balance -4,0619 -795.9 -6,263.2 -54,573.4 -7,016.9 -61,488.5India-393 -333.4 -2,729.8 -20,716.0 -19,627.1 -<strong>18</strong>,536.6(96.6) (41.9) (43.6) (38.0)(27.7) (30.1)Other countries-13.9 -462.5 -3,533.4 -33,857.4 -51,289.8 -42,951.9(3.4) (58.1) (56.4) (62.0)(72.3) (69.9)Total volume of trade 1,157.1 3,167.5 12,419.2 94,335.6 116,<strong>18</strong>9.9 116,515.5India1,134.0 2,120.8 5,212.0 28,081.2 30,079.5 36,125.4Other countries(98.0)23.1(2.0)(67.0)1,046.7(33.0)(42.0)7,207.2(58.0)(29.8)6,625.4(70.2)(25.9086,110.4(74.1)(31.0)80,390.1(69.0)Share exports/in total a 32.7 37.4 24.8 21.1 19.5 23.6Share imports/i n total a 67.3 62.6 75.2 78.9 80.5 76.4GDP (at factor cost / current price) 248,913 280,513 300,845Item FY1999 FY2000 FY2001 FY2002 FY2003 FY2004Export (FoB) 35,676.3 49,822.7 55,654.1 46,944.8 49,930.6 52,723.7India12,530.7 21,220.7 26,030.2 27,956.2 26,430.0 31,244.3(35.1) (42.6) (46.8) (59.6)(52.9) (59.3)Other countries23,145.6 28,602.0 29,623.9 <strong>18</strong>,988.6 23,500.6 21,479.4(64.9) (57.4) (53.2) (40.4)(47.1) (40.7)Imports (CIF) 87,523.3 108,504.9 115,687.2 107,389.0 124,352.1 139,142.3India32,119.7 39,660.1 45,211.0 56,622.1 70,924.2 81,651.9Other countries(36.7)55,405.6(63.3)(36.6)68,844.8(63.4 )(39.1)70,476.2(60.9)(52.7)50,766.9(47.3)(57.0)53,427.9(43.0)(58.7)57,490.4(41.3)Trade balance -51,849.0 -58,682.2 -60,033.1 -60,444.2 -74,421.5 -86,4<strong>18</strong>.6India-19,589.4 -<strong>18</strong>,439.4 -19,<strong>18</strong>0 -28,665.9 -44,494.2 -50,407.6(37.8) (31.4) (32) (47.4)(59.8) (58.3)Other countries32,260 -40,242.8 -40,852.3 -31,778.3 -29,927.3 36,011.0(62.2) (68.6) (68) (52.6)(40.2) (41.7)Total volume of trade 123,201.6 158,327.6 171,341.3 154,333.8 174,282.7 191,866India44,650.4 60,880.8 71,241.2 84,578.3 97,354.2 112,896.2Other countries(36.2)78,551.2(63.8)(38.5)97,446.8(61.5)(41.6)100,100.1(58.4)(54.8)69,755.5(45.2)(55.9)76,928.5(44.1)(58.8)78,969.8(41.2)Share exports/in total a 29.0 31.5 32.5 30.4 28.6 27.5Share imports/i n total a 71.0 68.5 67.5 69.6 71.4 72.5GDP (at factor cost / current price) 342,036 379,488 410,789 422,301 454,935 494,882CIF = cost insurance freight, FOB = freigh t on board, GDP = gross domestic productNote: values in brackets indicate percentages; the fiscal year (FY) of the Government of Nepal ends on 15 July. Fiscal Year before a calendar year denotes the yearwhich the fiscal year ends, e.g. FY2002 ends on 15 July 2002.Source: FNCCI (2004)inChapter 12: Environment and Trade<strong>18</strong>3
Table 12.2: Trade/ GDP RatiosFY1981– FY1986– FY1991– FY1996– FY2001–IndicatorFY1985 FY1990 FY1995 FY2000 FY2002Total trade/GDP ratio 21.9 23.7 33.6 40.7 38.9Export/GDP ratio 4.9 5.3 9.0 10.1 12.3Export growth rate (%) 23.6 14.4 31.6 24.5 17.1Import/GDP ratio 17.0 <strong>18</strong>.4 24.6 30.6 26.6Import growth rate (%) 17.2 <strong>18</strong>.9 28.4 11.7 16.4Trade deficit/GDP ratio 12.1 13.1 15.7 20.5 14.3Current account deficit/GDP ratio 3.0 6.2 6.2 4.5 2.7Export/import ratio 29.2 28.8 36.8 33.7 46.3GDP = gross domestic productSource: NDF (2004)Table 12.3: Selected Exports to India (value in NRs ‘000)CommodityFY2003 FY2004FY2003 FY2004 %% Change Commodity(2059/60) (2060/61)(2059/60) (2060/61) ChangePulses 880,400 575,000 (34.7) Rosin 221,600 138,200 (37.6)Ghee 54,600 36,600 (33.0) Brooms 102,700 65,300 (36.4)Herbs 111,900 79,100 (29.3) Noodles 309,700 259,700 (16.1)Ginger 315,400 263,500 (16.5) Biscuits 25,100 15,500 (38.2)Dried ginger 108,400 73,000 (32.7) Marble slabs 28,600 36,900 29.0Linseed 45,800 33,400 (27.1) Cattle feed 405,900 544,100 34.0Cotton seed 300 200 (33.3) Barns 62,800 37,500 (40.3)Fruits 2,400 700 (70.8) Oil cakes 311,100 303,700 (2.4)Vegetables 43,000 17,000 (60.5) Hides and skin 248,500 332,300 33.7Wheat flour 7,100 32,200 353.5 Toothpaste 1,002,800 1,478,800 47.5Vegetable ghee 3,812,300 2,959,000 (22.4) Polyester yarn 656,900 1,114,500 69.7Jute goods 1,899,000 1,882,600 (0.9) Readymade 399,200 626,200 56.9Hessian 44,200 143,500 224.7 Handicraft goods 44,800 25,600 (42.9)Sacking 855,900 1,056,500 23.4 Veneer sheets 3,800 5,100 34.2Twine 998,900 682,600 (31.7) Toilet soap 469,200 539,100 14.9Live animals 62,500 40,400 (35.4) Chyawanprash 525,900 0 0Rice barn oil 210,000 194,700 (7.3) Hajimola 217,200 289,900 33.5Turpentine 24,700 15,700 (36.4) Kachha 11,200 8,200 (26.8)Cinnamon 4,700 6,300 34.0 Iron scrap 7,000 3,700 (47.1)Cardamom 469,600 449,500 (4.3) Bristle 2,100 500 (76.2)Catechu 145,400 159,500 9.7 Others 12,986,900 <strong>18</strong>,460,700 42.1Stone and sand <strong>18</strong>9,500 140,400 (25.9) Total 28,329,000 33,126,900Note: Trade with India for FY2003 is rev ised, and is provisional for FY 2004.Source: Trade Promotion <strong>Centre</strong> (2004)agriculture in FY1995. In FY2004 its share was 10.4%;it declined to third position after agriculture andfinancial and real estate. There can be little doubtabout its significant role in the economy, andsomething this big will undoubtedly have direct andindirect environmental effects (FNCCI 2004).Nepal’s main environmental problems aredeforestation, loss of biodiversity, soil erosion, air andwater pollution, and in some areas solid wastedisposal. In selected areas one also encounterspesticide problems (Banskota 2005). In the history ofNepal, economic integration has moved at a slowerpace than political integration primarily becausetransport and communications, so vital for thedevelopment of trade, have expanded relativelyslowly. Even now there are parts of Nepal accessibleonly by air or on foot. However with increasingeconomic integration, interregional trade follows forthe same reasons as international trade—relativecomparative advantages. In Nepal the trade linksbetween the Hills and the Terai have been verysignificant with the Terai providing firewood, timber,and many agricultural products to the Hills—especially to the ever-growing market of Kathmandu<strong>18</strong>4 Environment Assessment of Nepal : Emerging Issues and Challenges
Table 12.4: Selected Imports from India (Value in NRs ‘ 000)CommodityFY2003(2059/60)FY 2004(2060/61)% ChangeLive animals 404,000 204,800 (49.3)Textiles 4,<strong>18</strong>6,100 3,176,900 (24.1)Readymade garments 444,700 410,900 (7.6)Raw cotton 91,400 89,300 (2.3)Thread 1,105,800 985,500 (10.9)Fruits 284,500 241,500 (15.1)Vegetables 772,800 638,700 (17.4)Milk products 508,800 427,100 (16.1)Tea 39,500 36,000 (8.9)Coffee 37,000 40,500 9.5Cumin seed and pepper 199,300 197,800 (0.8)Salt 713,300 607,300 (14.9)Sugar 119,500 12,600 (89.5)Rice 744,900 515,900 (30.7)Pulses 539,300 598,500 11.0Wheat 216,500 269,700 24.6Tobacco 534,300 563,200 5.4Chemicals 1,906,600 2,526,200 32.5Enamel and other paints 111,200 121,500 9.3Cement 2,934,700 2,1<strong>18</strong>,700 (27.8)Pipe and pipe fittings 128,400 123,100 (4.1)Sanitary wares 126,700 121,700 (3.9)Bitumen 54,300 168,900 211.0Electrical equipment 997,500 1,065,500 6.8Medicines 3,225,700 3,329,600 0.2Writing and pr inting paper 431,200 404,400 (6.2)Books and magazines 304,500 327,200 7.5Cosmetic goods 409,700 406,000 (0.9)Chemical fertilizers <strong>18</strong>3,500 562,700 206.6Insecticides 145,800 136,100 (6.7)Hand tools 67,900 57,900 (14.7)Agri-equipment and parts 689,900 477,400 (30.8)Vehicles and spare parts 3,857,800 4,923,900 27.6Tires, tubes and flaps 252,200 242,800 (3.7)Coal 695,400 775,300 11.5Machinery and parts 2,571,800 3,262,600 26.9Glass sheets and glassware 439,800 444,900 1.2Radios, televisions, decks & parts 128,600 87,900 (31.6)Shoes and sandals 87,700 67,600 (22.9)Wire products 162,700 99,200 (39.0)Others 21,257,300 30,617,300 44.0Total without petroleum products 52,112,600 61,484,600 <strong>18</strong>.0Petroleum products <strong>18</strong>,811,600 20,167,300 7.2Total 70,924,200 81,651,900 15.1Note: Trade with India for FY 2003 is revised, and is provisional for FY2004.Source: Trade Promotion <strong>Centre</strong> (2004)Chapter 12: Environment and Trade<strong>18</strong>5
Table 12.5: Percentage Share of Major Commodities in Nepal'sOverseas Exports in FY2004 (2060/61) (NRs ‘ 000)Commodity Unit Quantity Value Share in %Readymade garments pcs. 38,994,326 9,552,544 45.6Woolen carpet s sq.m 1,648,9<strong>18</strong> 5,461,301 26.1Woolen and pashminagoods1,473,675 7.0Handicrafts 427,<strong>18</strong>9 2.1Sugar t 9,250 404,165 1.9Nepali paper & products 348,482 1.7Silverware and jewelry 321,569 1.5Pulses (lentils) t 7,590 294,554 1.4Hides and goatskin sq.ft. 6,627,864 286,117 1.4Towels 249,393 1.2Cardamom (large) t 1,111 228,963 1.1Tea t 1,002.2 106,897 0.5Wooden goods 46,810 0.2Other 1,740,002 8.3Total 20,941,661 100.0pcs = pieces, sq.ft. = square foot, sq.m = square meter, t = metric to nSource: Trade Promoti on <strong>Centre</strong> (2004)Table 12.6: Major Trading Partners of Nepal : Exports (NRs ’000)Country FY2002 FY2003 FY2004India 27,956,200 26,430,000 31,244,300United States 9,377,832 12,686,537 9,695,977Germany 4,043,2<strong>18</strong> 3,555,327 3,567,036United Kingdom 808,751 1,070,737 1,677,085Italy 566,557 530,869 589,370France 473,472 453,961 581,762Canada 305,978 383,651 546,403Japan 492,833 474,247 525,601Bangladesh NR 411,335 421,308Switzerland 382,823 NR 306,255Portugal NR 414,680 NRBelgium 295,140 NR NRSubtotal 44,702,804 46,411,344 49,155,097Other countries 2,683,984 3,599,778 5,261,517Grand total 47,386,788 50,011,122 54,416,614NR = not ranked in that year , only top ten countries are listed.Source: Trade Promotion C entre (2004)Table 12.7: Major Trading Partners of Nepal: Imports (NRs ’000)Country FY2002 FY2003 FY2004India 56,622,100 70,924,200 81,651,900Singapore 7,346,919 9,039,197 8,698,647China, People’s Rep. of 4,315,803 4,760,342 5,433,815Thailand 3,278,165 2,988,929 4,320,169Malaysia 4,8<strong>18</strong>,356 4,009,640 3,676,428Indonesia 2,877,654 3,976,734 3,253,785Korea, Republic of 2,500,974 3,380,348 3,080,644Saudi Arabia 3,654,905 2,363,956 2,547,901Germany NR 2,278,356 1,977,896Japan NR NR 1,690,396Hong Kong 2,461,194 2,276,995 NRUnited States 2,525,603 NR NRSub total 90,401,673 105,998,697 116,331,581Other countries <strong>18</strong>,233,128 22,229,437 22,421,154Grand Total 108,634,801 128,228,134 138,752,735NR = not rank ed in that year, only top ten countries are listed.Note: Trade with India for FY2002 and 2003 are revised, and is provisional for FY2004.Source: Trade Promotion <strong>Centre</strong> (2004)Valley and its satellite towns. This largedemand and the consequent trade haveresulted in extensive deforestation of Teraiforests, some in very critical ecosystemssuch as the Churia and the wetlands. Alongwith deforestation, the rich biodiversity ofthe Terai’s subtropical forests has alsodiminished significantly. Roughly 4–5% ofNepal’s exports to India consist of nontimberforest products and herbs, andthere is concern about unsustainableharvesting of these products (Dhakal 2004,Tiwari et al. 2004). Another major impact ofthis deforestation has been the widespreadflooding of the Terai plains causingextensive damage to crops and agriculturalland, frequent changes in river courses,bank erosion, and debris deposits. Some ofthis occurs naturally, but the impact ofanthropogenic factors has increasedconsiderably (Banskota 2005) as a result ofthe rapid increases in population,deforestation, and expansion inagricultural land. The argument here is notto suggest that trade is bad. However, itdoes have environmental effects thatshould be carefully studied.Trade involves transport, and intoday’s world motorized transport is usingfossil fuel that adds to the carbon dioxidein the atmosphere and releases harmfulgases. A recent study has highlighted someof the health effects in Kathmandu (CENand ENPHO 2003). The time has come tobetter understand the environmentaleffects of increasing domestic trade andidentify possible corrective measures.International TradeInternational trade has grown rapidly overthe years with the trade/GDP ratio almostdoubling in two decades. Today it stands at40%. However, other smaller nations thatdepend on trade have ratios as high as 80%(NTCS 2003), suggesting that there arefurther potentials for expanding trade.Nepal imports many environmentallysensitive products such as petroleumproducts, insecticides, and chemicalswhich are critical inputs into variousproduction processes. These need to becarefully handled. Increasing use of fossilfuel is now seen as the main factor behindthe deterioration of air quality inKathmandu Valley (CEN 2003); this isalready beginning to have many health<strong>18</strong>6 Environment Assessment of Nepal : Emerging Issues and Challenges
effects. Kathmandu Valley has a specialenvironmental problem of temperature inversion,due to which air pollutants do not disperse veryeasily (Tuladhar 2003). Unleaded petrol wasintroduced in the country only recently, and there isconcern about adulteration in the fuels available. Ifimproving the quality of fossil fuel to minimize thepresence of harmful substances is one aspect, thereis also a need for the carriers to be environmentallyfriendly. Many of the vehicles are in a very poor state,and these are responsible for a lot of the pollution.Another major problem is related to imports ofpesticides and toxic and harmful substances. Theirproper handling, use, storage, and transport arerelatively unknown at present. Some studies on theuse of pesticides have shown that few precautionshave been taken, and that pesticides could becomea public health hazard at any time (Pokharel 2003).While developed countries are introducing stringentregulations on many harmful and toxic chemicals,there is little monitoring of what is happening inNepal. Nepal’s weak monitoring and policingcapacity could make it an attractive candidate fordumping harmful and chemical substances, whosetoxicity may only become known after they are in thecountry. This is an important area and needs to begiven serious attention in light of the long and highlyporous open border with India.What about environmentally sensitive exports?So far Nepal has been fortunate because no majorexport consignment has been rejected onenvironmental grounds. Environmental standards inthe European Union (EU) and the US have becomehighly stringent and some aspects of this arediscussed in the next section. Discussions withdifferent experts 1 , have identified several current andlikely problems regarding exports to the EU:(i) Exports of woolen carpets to Germany wererequired (voluntarily) to have ecolabels.(ii) India imposed quarantine restrictions onginger exports from Nepal, and exports werefrequently stranded at the border because ofthe delay by India on pest risk analysis. Nepalcould not provide the necessary data to Indiain time for the analysis. Now the quarantineproblem on ginger has been solved.(iii) Italy recently returned a shipment ofChywanprash because of the presence oftoxic substances.(iv) Some concerns have been expressed aboutpesticides and other prohibited residues intea samples from Nepal.(v) Nepal honey is not in the open list of the EUbecause of an insufficient residuemonitoring plan and lack of legislation inNepal to control the quality of honey. Further,the considerable production by indigenoushoneybees is not recognized as “honey”under EU directives.There may be other cases, but very little of thisknowledge is in the public domain. Although the listis small so far, the lists of prohibited items in the USand the EU are very large, and care must be taken toensure that farmers and producers from Nepal arewell aware of these requirements. So far Nepal’sexports have been limited and therefore theproblems are also small. Some positivedevelopments in this respect have been the award ofOeko-Tex 100 ecolabel certificates to five Nepaliexporters to EU countries. There have also beenefforts to promote cleaner production measures inindustrial units, some of which are exporters(Adhikari 2004). Similarly the practice of organicfarming and integrated pest management is alsobeing encouraged. While these are positive signs,boosting Nepal’s future exports will require majorefforts to ensure that these are safe for theenvironment and humans, and meet the emergingstandards in different parts of the world.Trade and Environment-relatedExperience of Other CountriesKirchbach (ITN 2001) highlights a number ofinteresting points regarding trade-relatedenvironmental barriers. He points out that of 4,917products examined in world trade, only 24% did notface some kind of environment-related trade barrierin 2001. While the number of products is large, theirvalue as a percentage of total trade is only 13%. Eitherexporters are focusing their attention on restriction offree markets or these are mostly low-value productsof agricultural, forest, or mineral origin. About 90% ofthe barriers are concentrated in 44 products. Themost common ones are food items, plants, bulbs andcut flowers, boneless bovine cuts, large automobiles,trucks, smaller automobiles, motor vehicle parts,coniferous timber, natural gas, footwear, medicine,telephones, and wildlife products. Apart from straightbans on imports, these barriers can take manyforms—surcharges, internal taxes, advance paymentrequirements, transfer delays, quality control, priorauthorization, quotas, obligations to return usedproducts, and so on. Exports from less developedcountries have been subjected most frequently toenvironment-related trade barriers.What are the reasons for these barriers? Basedon a review of the provisions in the WTO rules, as1Dr. Krishna P. Pant, Senior Economist, Ministry of Agriculture and Cooperatives; Dr. Deb B. Shakya, Agro Enterprise Center, Federation of Nepalese Chambers ofCommerce and Industry (FNCCI); Mr. Ratnakar Adhikari, Executive Director, South Asia Watch on Trade, Economics and Environment (SAWTEE)Chapter 12: Environment and Trade<strong>18</strong>7
well as other provisions in specific countries orregions, a number of reasons have been identified.Precautionary PrincipleRio Principle 15 points out that where there arethreats of serious or irreversible damage, lack ofscientific certainty shall not be used as a reason forpostponing cost effective measures to preventenvironmental degradation (UN 1992). The principlewas to protect the environment and public healtheven when scientific information was consideredinsufficient regarding the potential impact of aproduct or technology. It is clear that even theslightest suspicion can result in the use of this principle.Opponents of this argue that it can be easily usedas a trade barrier. Many countries have already usedthis principle in the regulation of biotechnology andgenetically modified foods, hazardous chemicals,and invasive and alien species.Sanitary and Phyto-sanitary MeasuresSanitary and Phytosanitary Measures set out thebasic rules for food safety and animal and planthealth standards in international trade (WTO 1998).Countries can also set their own standards, whichmust be scientifically based and should not bearbitrary or discriminatory between countries wheresimilar conditions prevail. Critics argue that becauseof its technical complexity, this has been very difficultto challenge and could be a very effective tradebarrier in the future. Another point is that standardscannot be the same everywhere because of widedifferences in living environments, and adjustmentsneed to be made for this.Technical Barriers to TradeTechnical barriers to trade deal with GATT rulesgoverning the use of product standards. TheAgreement gives countries the flexibility to takenecessary measures to protect the environment,provided these are not discriminatory or traderestrictive (Jha 1999). The Agreement covers alltechnical regulations, voluntary standards, andprocedures to ensure that these are met, exceptwhen these are sanitary and phyto-sanitary-relatedas defined by the Agreement. The two Agreementshave many common elements.Production and Process MethodsProducts cannot be discriminated against based onthe manner in which they were produced. Forinstance, timber produced by clear felling should notbe discriminated from timber produced bysustainable forest management. However, someexceptions are permitted. One very prominent caseregarded the dolphin-shrimp-turtle case brought tothe WTO Panel by some member countries againstthe restrictions imposed by the US (Jha 1999).EcolabelsEcolabels are a method of providing information tothe consumer that the product is environmentallysafe in its production and contents. This is now beingincreasingly used as a requirement for enteringmarkets in the US, EU countries, and Japan.Mandatory labeling of genetically modified foods isrequired by EU, Japan, and Australia, while the USand Canada have complained that such labelingviolates WTO rules (Chaturvedi and Nagpal 2003).All the developed countries have developedtheir own ecolabels for textiles, and developingcountries are encouraged to use these ecolabels iftheir products are to be competitive in thesemarkets. The use of ecolabels is voluntary butbecomes unavoidable if others are using it in theirproducts. Ecolabels have raised many other issuesregarding establishment of standards, certification,credibility of certifying authority, competentlaboratories and their staff, and harmonization ofstandards among countries that have also beenraised under sanitary and phyto-sanitary measuresas well as technical barriers to trade (UNDPundated).SubsidiesWTO agreements have attempted to lower subsidiesacross the board. While reducing subsidies onmanufactured products has been accepted,subsidies in agriculture and fisheries have become ahighly contentious issue in the WTO. Developingcountries have been particularly concerned aboutthe high level of subsidies provided to agriculture inthe EU and the US (Bardhan 2001).InvestmentsOne objective of liberalization is to attract foreigncapital. However if this is done without anyenvironmental safeguards, it could be very damagingto the local environment as well as unfair to otherswho have instituted industrial environmentalstandards. One recent study (Busse 2004) indicatedthat there is no rush of industries to pollution havens.The only exception may be the iron and steelindustry.ServicesThere has been a move within WTO to pressurecountries to liberalize service sectors such as<strong>18</strong>8 Environment Assessment of Nepal : Emerging Issues and Challenges
finance, insurance, education, media, transport,energy, health, water and sanitation, waste disposal,and others. The developed countries have manypollution abatement services and technologies tosell, and this move is seen by some people indeveloping countries as a way of promoting exportsfrom the developed countries. While this may truefor some of the services, it may not be applicable toothers and a case by case evaluation is necessary.Intellectual PropertyThis has been one of the most controversial anddifficult provisions under the present WTOagreement. Developments in biotechnology havepushed the developed countries to press for strongerprotection of intellectual property rights. Developingcountries have lacked appropriate laws and thepressure is on to prepare needed rules andregulations. However, there are a number of seriousconcerns here such as (i) overlooking the collectivenature of ownership of traditional knowledgedeveloped over many generations and the possibilityof foreclosing the entry of the public sector in thefuture, (ii) loss of biodiversity and adapted localvarieties impoverishing the genetic pool, and (iii)promoting a very western, developed countryfriendly legal regime with respect to intellectualproperty rights. The developed countries have beensomewhat unprepared for this reaction, as theiragenda requires not only the development of relatedlaws but also the capacity to enforce such policies(Boyer 2001, Chatuvedi 2003, Adhikari 2004).Problems of Access to InformationInformation regarding new environmental standardsby the importing countries is often delayed,inadequate, distorted, and even non-existent at thetime of the export. Exporters have been caught bysurprise without sufficient time to prepare andrespond appropriately. The technical standards arevery complex in some cases, and these may not beunderstood. Even when understood the exportingfirm may lack the capacity to do anything about it.This lack of knowledge and capacity to respond is areal problem for many of the small- and mediumsizedexporters in many developing countries.Heterogeneous Standards and RegulationsThere appears to be a lack of uniformity of standardsbetween countries for the same export. The cost ofkeeping up with the changes has been escalating.There is competition between organizations forcertification and labeling for the same environmentalstandard. This may be helpful in reducing costs tosome extent, but developing countries may faceproblems in choosing the acceptable ones. Some ofthe standards have been designed with the objectiveof creating new markets for cleaner productiontechnologies or methods (Andrew et al. 2004). Thereare discussions about harmonization of standards,procedures for conformity assessments, and thepossibility of establishing equivalence agreements.However this is a relatively new area and manyaspects are still in their early stages of development.Boyer (2001) points out that EU packaging andlabeling standards including regulation on recycledcontent of paper are so high that most developingcountries’ exports will not be able to satisfy them. Hemaintains that although ecolabeling is voluntary itresults in market segmentation; use of InternationalStandards Organization (ISO) certification andexpertise is very costly for most small exporters fromdeveloping countries.Chaturvedi and Nagpal (2003), referring toIndia’s experience with the EU, point out thatpermitted levels of additives and pesticides are veryhigh, including emission standards for machines. Hepoints that some EU importers have introduced“socially responsible trading” to reflect status ofemployees, working environment, facilities and theneed to fulfill a new “code” for exporters. Similarly,the quarantine restrictions for fresh fruits andvegetables have become highly stringent. There is aban on some types of antibiotics and chemicals. Anytrace of DDT, aldrin, or heptachlor results in rejectionof the export. Some dyes are banned in textiles andleather. There are restrictions on the levels offormaldehyde although there is controversy withinthe EU in this regard. Referring to Japan, Chaturvedifurther points out that Japanese food sanitation lawsprohibit imports of many citrus fruits. There is a zerotolerance law on insects, plant quarantineprocedures are very lengthy, and preshipmentinspection is possible but the cost is very high.Moving to the US, Chaturvedi (2003) provides someinformation on the interventions made by the UnitedStates Food and Drug Administration for detention ofimports from South Asian countries. The majorreasons for preventing entry of some exports wererelated to food additives, pesticide residues, andpresence of heavy metals, moulds, microbiologicalcontamination, decomposition, filth, low acidcanned food, labeling, and a few others. The mostimportant categories were filth (article appears toconsist in whole or in part of filthy, putrid, ordecomposed substances), violation of labelingrequirements, and microbiological contamination(presence of bacteria such as salmonella andshigella).Chapter 12: Environment and Trade<strong>18</strong>9
Future Implications for NepalIncreasing trade under stringentenvironmental conditionsThere is little doubt about the increasing value oftrade, both internally and externally, but trade cannotbe a panacea for all problems of underdevelopmentand how trade impacts different development goalsneeds to be studied continuously over time. Onlythen can appropriate policies be targeted to dealwith specific problems. The Nepalese economy hasbenefited immensely from growing internaleconomic integration permitting specialization andtrade between regions. It has also benefited fromincreasing external trade, which has made rapidstrides in recent times. However, Nepal’s trade islopsided from the point of view of limited exports,few markets, and a rapidly widening trade gap. Inaddition, due to increasingly stringent environmentalstandards by developed countries, Nepal’s exportsface serious market access problems. There is alsotough competition in some of the exports from otherSouth Asian countries that have many advantagesover Nepal.Improving quality of tradeWhile international trade is important and for manycommodities domestic markets may not providecomparable scales of demand, the poor quality ofdomestic trade is often reflected in internationaltrade as well. Not much importance has been givento the quality of domestic trade. In fact many of thesanitary and phyto-sanitary conditions can be evenmore appalling in domestic markets. Increasinginternal and international trade means greaterquality control at home also.Better understanding and awareness ofWTO requirementsNepal is a member of WTO and there is little point indebating this issue; now better understanding aboutwhat is expected from the traders in Nepal is needed.There are many ongoing discussion areas about this,some of them contentious. Nepal must do itshomework and prepare for each discussion well inadvance to negotiate in the country’s best interests.Improving technical standards andquality assurancesShrestha and Shakya (2002) and Sharma and Karkee(2004) both emphasize this point. The technicalrequirements for quality assurance have nowreached a level where many exporters not only lackthe skills, expertise, and the infrastructure to meetthem but do not really know what is required andwho to turn to for help. Cost considerations areanother set of critical issues. Experience inBangladesh and India, particularly in the fishingindustry, has revealed that compliance with qualitystandards not only requires substantial capitalinvestment but can also entail very high annualoperating expenses (Chaturvedi and Nagpal 2003).The Nepal Bureau of Standards and Metrology isthe national body for the development of Nepalesestandards, adoption of international standards,providing quality assurance, certification, inspection,testing, accreditation, and harmonization procedureswith the standards in Nepal’s exporting regions.Nepal has some 600 standards, but only five relatedto safety and public health in export trade aremandatory—the remainder are voluntary (Shresthaand Shakya 2002). Standards acceptability abroadand their enforcement domestically will be a majorchallenge for export efforts in Nepal as all the majorexporting countries are imposing increasinglystringent standards. The establishment of a SouthAsian Regional Standards Organization is a verypositive step, and Nepal should work with others tomake this organization well recognized andaccepted internationally.Compliance with MultilateralEnvironmental AgreementsNepal has signed and ratified many differentMultilateral Environmental Agreements. Some likeCITES and the Convention on Biodiversity have welldefinedfocal points, but others need stronger actionand monitoring. While multilateral environmentalagreements related international organizations willnot have the same effect as the WTO, environmentalstandards are expected to get much stiffer in thedeveloped countries (Chaturvedi 2003), forcingcountries like Nepal to take stronger action on thedomestic front as well. Developing the institutionalcapacity and resources to move ahead on thedifferent multilateral environmental agreementsneeds stronger attention.Trade-related Intellectual PropertyRightsThe five-year period allowed for countries like Nepalto introduce legislation and other measures to meetthe provisions of Trade-related Intellectual PropertyRights (TRIPS) is already at hand. Nepal has onlyrecently announced new laws regarding patents,copyrights, and similar. However, the broaderimplications of this agreement are still hotly debatedboth nationally and internationally (Boyer 2001,190 Environment Assessment of Nepal : Emerging Issues and Challenges
Chaturvedi 2003, Adhikari 2004). The long-termimpacts on national biodiversity, genetic pool, localfood security, and protection of local innovation andtraditional knowledge are still being discussed. Withthe collapse of American leadership on internationalenvironmental issues, Europe now leads inpromoting new environmental standards (Boyer2001) and it is not clear how this will proceed.Adequate capacity and resources for research,analysis, information, local registration, andmaintaining a local registry are important practicalaspects for the future. This subject is still developing,and Nepal must do a significant amount ofhomework as it shares a common endowment andheritage in genetic resources, medical tradition, andagricultural practices with many South Asiancountries.Trade Environment SurveillanceWe know very little about the complex relationshipbetween trade and environment. Interest in thissubject grew only after the WTO agreement, whichmade it necessary to improve understanding of thetechnical aspects of trade and environment.Ignorance in this respect can be very costly in termsof the loss of export markets. Understandingdomestic trade and its environmental aspects alsoneeds to be significantly improved. In the long runthe need to improve domestic standards is veryapparent, especially regarding agricultural products.Nepal is a signatory to many different types of tradingregimes—bilateral, regional, and international. It isnot yet clear how each of these arrangements isserving the interests of the nation and what impacteach has on the environment. Unless trade andenvironment are closely monitored in their differentsettings, our capacity to negotiate better economicand environmental deals may be severelycompromised in the future.BibliographyAdhikari, D.R. 2004. “From Pollution to Responsibility.” InThe Kathmandu Post. 6 June. EnvironmentKathmandu.Available:http://www.environmentnepal.com.np/articles_d.asp?id=255Adhikari, R. 2004. “TRIPS Agreement: Implications forBiodiversity and Poverty in Nepal.” Kathmandu:South Asia Watch on Trade, Economics andEnvironment (SAWTEE)Ahmed, S., and Z. Sattar. 2004. “Impact of TradeLiberalization: Looking at the Evidence.” Economicand Political Weekly, 39(36): 4059–67.Andrew, D., K. Dahou, and R. Steenblik. 2004. “AddressingMarket Access Concerns of Developing CountriesArising From Environmental and HealthRequirements: Lessons From National Experiences.”OECD Trade Policy Working Paper, No. 5, Paris:Organisation for Economic Co-operation andDevelopment (OECD). Available:http://webdomino1.oecd.org/olis/ 2003doc.nsf/43bb6130e5e86e5fc12569fa005d004c/028bb89ef4f06073c1256f19003c65dd/$FILE/JT00169927.PDFBanskota, M. 2005. “Sustainable Human Development.” InThe Environmental Perspective: General Overviewand Nepal’s Experience. Paper prepared for UnitedNations Development Programme Nepal.Bardhan, P. 2001. “Social Justice in the Global Economy.”Economic and Political Weekly 36(5 and 6): 467–480.Bhagawati, J. 2001. “Growth, Poverty and Reforms.”Economic and Political Weekly 36(16): 843–846.Boyer, D. 2001. “Trade: The Connection BetweenEnvironment and Sustainable Livelihoods.” WorkingPaper, No. 5, Oxfam America, Boston. Available:http://www.oxfamamerica.org/newsandpublications/publications/ideas_at_oxfam/art5071.html/?searchterm=working%20paper%205Busse, M. 2004. “Trade Environment Regulation and theWorld Trade Organisation.” World Bank PolicyResearch Working Paper, 3361. Washington, DC: TheWorld Bank.Clean Energy Nepal (CEN), and Environment and PublicHealth Organisation (ENPHO). 2003. Health Impactsof Kathmandu’s Air Pollution. Kathmandu.Chaturvedi, S., and G. Nagpal. 2003. “WTO and Product-Related Environmental Standards: Emerging Issuesand Policy Options.” Economic and Political Weekly38(1): 66–74.Chaturvedi, S. 2003. “Agricultural Biotechnology andEmerging Trade Regime at WTO: Some Issues ofConcern.” In Trade and Biodiversity, edited by P.Balakrishna, and E. Warner, Colombo: The WorldConservation Union (IUCN), Regional BiodiversityProgramme, Asia.Consumer Unity & Trust Society (CUTS). 1999. “Trade andEnvironment—An Agenda for DevelopingCountries.” Briefing Paper No. 2, CUTS <strong>Centre</strong> forInternational Trade, Economics and Environment,Jaipur. Available: http://www.cuts-international.org/no2-99.pdfDhakal, S. 2003. “Air Pollution—Suffocating City.” SpotlightVol. 22 No. 25, January 03–09. Kathmandu. Available:http://www.environmentnepal.com.np/articles_d.asp?id=91Dhakal, S. 2004. “Biodiversity for Security.” In Spotlight,24(17). Available: http://www.nepalnews. com.np/contents/englishweekly/spotlight/2004/nov/nov26/national3.htmFederation of Nepalese Chambers of Commerce andIndustry (FNCCI). 2004. Nepal and the World: AStatistical Profile 2004. Kathmandu.Chapter 12: Environment and Trade191
International Trade Forum (ITN). 2001. “Interview withFriedrich von Kirchbach.” In International TradeForum, Issue 1, International Trade <strong>Centre</strong>, Geneva.IUCN (The World Conservation Union). 2004. Urban AirQuality Changes and Policy Measures: A Review ofRecent Conditions in Nepal. Kathmandu.Jha, V. 1999. Trade and Environment—An Agenda forDeveloping Countries. Jaipur: Consumer Unity TrustSociety.Khor, M., ed. 1996. “Environment Debate Heating Up.”Penang: Third World Network. Available:http://www.sunsonline. org/trade/areas/environm/07050196.htmMainali, L. undated. “Implementation Status ofEnvironmental Conventions in Nepal.” Presentationat IUCN Nepal, Kathmandu.Ministry of Finance (MOF). 2004. Economic Survey(FY2004/2005). Kathmandu.Nepal Development Forum (NDF). 2004. “Trade SectorDevelopment.” Kathmandu: His Majesty’sGovernment of Nepal, Ministry of Finance. Available:http://www.ndf2004.gov.np/ncc.phpNational Planning Commission (NPC). 2004. “ProgressReport on Poverty Reduction: An Assessment of theTenth Plan (PRSP) Implementation.” His Majesty’sGovernment of Nepal, National PlanningCommission, Kathmandu.Nepal Trade and Competitiveness Study (NTCS) .2003. “AStudy Conducted as Part of the IntegratedFramework for Trade Related Technical Assistance.”In Nepal Trade Competitiveness Study. Kathmandu.Pokharel, S. 2003. “The Dirty Dozen.” In EnvironmentNepal, Kathmandu. Available:http://www.environmentnepal.com.np/articles_d.asp?id=258Sapkota, T.P. undated. “Implementation of MultilateralEnvironmental Agreements (MEAs ) on Green SectorEnvironment in Nepal: An Overview.” Presentation atThe World Conservation Union (IUCN) NepalCountry Office, Kathmandu.Sharma, R.P., and M.K. Karkee. 2004. “Introduction andOverview.” In Implications of the WTO Membershipon the Nepalese Agriculture, edited by R.P. Sharma,M.K. Karkee, and L.K. Gautam. Kathmandu: Foodand Agriculture Organization/United NationsDevelopment Programme/ His Majesty’sGovernment of Nepal, Ministry of Agriculture andCooperatives.Shrestha, P.M. 2004. “Process of Nepal’s Accession to theWTO and its Implication for Nepal.” Presented at aDiscussion Program on Legal Regime on Nepal’sRatification to the WTO, organized by Action AidNepal, and Law Associates Nepal, Kathmandu.Shrestha, P.R., and B.M. Shakya. 2002. “Status ofStandardization and Conformity Assessment inNepal.” Country Paper (Nepal). World Trade NetTropical Workshop on Business Implications for thePrivate Sector in Asia of the WTO-TBT Agreement,Manila, the Philippines, 3–5 December . PrivateSector in Asia under WTO-TBT Agreement. (3–5December). Available: http://www.intracen.org/worldtradenet/docs/whatsnew/tbt_philippines_dec2002/country_paper_nepal.pdfSouth <strong>Centre</strong>. 1996. Liberalization and Globalization:Drawing Conclusion for Development. Geneva.Stevens, C. 1993. “Harmonization, Trade and theEnvironment.” International Environmental Affairs5(1): 42–49.Tiwari, S., J. Robinson, and G. Amatya. 2003. “PromotingSustainable Livelihoods of Poor and Dalits throughCommunity Based Approaches to Conservation andSustainable Management of Medicinal and AromaticPlants in Doti District: Experience of IUCN Nepal.”Paper presented at the National Workshop on LocalExperience Based National Strategy for OrganicProduction and Management of Medicinal andAromatic Plants/Non Timber Forest Products inNepal. Organized by Ministry of Forests and SoilConservation in collaboration with InternationalDevelopment Research <strong>Centre</strong> and the CanadianCooperative Office, Kathmandu.Trade Promotion <strong>Centre</strong> .2004. Nepal Overseas TradeStatistics 2003–2004. Kathmandu.Third World Network (TWN). 2005. The World TradeOrganisation: Trade and Environment Position Paperof the Third World Network. Penang, Malaysia.United Nations (UN). 1992. “Rio Declaration onEnvironment and Development, Annex I.” Report ofthe United Nations Conference on Environment andDevelopment. Rio de Janeiro, 3–14 June, 1992.Available: http://www.un.org/documents/ga/conf151/aconf15126-1annex1.htmUnited Nations Development Programme (UNDP).undated. Part 4 Environment Factors and TradingOpportunities. UNDP SEED. Available:http://www.undp.org/seed/guide/tradeenv/tradenv4.htmUnited Nations Environment Programme (UNEP). 1999.“Trade Liberalization and The Environment: LessonsLearned from Bangladesh, Chile, India, Philippines,Romania and Uganda: A Synthesis Report.” Nairobi.———.2003. “Global Environment Outlook 3: Past ,Present, and Future Perspectives.” Nairobi. Available:http://www.unep.org/geo/geo3/index.htmWorld Trade Organisation (WTO). 1998. “UnderstandingThe WTO Agreement on Sanitary and PhytosanitaryMeasures.” Geneva. Available:http://www.wto.org/english/%20tratop_e/envir_e/envir_backgrnd_e/c1s1_e.htm———.2001. “Matrix on Trade Measures Pursuant toSelected Multilateral Environmental Agreements(MEAs),” (WT/CTE/W/160/Rev.1). Geneva.———.2005. “Trade and Environment During the GATT.”Environment Backgrounder: Brief History Of TheTrade and Environment Debate, Geneva. Available:http://www.wto.org/english/tratop_e/envir_e/envir_backgrnd_e/c1s1_e.htm192 Environment Assessment of Nepal : Emerging Issues and Challenges
Chapter 13Environmental Information,Analysis, and IntegrationIntroductionDecision-making on complex issues related tothe environment and natural resources mustbe based on accurate data. The synthesis andanalysis of basic environmental data yields theinformation that is the precondition for developingpolicy framework, policy design, and the plans andprograms for environmental and natural resourcemanagement. Concern for environmental issues inNepal has increased in recent years. As thepopulation at large becomes sensitized to environmentalissues, there is a growing interest in analyticaldata and indicators of the state of the environment.The demand for environmental information isescalating, and governments and civil societystakeholders have been the driving forces on boththe supply and the demand sides. Good, reliable dataon Nepal are recognized as a fundamental toolneeded for development. Developing and usinginformation and knowledge are therefore essentialparts of environmental planning and managementfrom local to national levels. The use of suchinformation leads to greater transparency and bettergovernance, and hence plays a crucial role inenvironmental management. It is the foundationupon which many analytical and decision-makingprocesses are based, which in turn are theprecursors for effective actions on the ground.Although over the years considerable environmentaldata and information have been compiled byvarious institutions, aid projects, and individualresearchers working on different projects andprograms, they have been difficult to access. Dataappearing in isolated reports are often dispersed,heterogeneous, and inaccessible; more often thannot, they are insufficiently relevant in terms ofcontinuity and reliability. Without an appropriateframework and mechanisms for data sharing, timeand resources are wasted in duplicating efforts fordata collection and management. Public and privateenvironmental institutions and bodies in Nepal haveaccumulated environmental data and information onnatural resources and environmental conditions.These databases lack a centralized data pool andunified standards. There is no national databaseintegrating all the sectoral data, nor are there anydata linkages that would allow sharing of the existinginformation.Role of Environmental Information inDecision MakingDetermining the need for environmental informationis perhaps the first step towards assessingenvironmental conditions at local, regional, andnational levels. Efforts to improve environmentalconditions are based on the assumption that rationalenvironmental planning and management resultsfrom informed decision making. Environmentalinformation for decision making gained specialattention following the Rio Earth Summit in 1992 andwas further emphasized at the World Summit onSustainable Development in 2002. The summitunderlined the importance of improved availability ofinformation on all aspects of environment anddevelopment as well as the need for improvedcollection and presentation of data and informationfor decision making. Goal 7—environmentalsustainability—of the United Nations’ MillenniumDevelopment Goals specifies key targets andindicators, and highlights the need to promote anduse environmental data and information to tackleand monitor pressing environmental problems.Some of the targets and indicators related to Goal 7are shown below. (More details on the Goals areprovided in the Annex at the end of this <strong>book</strong>).Target 9: Integrate the Principles of SustainableDevelopment into Countries’ Policies andPrograms and Reverse the Loss of EnvironmentalResources.Indicators:– Proportion of land area covered by forest– Land area protected to maintain biologicaldiversityChapter 13: Environmental Information, Analysis, and Integration193
– Gross domestic product per unit energy use– Carbon dioxide emission per capitaFigure 13.1: Relationships among Indicators, Data, andInformation to Meet Users’ NeedsTarget 10: Halve by 2015 the Proportion ofPeople without Sustainable Access to SafeDrinking Water.Indicator:– Proportion of population with sustainableaccess to improved water sourcesTarget 11: Significantly Improve the Lives of atleast 100 million Slum Dwellers by 2020.Indicators:– Proportion of people with access toimproved sanitation– Proportion of people with access to secureland tenureCoherent and compatible baseline data anddata systems must be in place to derive theindicators described above. A United NationsDevelopment Programme report by the NepalCountry Team in 2002 shows that Nepal’s progress inmeeting MDG Goal 7 has been poor and indicatesthat lack of data is part of the problem.Importance of Environmental IndicatorsIndicators need to be based on primary data whichare the foundation for scientific analysis and decisionmaking. An index is a composite of severalindicators. Combining relevant indicators from thevast array of environmental data into a compositeindex reveals the evidence more convincingly thanindividual indicators would. Environmentalindicators represent a powerful tool for communicatingsynoptic information on the environment todecision makers and the public. Indicators representa bridge between the wealth of detailed informationand the need for interpreted information. Environmentalindicators facilitate better understanding ofenvironmental trends and conditions at multiplelevels of users—the general public, researchers andscientists, and policymakers (Figure 13.1). Thepackaging of environmental data into indicators willhelp to simplify complex issues and set precise goals,and monitor progress towards those goals.Environmental indicators are not easy toformulate and their development is the subject ofmuch national and international research (ICSU2002). Environmental indicators are relativelyunderdeveloped compared with economic andsocial indicators, and there is no widely usedcomposite index that captures the progress ofenvironmental sustainability, similar to gross nationalSource: After Braat, in Kurik and Verbruggen (1991)product for economic development or the humandevelopment index.Environmental Information DatabaseFrameworkAccess to multisectoral environmental databases atmultiple levels is the key to environmentalassessment and monitoring. An environmentalinformation database should integrate informationfrom socioeconomic and biophysical sources,natural disasters, and polices and institutions. TheUnited Nations Environment Programme (UNEP) hasbeen advocating a framework environmentaldatabase for state of the environment reporting at thenational level (Rump 1996). Embracing such aframework at the national level will help Nepal dealwith environmental information (see Figure 13.2).Issues Related to EnvironmentalInformationNeeds for environmental data and information aredetermined by specific environmental problems.Some critical questions regarding environmentaldata and information are:(i) What are the pressing environmentalproblems?(ii) What are the data needs?(iii) What are the data gaps?(iv) What are the institutional mechanisms tosupport the data and information?Environmental data and information aremultidisciplinary and integrative in nature,measuring human activities and natural events thataffect the environment. There needs to be a194 Environment Assessment of Nepal : Emerging Issues and Challenges
Figure 13.2: Framework for an Environmental Information DatabaseBIOPHYSICAL ENVIRONMENTINPUTLAND WATER ATMOSPHERE AND CLIMATE BIODIVERSITYLand use Inland water pollution Air pollution Destruction of biodiversityDeforestation Utilization of inland water Climate change Loss of aquatic fishLand degradation Marine water pollution Wildlife tradeLand desertificationHabitat lossWaste disposalProtected areasSOCIOECONOMIC ENVIRONMENTPOPULATION HEALTH AGRICULTURECharacteristics of population Characteristics of health Agricultural productionPopulation growth Mortality incidences Livestock population & productionRural urban migration Noise pollution Use of agrochemicalsHealth educationPOVERTY TRANSPORATION TOURISMENERGY EDUCATION ECONOMY AND EMPLOYMENTRenewable energyNonrenewable energyINDUSTRYENVIRONMENTALINFORMATIONDATABASEOUTPUTSTABLESGRAPHSMAPSNATURAL DISASTERSFLOOD HAZARD DROUGHT HAZARD CYCLONE EARTHQUAKE FOREST FIRESVOLCANOSLANDSLIDESPOLICIES AND INSTITUTIONSSTATUS OF EIASTATUS OF ENVIRONMENTAL MONITORING AND MANAGEMENTPARTICIPATION IN MAJOR GLOBAL CONVENTIONSSource: UNEP/EAP-AP—State of the Environment Data Collection and Reporting Training for South Asia (unpublished).continuous process to survey and monitor bothquantitative and qualitative assessment of theresources base or environmental conditions. Specificenvironmental problems require assessment ofexisting data structure and identification of datagaps. Proper institutional mechanisms allow sharingof data and information and will fill the data gaps. Aconcept of “information infrastructure” is emergingin which information is seen as infrastructure liketelecommunications or road infrastructure.Information infrastructure related to the environmentcan be seen as a broad policy, technical, financial,and institutional framework to promote and useenvironmental information. An informationinfrastructure on the environment will be the key tomanaging environmental problems. Such aninformation infrastructure on environment willfacilitate integrating environmental concerns intoeconomic development, tracking environmentalchanges and managing the environment, andpromoting environmental awareness to the public.Core Environmental InformationAlmost all environmental problems share commoninformation needs. These include basic descriptionsof such things as topography, land use/land cover,infrastructure, and demography (human activity) thatare common information denominators (UNEP andUNDP 1994). Such details can be considered the coreenvironmental information that will facilitate betterunderstanding within the context of the environmentalproblem (local, regional, and national) in itsfullest sense. The specific type of environmental andnatural resources information, however, will bedictated by the nature of the developmentinterventions for which it is designed.Development of core environmental datasets isoften labor and technology intensive, and they areexpensive to produce and update (UNEP and UNDP1994). These core datasets provide a wide variety ofuses specific to a given location; for instance, landuse information is needed to address manyenvironmental problems, but often no single use canjustify the cost of development. Focusing onenvironmental assessment and sustainable developmentstrategies, a broad-based symposium organizedby UNEP and UNDP identified ten high-prioritycore environmental datasets that are central to manytypes of studies related to environmental assessment.These are: land use and cover, demographics,hydrology, infrastructure, climatology, topography,economy, soils, air quality, and water quality.In Nepal, many different government agencieshave mandates to generate and maintain coreinformation, but the availability of information variesfrom theme to theme and data gaps persist.Chapter 13: Environmental Information, Analysis, and Integration195
Time Series InformationGenerally two types of information are needed: thefirst is the baseline condition and the second ismonitoring data to determine changes from baselineconditions. Developing monitoring networks oftenrequires considerable investment in infrastructure;for example, investments in monitoring instrumentsor computer networks. For a developing country likeNepal, such investments are difficult and their useneeds to be carefully evaluated in terms of costs andbenefits in relation to policy objectives andprograms. They should provide reliable, harmonized,and comparable environmental information formonitoring purposes.In Nepal, monitoring information is often hard toobtain and difficult to compile due to lack ofsystematic data collection and monitoring systems.The monitoring of natural resources is particularlyimportant, since that sector makes major contributionsto the economy. Other environmental problemsrequiring monitoring include air quality in KathmanduValley and other major urban centers. Thisproblem has been aggravated by heavy migration ofpeople to urban centers due to the prevailinginsurgency, although exact figures are unavailable.Information ScaleEnvironmental planning and management are ofteninfluenced by particular geographic conditions andrequire spatial (map) information on naturalresources, including major hydrology, topography,soil characteristics, and human activities. Scale ofinformation suggests the amount of generalizationthat has taken place in compiling a map. The scale ofmaps is a critical but often overlooked factor forenvironmental assessment and monitoring. In Nepal,most maps are at different scales and have differentcoordinate systems, making it difficult to makeoverlays and integrate them into a commongeographic information system (GIS) platform(Shrestha and Pradhan 1999). Data related toenvironmental problems requiring large-scale mapsare unavailable or difficult to compile. Satellitetechnology (remote sensing imagery) is analternative source for such information, but oftenassociated with high costs, and its uses are limiteddue to lack of adequate technical expertise.Institutional issuesBecause resources and environmental informationtends to be sector specific, institutional considerationssurround information collection, processing,and dissemination. Because baseline data iscommonly unavailable, database development isoften carried out on a project basis with little focuson the generic uses of the data, leading toduplication of effort and data redundancy (Shresthaand Pradhan 1999). Seemingly comparable datagenerated by different agencies may in practice beincompatible as a result of differences in dataformat, reporting schedules, or the ultimate purposefor which the data were collected. Further, due topoor understanding of the processes involved andweak technical capabilities, datasets are often of lowquality and lack standards. Little attention is paid tosharing data. An institutional mechanism is neededto encourage coherence while allowing forparticipation by a variety of institutions involved inenvironmental issues, taking into account their ownspecific needs and the need for a national vision.This institutional mechanism should aim for costeffectivenessin funding and allocation of resources,and for policy relevance of the information. Such aninstitutional mechanism is yet to be seen in Nepal,though there is increasing awareness amongprofessionals and scientists of the need for it.Data QualitySince baseline data will likely be used by many users,they must be of the highest quality. Sensitivity testingshould be carried out, and each ministry and agencyshould reassess data quality standards and the data’sability to address their purpose. Generally, qualityassessment procedures are weak in Nepal (ICIMODand UNEP 2001) and the user communities mustmake do with the information that is available.Data Standards and MetadataData standards ensure the quality of data andeffective data interchange. No comprehensiveenvironmental data standards have been developedin Nepal except for some specific applicationdomains (ICIMOD and UNEP 2001).Metadata is a process of documenting existingdatabases that provides information about data foraccess and use by the user community. Metadata isintended to provide as much information as possibleabout the data, its history, use, quality, and otherassociated information to the users. Such documentationof data or creation of a metadatabase has notbeen done in Nepal due to lack of know-how andstandards, which will make future use of data difficult.Status of Environmental Data andInformation in NepalThere is a need for a strong information base on allaspects of Nepal’s environment and naturalresources; this must be collected systematically from196 Environment Assessment of Nepal : Emerging Issues and Challenges
decentralized multisectoral environmental agenciesor institutions, analyzed, and presented in a timelymanner. In Nepal, environmental data andinformation are collected by many sectoral agencies,and tend to remain with the agencies that generatedthem. As explained and illustrated in previouschapters of this <strong>book</strong>, a wide variety of sources areused for data collection. Although access toenvironmental information among governmentinstitutions is theoretically unrestricted, there is noclear, established mechanism to promote access toand circulation of environmental information. Inpractice, various publications and reports circulateamong the agencies, but each agency tends tomanage its own data sources and publicationswithout much coordination or exchange ofinformation about what is produced. As a result,needed information cannot be compiled quickly formultisectoral analysis of environmental issues. Thefollowing section highlights the status of environmentaldata and information in Nepal.Data from the State of the EnvironmentNepalThe State of the Environment Nepal study wasundertaken jointly by the Ministry of Population andEnvironment (MOPE), UNEP, and the InternationalCenter for Integrated Mountain Develoment(ICIMOD) in 1999 as part of an environmentalassessment of Nepal and to contribute to UNEP’sGlobal Environment Outlook initiative. The report(UNEP 2001) highlighted the major environmentalissues of Nepal in five categories: forest depletion,soil degradation, air pollution, water quality, andsolid waste management. The study aimed to set inmotion a data collection and updating mechanismand process to support regular state of theenvironment reporting.The study quoted 64 different sources identifiedduring its efforts to compile information and deriveindicators. Major sources of data were annual reportsof the ministries and departments concerned, reportsof the Central Bureau of Statistics (CBS), paperspublished in national and international journals,unpublished official records, and informal discussionswith the experts and heads of the organizations anddepartments. Table 13.1a,b summarizes the differenttypes of datasets collected for the report and thesources from which they were obtained.Data on Environmental ImpactAssessmentPerformance of environmental impactassessments (EIA) was initiated in Nepal in the mid-1980s. Attempts towards institutionalizing EIAsinclude the National EIA Guidelines 1993 and EIAGuidelines for Forestry and Industry Sectors 1995. EIAguidelines for other sectors such as water resources,roads, mining, and urban development have beendrafted. Integration of EIA through legal measureshas also been initiated through the EnvironmentProtection Act 1996 and Environment ProtectionRegulations 1997 (amended 1999). The Nepal Stateof the Environment study listed 44 differentnongovernment organizations (NGOs) and 20different consulting firms used to undertake differentEIAs in Nepal. Many of these EIAs depend onsecondary sources of information and in some casesprimary data collection. EIAs are mostly carried outindependent of each other and there is very littlesharing of data and information and lessons learned.Environmental StatisticsBesides collecting and processing social andeconomic data, CBS also collects and publishes datarelated to agriculture, fisheries, and forestry, and theenvironment. CBS regularly compiles and publishesenvironment statistics for Nepal prepared under theFramework for the Development of EnvironmentStatistics (CBS 2004). The statistics relate to flora andfauna, atmosphere, water and sanitation, land andsoil, and human settlement.Under the framework, CBS relates thesecomponents to social and economic activities;natural events; environmental impacts of activitiesand events; response to environmental impacts; andinventories, stocks, and background conditions.Data Collected by GovernmentOrganizations and OthersThe Ministry of Agriculture and Cooperatives has anAgricultural Statistics Division that regularly publishescomprehensive statistical information on agricultureand related variables in its publication StatisticalInformation on Nepalese Agriculture (<strong>ADB</strong> 2004).The data released are advance estimates of districtstatistics on cereal crops, cash crops, pulses,livestock, poultry, fishery, and horticulture. Itsstatistical functions are limited to producing forecastdata of crop area, agricultural production, and otheragricultural statistics. CBS also carries out anagricultural census, and the differences betweenCBS and the Ministry of Agriculture and Cooperativesdata must be evaluated and reconciled. Despiteextensive data collection, there are considerablegaps in national estimates in terms of sources,desired frequency, and desired level of geographicdisaggregation.The Ministry of Forest and Soil Conservationcompiles statistics related to forest and the environ-Chapter 13: Environmental Information, Analysis, and Integration197
Table 13.1a: Different Datasets Collected for the Nepal State of the Environment ReportTopic Sources (Table 13.1b )Land: Deforestation <strong>18</strong>, 10, 5, 43, 4, 23Land: Land Degradation 45, <strong>18</strong>, 21, 5, 7, 23Land: Land Desertification <strong>18</strong>, 2, 5, 25, 45Land: Land Use <strong>18</strong>, 2, 5, 14, 30, 12,Land: Waste Disposal <strong>18</strong>, 45, 4, 11Water: Inland Water P ollution 45, 38, 20Water: Utilization of Inland Water 9, <strong>18</strong>, 2, 43, 9, 45, 33, 34Atmosphere and Climate: AirPollution45, 43, <strong>18</strong>, 25, 22, 9, 15Atmosphere and Climate:Climate Change9Biodiversity <strong>18</strong>, 7, 45Biodiversity: Loss of Aquatic fish 2, <strong>18</strong>, 27, 4, 45Biodiversity: Wild Life Trade 4, 15, 45Biodiversity: Habitat 26, 7, 5Biodiversity: Protected Areas 28, <strong>18</strong>, 45Population <strong>18</strong>, 7, 36, 42, 40, 4, 1Education<strong>18</strong>, 3, 4, 42, 41, 39, 40, 6,30EIA = enviro nmental impact assessmentSource: ICIMOD and UNEP (2001)Topic Sources (Table 13.1b )Poverty 30, 4, 44, 41, 16, 37, 31Health<strong>18</strong>, 4, 41, 2, 6, 45, 17, 13,36, 31Industry 4, 14Agriculture 2, <strong>18</strong>, 4, 19, 35Tourism—International/Internal <strong>18</strong>, 4, 32Transportation <strong>18</strong>, 4, 45, 15Energy 4, 43, <strong>18</strong>Natural Disa ster <strong>18</strong>, 21Economy and Employment <strong>18</strong>, 4, 30Policies and Institutions 24, 29,Policies and Institutions: Statusof EIA7Policies and InstitutionsSignatories in Major GlobalConventionsEmerging Environmental IssuesTable 13.1b: Key to Dataset SourcesNumber Source1. Ministry of Local Development2. Ministry of Agriculture3. Ministry of Education and Culture4. Ministry of Finance5. Ministry of Forest and Soil Conservation6. Ministry of Health7. Ministry of Population and Environment8. Ministry of Water Resources9. Department of Hydrology and Meteorology10. Department of National Parks and Wild LifeConservation11. Department of Agriculture12. Department of Forest13. Department of Health14. Department of Mines and Geology15. Department of Transport Management16. Department of Water Supply and Sewerage17. Bir Hospital<strong>18</strong>. Central Bureau of Statistics19. Cotton Development Board20. CEMAT21. Disaster Prevention Technical Center22. Environment and Public Health Organ isation23. International <strong>Centre</strong> for Integrated MountainDevelopmentSource: ICIMOD and UNEP (2001)Number Source24. Krishna Engineering Consultant25. Kathmandu Valley Vehicular Emission ControlProgramme26. Land Resources Mapping Project27. National Account of Nepal 1998 CBS/HMG:35pond+river28. National Biodiversity Action Plan HMG29. Nepal Bureau of Standards and Metrology30. National Planning Commission31. Nepal Rastra Bank32. Nepal Tourism Board33. Nepal Water Supply Corporation34. People and Resource Dynamics Watershed Project35. Pesticide data from records36. REGHED, Health Statistics of Nepal37. Rural Water Supply and Sanitation Project38. SMEC, Stanley International Ltd.39. Tribhuwan University40. United Nations Environment Programme41. United Nations Development Programme42. World Bank43. Water and Ene rgy Commission Secretariat44. World Health Organization45. Individuals198 Environment Assessment of Nepal : Emerging Issues and Challenges
ment. The data are collected regularly from districtand regional forestry offices through observation, totalcounting, and measurement, and the disaggregation isdistrict, regional, and ecological. The forest resourcesinventory is based on standardized statisticalmethods, and sample errors, standard errors, andvariation coefficients are computed. An AsianDevelopment Bank (<strong>ADB</strong>) technical assistance report(<strong>ADB</strong> 2004) recommends that MOFSC strengthen itscapability in coordinating the production of importantstatistics on forestry and the environment to be able tofill the current data gaps.The CBS and the Department of Health Servicesof the Ministry of Health are the two major sources ofhealth and environment related statistics. TheDepartment of Health Services has an integratedhealth management information system that aims toencourage bottom-up planning from communitylevel to national level. About 400 indicators arecollected every month and about 100 derived fromdifferent reports. The indicators monitored concernchild health, reproductive health (safe motherhoodand family planning), and disease control. Despitemany social surveys being conducted, <strong>ADB</strong> (2004)points out considerable data gaps as well as thenecessity to allocate responsibilities for generatingsuch data to avoid duplication of functions.In addition, a number of other organizationsincluding research institutes, universities, NGOs, andindividual researchers collect data and information intheir areas of specialization as indicated in Table 13.1.Existing Environmental InformationCollecting, compiling, and harmonizing informationfrom different sources are often difficult tasks.Furthermore, collecting environmental data fromsecondary sources or descriptive data has proven tobe a daunting task in Nepal. The past study on theState of the Environment Nepal and the present studyare good examples and share the same experience.Except for data found in reports, reliable data arevery difficult to obtain and many institutions lack theproper data handling capability. The problemsinclude the fact that sources of environmental dataand information are generally diverse andincoherent; the marked unwillingness on the part ofmost of the institutions and individuals to share dataand information; and a lack of the datastandardization and consistency that would makethem usable under a common platform—often thereare simply no data available.Circulation of environmental information shouldbe stimulated at the national level. Issues emanatingfrom the present institutional context need to beaddressed to improve the environmental data andinformation available in Nepal.Integration and Analysis ofEnvironmental InformationThe information required for environmentalassessment and monitoring covers a wide spectrum.There is an increasing need for better integration ofenvironmental concerns into decisions that canaffect the environment in major economic andhuman activities such as energy, industry, transport,agriculture, and tourism. Information on the naturalresources base and environment is essential.Information on human activities impacting theenvironment, emission of pollutants, natural events,and human responses to environmental changes isequally important for assessing the ecosystem as awhole.Careful integration of environmental data intosocial and economic dimensions is increasinglyrecognized as vital for scientific understanding andsocietal decision making (Maclaren et al. 1994). Thishas a number of implications for the collection,management, and use of information, including thenecessity of synthesizing and presenting scientificand technical information in readable, usable form,and of displaying the links between environmentaland socioeconomic issues. Such integration can befostered by proper institutional mechanisms as wellas by using modern analytical tools and decisionsupportsystems, which will support betterunderstanding of environmental trends andconditions and help develop and implement policies,plans, and actions. The following section describesthe use of such modern scientific tools.Geographic Information Systems (GIS)Environmental problems have distinct spatial andtemporal dimensions. From an operationalstandpoint, data must be referenced geographically.Decisions related to the environment, protection ofbiodiversity, environmental damage due to naturalhazards, urban growth, and so on need informationthrough space and time. Due to the very highvariability in topography and ecologicalcharacteristics, Nepal poses challenges in compilingand analyzing such information.Advanced information communicationtechnology, GIS, and space technology represent anew generation of tools for scientific analysis.Myriads of these tools are converging and are nowavailable to quantify, model, document, anddisseminate information on key environmental andnatural resources conditions and trends. Theinformation thus generated is readily understood bypolicymakers and the public. GIS technology isChapter 13: Environmental Information, Analysis, and Integration199
elevant due to its multidisciplinary nature thatallows integrating divergent sources of data, spatialmodeling, and visual presentation; using such toolscalls for close collaboration among many sectors.Availability, accessibility, and affordability ofgeographically referenced information at multiplescales, and the capacity to use modern decisionsupport system tools are crucial to investigating keyenvironmental problems.Importance of Spatial InformationInformation portrayed in maps is an essential tool forassessing the state of the environment (UNEP andUNDP 1994). From a spatial context, the analysis ofenvironmental conditions and trends can be presentedby administrative boundary, environmental unitssuch as watersheds, or eco-regions. As socioeconomicdata are based on the administrative units, it isconvenient to map environmental impacts due tohuman activities in these units. The ecologicalframework approach demands better understandingof natural processes, and a natural resource basedapproach using watersheds or eco-regions is suitablefor environment assessment. Such analyses can beaccomplished through the use of GIS (Bajracharya2000).Many spatial data are considered core environmentalinformation such as topography, land use,ecology, drainage networks, geology, infrastructure,and so on. In Nepal, such information is reasonablywell developed but needs regular updating. Figure13.3 provides examples of these types of informationlayers prepared by ICIMOD’s Mountain Environmentand Natural Resources Information Systems(MENRIS) program using data from variousgovernment sources.ICIMOD and CBS have also carried out extensivemapping of socioeconomic indicators and trendsusing census information, which included health andenvironment information; an example is shown inFigure 13.4.Environmental GIS ApplicationsThrough its MENRIS program, ICIMOD has adopted astrategic approach to promoting and using GIS forenvironmental and natural resources managementfor mountain areas among its member countries.Figure 13.5 shows typical examples of some of theseenvironmental applications in Nepal; theydemonstrate the potential for using GIS.Figure 13.3: Examples of Information Layers for Nepalprepared using data from Government SourcesSource: Mountain GIS Portal (www.<strong>icimod</strong>-gis.net) MENRIS, ICIMOD.Figure 13.4: Mapping of Socioeconomic IndicatorsUsing Census Information – Sources of Drinking WaterRemote SensingRemote sensing (RS) observations from satellitesprovide data on the earth in a spatial format. The lastdecade witnessed unprecedented growth andSource: ICIMOD (2003)200 Environment Assessment of Nepal : Emerging Issues and Challenges
Figure 13.5: Examples of Environmental Applications ofGISa) GIS in Urban Environmental PlanningSource: Shrestha t al. (2003)b) Hazard Map of Sagarmatha National Park(Criteria based on lithology, slope, and land cover)Source: MENRIS, ICIMOD.c) Climatic Atlas Mappingdevelopment in earth observation techniques. Thetrend is continuing, and remote sensing techniquesare proving to be more cost effective than groundbasedones. RS data have benefits from the synopticview and large area coverage, which help inobtaining a “bird’s eye-view” of the features.Remotely sensed data have a huge potential forproviding time series data on environmentalconditions of dynamically changing resource bases.The availability of RS data in a temporal domain (asshort as 3–20 day intervals) provides a newdimension to spatial information processing andmonitoring of earth features. Furthermore, in recentyears high-resolution satellite data have provided agreater degree of spatial and temporal variationsthan ever before. Global positioning system (GPS)technology has revolutionized surveying andmapping. The increasing availability of publicdomain datasets from RS techniques, the decliningtrend in the cost of computer hardware, theexponential increases in computing power and theexpansion of the Internet, and increased userfriendlinessof software are other welcomedevelopments. These developments create asuitable context for using remote sensing forenvironmental monitoring. The recent release (June2005) of the GoogleEarth product(http://earth.google.com) has allowed ordinaryInternet users to view interactively a 3-D globe basedon satellite imagery.In the present context, remotely sensed dataprovide a means to integrate the informationrequired to assess and monitor ecosystemsustainability. Virtually all modern map productsderive considerable information from remotesensing. Recent developments in space technologysuggest that the future will bring a wide variety ofproducts for environmental monitoring andassessment. The recent UNEP Atlas “One PlanetMany People” used satellite imagery extensively toassess and monitor the earth’s environment (UNEP2005).ICIMOD has been promoting the use of RS in thegreater <strong>Himalayan</strong> region and applying RStechniques to various environmental problems;some typical examples drawn from Nepal are shownin Figures 13.6.Source: MENRIS, ICIMOD.Environmental Decision Support SystemsEnvironmental databases coupled with informationsystems and decision support systems are central toachieving a successful transition from the traditional(sectoral) environment and natural resourcesmanagement to an integrated, holistic approach todevelopment because of their integrative quality(linking biophysical and socioeconomic information)Chapter 13: Environmental Information, Analysis, and Integration201
Figure 13.6: Examples of Applications of RemoteSensing in Environmental Studies(Source: Mountain GIS Portal ICIMOD)a) Mosaics of Natural View and Geocover of Nepalb) Biodiversity Mapping Using Remote Sensingc) Kathmandu Valley—Urban Growth (1967–2001)This framework is based on building thecapacity of local and national partners, and creatingan environmental information network. Theframework provides a mechanism to assimilate bothbiophysical and socioeconomic information atmultiple levels through an organized environmentaland natural resources information network of localand national partner institutions. The frameworkdefines the aggregation of geo-referencedenvironmental information with acceptedinternational standards at local and national levels togive rise to integrated environmental databases. Thedatabases serve as a foundation upon whichanalytical and decision making processes are based.The spatial modeling tools combined with thematicexpert knowledge on priority environmental issueswill help to analyze and model key components ofthe mountain environment such as biodiversity,climate change, snow and glaciers, land use andland cover, and infrastructure development.Ultimately, the framework is aimed at contributing toan increased knowledge base for environmentalinformation and to decision-support systems.The main functions of such an information anddecision-support system are to facilitate access toenvironmental information and data sharing;promote the integration and harmonization of datathrough the use of GIS, the Internet, and relatedtools; and indicate alternative scenarios throughscientific analysis of priority environmental issues.ICIMOD, together with partners, is currentlydeveloping a “Protected Areas Database Portal” ofNepal—a framework for sharing and exchanginginformation related to protected areas andbiodiversity through the Internet with a dynamicmapping capability, and a database for atransboundary water quality monitoring network.Conclusions: Challenges inEnvironmental Informationand their location-based property (addressingrelationships among places at local to nationallevels). Figure 13.7 illustrates the framework forenvironment and natural resources information anddecision support systems adopted by the MENRISprogram at ICIMOD for sustainable mountaindevelopment in the Hindu Kush-<strong>Himalayan</strong> region.Developing countries like Nepal, where theenvironment is often treated as a lesser priority oreven neglected, clearly face big challenges intackling problems related to environmentalinformation. Most often, analysts and policymakerslack the capacity to fully use environmental data andinformation to bear upon decision making. Some ofthe challenges and issues that Nepal faces in thisregard are presented below:(i) There is a general lack of awareness aboutwhat environmental information is available,and it is not easy to learn what work is beingcarried out at present or has been done in thepast. There is neither a central record of202 Environment Assessment of Nepal : Emerging Issues and Challenges
Figure 13.7: Framework for Environment and Natural Resources Information and Decision Support SystemsSource: ICIMOD/MENRIS Programme Brochureenvironmental information or metainformation,nor a comprehensive list of datasources, environmental publications, andreports. Often available information iscommunicated verbally, and little attention ispaid to structuring the data in a computerizedsystem. It is often easier for agencies to simplyre-collect information.(ii) There is no clear mandate or policy at theinstitutional level responsible for defining,maintaining, and updating environmental dataand information. There is little or no interactionamong institutions or projects, and theirmandates, authorities, responsibilities, andfunctions often overlap.(iii)The present level of information gathering onthe environment is insufficient and importantdata gaps persist. There are gaps in terms ofdesired frequency and desired level ofgeographic disaggregation. Even where dataare available, they remain sectoral in natureand most often incompatible across sectors,areas, and time.(iv) Many organizations use different methods foracquiring, storing, processing, analyzing, andpresenting environmental data and information.Harmonization of environmental dataand information is difficult.(v) Information networking between local andnational levels remains weak, and coordinationamong the line agencies for effective datasharing is non-existent. The data sharingculture remains poorly developed.Chapter 13: Environmental Information, Analysis, and Integration203
Judith DobmannThere are many sources of environmental information: clockwise from top-weather station; demographics;measuring water flowZbigniew Mikolajuk Gopal Nakarmi204 Environment Assessment of Nepal : Emerging Issues and Challenges
(vi) Many environmental issues such as loss ofbiodiversity, glacier melting, soil erosion, airpollution, and flooding transcend nationalboundaries. It is also necessary to strengthen asense of collective ownership and responsibilityfor the environmental challenges facedat the regional/global level. There is a need topursue effective measures of regionalcooperation and to establish a regionalnetwork for effective sharing and exchange ofenvironmental information.Unless there is a strong political will and goodgovernance, these challenges are unlikely to be met.For this, policymakers, user communities, and dataproducers need to be more aware of the benefits.Tackling problems related to environmental data andinformation requires establishing an environmentand natural resources information network tofacilitate the exchange of information and strengthenappropriate policymaking capacities. A unifiedrepository would collect all relevant databases withthe participation of government, nongovernment andacademic institutions, the private sector, and otherstakeholders. Such a network, which would integratedata and information from decentralized providersand make them available to a multitude of users, isan important concept, and doubtless a useful one,but needs to be strictly managed to make it viable.There are several needs related to this.(i) Initially, existing structures need to be assessedand the capacity of the different sectoralagencies reinforced to allow them to generateand analyze multisectoral environmental andnatural resources data and information moreeasily.(ii) Sectoral agencies need to be coordinated sothat the data and information collected aresystematic and conform to a consistentinformation structure that ensures quality andreliability.(iii)Socioeconomic and other sectoral data andinformation can then be harvested to derivepolicy-relevant, aggregated indicators for majorenvironmental issues at the local and nationallevels.(iv) An integrated environmental decision-supportsystem focusing on priority environmentalissues can then be developed to bring togetherexisting knowledge and help facilitateassessments, trends, and projections in thearea of environmental protection.(v) To maximize its usefulness, Nepal’s centralrepository of information would then need tobe networked and linked with differentregional and international agencies and withother well-developed and managedinformation bases dealing with similar types ofinformation.BibliographyAsian Development Bank (<strong>ADB</strong>). 2004. TechnicalAssistance Completion Report on Strengthening theNational Statistical System. Kathmandu.Bajracharya B. 2000. “Development of Geo-InformationInfrastructure: Issues in the Hindu Kush- Himalayas.”Issues in Mountain Development 2/2000.Kathmandu: International <strong>Centre</strong> for IntegreatedMountain Development.Bajracharya, B. 2005. “Hazard Mapping of SagarmathaNational Park.” Draft Report. International <strong>Centre</strong> forIntegrated Mountain Development, MountainEnvironment and Natural Resources InformationSystem (MENRIS), Kathmandu.Maclaren, V., M. Campbell, and W. Dickinson. 1994.Municipal State of the Environment Reporting inCanada: Current Status and Future Needs. Ottawa:State of the Environment Reporting.Central Bureau of Statistics (CBS). 2004. Hand<strong>book</strong> ofEnvironment Statistics 2003. Kathmandu.Environmental Portal of United Nations EnvironmentProgramme/GRID–Arendal.Available:http://www.grida.no/products.cfm?pageID=7Ester, J., I. Lawless, and D.W. Mooneyhan, eds. 1994.“International Symposium on Core Data Needs forEnvironment Assessment and SustainableDevelopment Strategies,” (Vol. I and II), UnitedNations Environment Programme (UNEP) andUnited Nations Development Programme (UNDP),Bangkok, Thailand, November 15–<strong>18</strong>.Geo-Data Portal of United Nations EnvironmentProgramme, Global Environment Outlook. Available:http://geodata.grid.unep.ch/International <strong>Centre</strong> for Integrated Mountain Development(ICIMOD). 1996. Climatic and Hydrological Atlas ofNepal. Kathmandu: His Majesty’s Government ofNepal, Department of Hydrology and Meteorology,and International <strong>Centre</strong> for Integrated MountainDevelopment.Chapter 13: Environmental Information, Analysis, and Integration205
———.2003. Mapping Nepal Census Indicators 2001 &Trends. Kathmandu.International <strong>Centre</strong> for Integrated Mountain Development(ICIMOD) and United Nations EnvironmentProgramme (UNEP). 2001. “StrengtheningEnvironment Assessment and MonitoringCapabilities in Nepal.” State of the EnvironmentDatabase Report (Internal Report), Kathmandu.International Council for Science (ICSU). 2002. “MakingScience for Sustainable Development More PolicyRelevant: New Tools for Analysis.” ICSU Series onScience for Sustainable Development No. 8, Paris.Kurik, O., and H. Verbruggen. 1991. Search of Indicators ofSustainable Development. The Netherlands: KluwerAcademic Publisher.Mool P.K., S.R. Bjaracharya, and S.P. Joshi. 1999. Inventoryof Glaciers, Glacial Lakes and GLOFs in Nepal.Kathmandu: International <strong>Centre</strong> for IntegratedMountain Development.Mountain GIS Portal, International <strong>Centre</strong> for IntegratedMountain Development (ICIMOD), Kathmandu.Available: www.<strong>icimod</strong>-gis.netRajbhandari L. “Water Quality Modeling in Jikhu KholaWatershed.” Integrated Water ResourcesManagement Training Course Compendium,MENRIS-ICIMOD, and ITC-Netherlands.Rhind, D. 1997. Framework for the World. New York: JohnWiley and Sons.Rump P.C. 1996. State of the Environment Reporting:Source Book of Methods and Approaches. Nairobiand Ottawa: United Nations EnvironmentProgramme and Environment Canada.Shrestha, A., B. Bajracharya, and B. Rajbhandari. 2005.“GLOF Hazard Impact Assessment in SagarmathaNational Park.” Draft Report, MENRIS-ICIMOD,Kathmandu.Shrestha, B. and S. Pradhan. 1999. Kathmandu Valley GISDatabase—Bridging the Data Gap. Kathmandu:International <strong>Centre</strong> for Integrated MountainDevelopment.Shrestha, B., B. Bajracharya, S. Pradhan, and L.Rajbhandari. 2003. GIS for Municipal Planning—ACase Study from Kirtipur Municipality. Kathmandu:International <strong>Centre</strong> for Integrated MountainDevelopment.United Nations Environment Programme (UNEP). 2001.Nepal: State of the Environment. Bangkok: UnitedNations Environment Programme, RegionalResource Center for the Asia Pacific.———.2005. One Planet Many People, Atlas of ourChanging Environment. Nairobi.United Nations Environment Programme (UNEP) andInternational <strong>Centre</strong> for Integrated MountainDevelopment (ICIMOD). 2001. “State of theEnvironment Nepal.” Unpublished database,ICIMOD, Kathmandu.United Nations Environment Programme (UNEP). 1999.“State of the Environment Data Collection andReporting Training for South Asia.” United NationsEnvironment Programme- Environment AssessmentProgramme for the Asia Pacific, Bangkok.———.2001. “Impact of Environmental Information onDecision-Making Processes and the Environment.”Arendal Occasional Paper 01 2001, United NationsEnvironment Programme/GRID-Arendal. Available:http://www.grida.no/impact/papers/fullimpact.pdfUnited Nations Environment Programme (UNEP) andUnited Nations Development Programme (UNDP).1994. Core Environmental Datasets (Vol I and II).Nairobi and New York.United Nations Environment Programme (UNEP-GLOBIO.2005. The Fall of the Water. United NationsEnvironment Programme Regional Resource Center:for Asia and Pacific, Bangkok. URL:www.rccap.unep.prgWoerden, J.V. 1999. “Data Issues of Global EnvironmentReporting: Experience from GEO-2000.” UnitedNations Environment Programme, Nairobi.206 Environment Assessment of Nepal : Emerging Issues and Challenges
Chapter 14Emerging PrioritiesIntroductionThis chapter brings together the issues andpriorities raised in the previous chapters.Because of the environment’s strong linkageswith livelihood activities and people’s wellbeing, inboth rural and urban areas, it can no longer beviewed in isolation as say only overcoming air andwater pollution, critical as these environmentalproblems may be. The challenge for the future is tomove away from narrow sectoral thinking andaction. While efforts to develop organizations withcross-cutting mandates have not been verysuccessful, and sectoral organization will still be thepreferred choice for development activities, thechallenge for integration, coordination, synthesis,aggregation, and disaggregation into sectoralresponsibilities based on a holistic vision and workplan must now be resolved by those responsible forpreparing interactive, up-to-date, knowledge-basedsystems of information networks and systems. Thischapter discusses these key areas of focus in Nepal’senvironmental management.Promoting Integrated EcosystemManagement and SustainableLivelihoodsSustainable Use of Resource Endowmentsand Ecological NichesPast approaches regarding the management ofnatural resources and the reduction of poverty inrural areas of Nepal must be re-examined andreviewed. The Poverty Reduction StrategyProgramme has been given the highest priority in thecurrent Tenth Plan, but the environment and naturalresources have not. This is worrying since thelivelihood of the majority of Nepalese depends onsubsistence agriculture and natural resources.Mountain households are neither able to generateeconomic surplus from subsistence activities nor tofind stable off-farm employment. Unlessemployment and income opportunities aredeveloped locally, the traditional reliance onsubsistence activities is unlikely to alleviate thechronic and growing poverty in the mountain areas.The sustainable way to promote new employmentand income opportunities would be to use theresource endowments and comparative advantagesof ecological niches in a sustainable manner. Thechallenge is to transform the prevailing subsistenceorientedagricultural mode of economic productioninto one complemented by commercial sources ofincome. This will entail providing equitable access togainful and sustainable markets within the scope ofresource endowment and the comparativeadvantages of ecological niches. It will also benecessary to give project implementers sufficientlatitude to discover the best ways to tackle problems,and to remember that this type of approach is stillvery new; the lessons have yet to be learned.Past experience has indicated that biodiversityin rural areas provides many valuable environmentalgoods and services that are fundamental for meetingthe basic needs of the poorest of the poor (MOFSC2002). Agricultural households have understood theneed for integrated management of plants, soil, andwater resources—yet protecting these continues tobe dealt with separately by developmentorganizations. The promotion of economically andenvironmentally sound energy practices, theconservation of energy resources, and thedevelopment of alternative energy systems are allcritical to reducing the pressure on limited naturalresources. Similarly, many green enterprises such asnon-timber forest products (NTFPs), medicinalplants, ecotourism and other income generatingactivities are necessary but cannot continue with adegrading resource base. Understanding thevaluable contribution that traditional knowledge canmake to sustainable resources management,promoting its use, and recognizing it legally willrequire many innovations in institutionalmechanisms. However, all of these changes areunlikely to occur if the local people who are theguardians of the local resources do not have a voiceregarding the access to, control, and management ofthese resources. Seeking opportunities to supportChapter 14: Emerging Priorities207
sustainable livelihoods requires an approach thatcan integrate all the actors by providing each withsufficient latitude for collaborative management.Participatory and Collaborative ApproachThe joint consideration of the ecosystem andlivelihood comes closest to this collaborativeapproach. Focusing on the integrated managementof land, water, and living resources, it seeks topromote conservation and sustainable use in anequitable manner. It recognizes the wealth ofbiodiversity, not only on account of its variety, butalso because of the dynamic processes that occurbetween living organisms and their environment.These processes provide many essential goods andservices that are critical for supporting life. Theecosystem approach embraces cultural diversity asan integral part of the ecosystem, since culturalattitudes to the environment influence many of theother processes that actively affect the ecosystem.People cannot be seen as separate from theirecosystem, and rich and poor all have a role to playas they are all part of the same system. Ensuringcontinued access to essential environmental goodsand services for the poor and ensuring theircontinued collaboration is basic to any system thatseeks to improve their livelihood, since pastexperience has shown that the environmentdeteriorates when users do not own and control theresources (NPC 2003).Nepal includes many different interactingecosystems. Indigenous people evolved appropriateadaptations to seasonal change so that the resourcesin different ecosystems were harnessed throughseasonal migration. In more recent times, withdecreasing transhumance of the population, thisprocess has almost ceased to exist and now eachecosystem is under continuous pressure year-round.Experience has shown that with betterenvironmental management this need not be thecase (NPC 2003). Nepal’s forests, high mountaingrasslands, wetlands, and Siwalik hills are all underdifferent environmental pressures and the challengeis to come up with innovative approaches for theirsustainable management. The Terai Arc Landscapeproject is an important initiative that needs to beclosely studied for its “lessons learned”, particularlyfor the Terai which is the rice bowl of Nepal (MOFSC2002). The Siwaliks are also experiencing tremendouschanges with very far reaching implications, asare the high mountain areas, though many of thesechanges are not well understood (NAP 2002).In the past there was a tendency to categorize allecosystems as either forest or agricultural. Many ruraldevelopment programs did not adequatelyunderstand or recognize the critical role thatenvironmental goods and services play in householdlivelihood strategies (MOFSC 2002). This needs tochange, and some of it is changing already. But clearlyin a mountainous country like Nepal, it is necessary todevelop and promote an approach that integratesboth the ecosystem and livelihood in a unifiedapproach to the rural economy and the environment.Harnessing Ecological, Economic, Cultural,and Institutional OpportunitiesIntegrating ecosystems and livelihood opens up thepossibility of harnessing ecological, economic,cultural, and institutional opportunities. Ecologicalopportunities for successful conservation areprovided by Nepal’s extensive system of protectedareas, which already houses 80 of Nepal’s 1<strong>18</strong>ecosystems. These protected areas contain manyrare and endangered species of flora and fauna.While they face a number of problems, theynevertheless represent an important opportunity forthe conservation of Nepal’s unique natural resourceendowments, and can contribute to environmentalsustainability in terms of soil and water conservation,carbon sequestration, and biodiversity conservation.Equally important to the protection of conservationareas is the protection of their contiguous borderareas. Natural ecosystems are not bound by humandemarcations, and protecting the endangeredspecies within conservation areas requiresprotecting outlying areas that are part of the sameecosystem.The availability of unique natural resourcesmakes it possible to consider and promote economicopportunities such as ecotourism. Small countrieslike Costa Rica have made very effective use of theirnatural resources in furthering economicopportunities, and Nepal needs to learn from thistype of experience. Nature-based sports and outdoorrecreation, for example, have great potential. Someparts of the country have already developed this withconsiderable success and are continuing to do so(IUCN 1999 and WWF 2000), but new areas can alsobenefit from this type of activity, particularly ineastern Nepal where infrastructure has reached agood level of development. In addition, culturalopportunities do not conflict with ecological andeconomic ones. In many historic sites, the culture,the economy, and the environment have functionedquite synergistically in the past, and this could be animportant component of ecotourism in the future.High-value products such as NTFPs, medicinaland aromatic plants, orchids, pheasants, butterflies,and other green-area-intensive products can bepromoted on fragile slopes where landholdings aresmall. Rural markets near growing urban areas haveconsiderable potential for trading these, thus provid-208 Environment Assessment of Nepal : Emerging Issues and Challenges
ing income and employment opportunities for thepoorest of the poor in production and post-productionactivities. NTFPs and medicinal and aromaticplants can be important supplements to the limitedopportunities offered by traditional agriculture.NTFPs are important in the medical and cosmeticindustries. Dabur Nepal (Nepal’s foremost pharmaceuticalcompany) and a number of other firms areleading the efforts in this area (MOFSC 2000, 2002,2003a). In many hill and mountain communities thisis providing an exciting alternative to a nonsustainablelivelihood based on growing cereals.Conservation for supporting sustainablelivelihoods is already being practiced (e.g., KMTNC2002). Future activities might include bio-prospectingand carbon trading. Bio-prospecting is a growingactivity involving the search for new genes orchemicals of commercial value. Carbon trading,although somewhat complicated, could havepotential in the future. If promoted carefully therecould be valuable benefits and an importantopportunity for better integration of ecosystemconservation with livelihood development. Themajor lesson to be learned here is that the localcommunities can become guardians of their ownnatural resources when they are given theresponsibility as well as the support to protect,rehabilitate, and benefit from those resources.Water is a plentiful resource that remainsrelatively underdeveloped. Hydropower hasenormous potential and if developed in conjunctionwith policies to plough back a part of the earningsinto the area, it could also be a very important sourceof income for local livelihood development. Theforests of Nepal have been very important in theeconomy and with proper management sustainablebenefits can be reaped from developing thisresource (MOFSC 2003a).Institutional opportunities are now availablebecause of recent legal changes such as the LocalSelf-Governance Act 1999. Improving ecosystemservices so that the people depending on ecosystemresources can reap their full benefit is the only way toencourage ecosystem conservation and sustainableuse. Without substantial improvements in theseservices, however, there is a great danger that theenvironmental degradation process could acceleratefurther. In the past, the main focus has been on themanagement of an existing stock of naturalresources, particularly in forests. The challenge nowis not only to define ecosystem services in a broaderperspective but also to find ways to augment them.There is a need for better understanding of differentecosystems, updating the biodiversity database ofNepal, and integrating ecosystem management andlivelihood strategies with regional development.Decentralized and Transparent DecisionMakingThe stumbling blocks that remain are monopolies bythe public sector, disabling laws, and extremely slowdecision making by a centralized government.Different local and national opportunities withrespect to resources have been neglected, and this isunlikely to improve without significant changes in themanagement and control of these resources.Regional development planning has also beenneglected. Many of the regional disparities inlivelihoods are linked with the poor commitment toregional development. The ecosystem and livelihoodfocus necessitates a stronger move towards concreteregional development planning and implementationin Nepal. The present conflict in Nepal underscoresthis even more strongly. Unless marginalized andvulnerable groups get better access to availableresources and economic opportunities, they becomeeasy recruits for starting conflicts.Promoting Integrated UrbanEnvironmental ManagementAlthough Nepal is still one of the least urbanizedcountries in the world, the urban population isgrowing rapidly. The population growth rate of theformally designated municipal areas is now 14%, andcensus data show that the urban population growthrate has exceeded the national population growthrate for the past half century (CBS 2003). The urbanareas of Nepal are among the fastest growing in all ofSouth Asia. Urban settlements 1 are expanding rapidlyand new towns are emerging, particularly along thehighways. Two basic factors contribute to thisphenomenon: increasing rural-urban migration andhigh national population growth. Escalation of thearmed conflict that began in 1996 has exacerbatedthis migration as increasing numbers of people fleethe countryside to take refuge in urban areas.The rapid increase of the urban population is,however, not matched by similar increases inproviding and managing urban infrastructure andservices such as roads, water, sanitation, and wastemanagement. More often than not the expansion ofsettlements and the establishment of industries andfacilities has been spontaneous, ad hoc, unplanned,1The definition of urban settlement used in this discussion does not necessarily coincide with the administrative boundaries of municipalities, as it includes semi-urbanand quasi-urban areas. Any settlement that shows a basic urban character can be defined as an urban settlement. Small towns including emerging towns that are notyet formally defined as municipalities are also in fact urban settlements, whereas significant parts of several formally defined municipalities may not have an urbancharacter.Chapter 14: Emerging Priorities209
and haphazard. Population pressures are stretchinglimited infrastructure and services beyond theircapacity. Visible signs include sprawling urbansettlements, congestion, poor or nonexistent sanitaryfacilities, unmanaged dumping of solid andhazardous waste, and degraded and polluted urbanair and water. The most serious adverse effectsattributed to the deteriorated urban environment arerelated to health. Unplanned and haphazardurbanization also encroaches on open spaces,agricultural and marginal lands, and heritage sites.The emergence of urban slums and urban poverty inNepal’s cities is a relatively new phenomenon andstill minor when compared with the problem facedby major cities in South Asia.The Guided Land Development and LandPooling Acts are two government initiatives to planand guide urbanization in some municipalities.These are aimed at facilitating the adjustment of landplots so that space is provided for urbaninfrastructure—roads, water supply, drainage,electricity, and telephone. Provision for urbaninfrastructure in Nepal has been largely driven bycentral sectoral institutions such as the Nepal WaterSupply Cooperation, the Department of Roads, theSolid Waste Management and Resource MobilizationCenter, the Nepal Telecommunications Corporation,and the Nepal Electricity Authority. Recently, after theenactment of the Local Self-Governance Act 1999,municipalities are being increasingly empowered tomanage their urban areas. However, in spite of goodintentions, the municipalities generally lack thecapacity and resources to do so. The TownDevelopment Fund was established in 1997 toprovide financial resources, loans, and technicalassistance to local bodies to help them implementtown infrastructure projects. However, the lack ofcoordination and mutual support among theinstitutions remain the main stumbling block in theplanning, construction, and maintenance of urbaninfrastructure and facilities. Institutional confusionregarding the assignment of responsibility, authority,and handling of resources remains contentious.The Kathmandu Urban Development Projectthat began in 1993 was the first Asian DevelopmentBank (<strong>ADB</strong>)–financed urban sector project in Nepal.An operations evaluation mission evaluated it in 2003(<strong>ADB</strong> 2003) and reached several conclusions:(i) The project was adequately designed from atechnical perspective, but public participationwas not sufficient to ensuresustainability.(ii) The land pooling scheme devised in theproject has become a model for other landpooling schemes. An integrated environmentalmanagement system that couldcomprise water supply, groundwaterrecharge, rainwater harvesting, wastewaterrecycling, and wastewater treatment couldalso be implemented.(iii) Population in the project area exceeded theprojection, resulting in overuse of infrastructureor its inadequacy. Infrastructure waspoorly maintained. Maintenance requiresadequate financing (one source of whichcould be property tax) and institutionalcapacity (training and capacity building ofstaff, and so on).(iv) Community networking and training shouldcontinue beyond initial project implementation.Nongovernment organizations (NGOs)can play a crucial role in building awarenessof proper operation and maintenance.Since completing the Kathmandu UrbanDevelopment Project, the <strong>ADB</strong> has financed severalother projects related to the urban sector. Theseinclude the Melamchi Water Supply Project ($120million), Small Towns Water Supply and SanitationSector ($35 million), Kathmandu Valley Water ServicesSector Development Program ($10 million), andUrban and Environment Improvement ($30 million).Other donors have also provided support for urbaninfrastructure and services. For example, GermanTechnical Cooperation (GTZ) supported solid wastemanagement in Kathmandu, and urban developmentthrough local efforts in several municipalities; UnitedNations Development Programme (UNDP) and theWorld Bank supported the Metropolitan EnvironmentImprovement Programme; Danish InternationalDevelopment Agency (DANIDA) supported theEnvironment Sector Programme Support; and theEuropean Union supported the Kathmandu ValleyMapping Programme.Important lessons regarding urban environmentalmanagement in Nepal can be derived bothfrom donor-supported programs and from the smallscaleenvironmental activities of NGOs. These twosectors have been involved in converting waste intoresources (through composting, making briquettesfrom waste, paper recycling, management of solidwastes by communities, and others), in promotingalternative approaches to waste/sewage treatment,and in addressing the needs of the urban poor(including slums and squatters’ quarters). Integratedenvironmental planning and management can alsobenefit from the process of integrated actionplanning 2 tried in some municipalities.2Integrated action planning is based on people’s participation. Ward level community meetings are the cornerstone of this approach. Other features are mobilisationand participation of the community in the identification, prioritisation, and programing of municipal development activities and making the planning process more peopleoriented.210 Environment Assessment of Nepal : Emerging Issues and Challenges
Urban development and management in Nepallack both an integrated, holistic approach and a longtermvision. Although master plans have beenprepared for some municipalities, implementation ofthese has been weak and generally unsatisfactory.Most past efforts have been sectoral anduncoordinated rather than integrated. A trulyintegrated and holistic approach should therefore bepromoted for urban environmental planning andmanagement to make urban areas better places tolive.There are obvious linkages andcomplementarities among the various urbaninfrastructures and services; if these were integratedand coordinated properly, the synergistic effectscould be enormous. For example, solid wastemanagement is linked with air pollution and thefunctioning of drainage. A truly integrated andholistic approach, however, should not be limited tointegrating and coordinating infrastructure andservices, but should include wider concepts ofintegration like the following:(i) Planned land use with due considerationgiven to environmental attributes (urbanecology, environmental setting of urbansurrounding areas, open spaces, religiousand cultural heritage, conservation of water,agricultural lands, and other resources).(ii) Introduction of waste reduction/reuse/recycling in keeping with environmentallyfriendlypractices.(iii) Raising public awareness regarding theenvironment, health, and appropriatepractices and behaviors.(iv) Promoting participation and partnershipamong communities, civil society, NGOs,community-based organizations (CBOs),and the private sector in environmentalplanning and management.(v) Addressing urban poverty and the needs ofthe urban poor.(vi) Introducing a “polluter pays” principle thatcan generate revenue for urban environmentalmanagement.It is necessary to strengthen the municipalities,local bodies, and competent authorities forintegrated urban environmental management; andto develop appropriate tools, and human andfinancial resources. It may also be necessary toreinforce the legal framework for promoting land-useplanning, participation by stakeholders, and ensuringcoordination and cooperation.Such integrated urban environmental planningand management can build upon the experiencesgained in the country and outside. The experienceacquired from the <strong>ADB</strong>-funded Urban andEnvironment Improvement, and Small Towns WaterSupply and Sanitation Sector projects, both of whichinvest in urban areas outside Kathmandu, can beuseful (<strong>ADB</strong> 2002, <strong>ADB</strong> 2000). Initially the best ofthese ideas on integration can be piloted in small andemerging towns where the problems are still not verycomplicated. The integrated approach could then bepromoted in bigger cities like Kathmandu wheregreater and more concerted efforts are necessary.For example, satellite settlements may be planned,developed, and managed at several locations inKathmandu Valley taking into consideration all oftheir environmental attributes and implementing thewider concepts of the integrated approach. Thesesettlements could then be linked to the main citythrough radial roads from the current ring road—theradial roads can also link to the outer ring roadwhose development is being supported by theGovernment of the People’s Republic of China.A related program may be designed to reforestthe hills around Kathmandu Valley; this would have anumber of environmental benefits, includinggroundwater recharge and ecotourism promotion.Possible areas of synergy include the <strong>ADB</strong>-fundedMelamchi Water Supply Project and the KathmanduValley Water Services Sector Development Program,which aim to improve water supply and sanitationsituation; these could be coordinated with upcomingprojects in solid waste management supported byJapan International Cooperation Agency (JICA).Institutional Strengthening andCapacity BuildingAbout half of the prevailing key environmental lawsnow in force in Nepal (Appendix 14.1) date fromafter 1992 when the Ministry of Population andEnvironment (MOPE, since 2005 absorbed into thenewly-formed Ministry of Environment, Science andTechnology [MOEST]) was first established.Widespread public concern over pollution led tolegislation to curb emission of effluents and airbornepollutants; while concern over the depletion ofnatural resources led to legislation for thepreservation of conservation areas such as nationalparks and wildlife areas with special biodiversityvalue. While the laws exist in principle, institutionalweaknesses continue to prevent their effectivemonitoring and implementation.Institutions at all levels are weak, including theNational Planning Commission (NPC), lineministries, local governments, and villagecommittees. The requisite technical skills arecommonly lacking and poor morale is a systemicChapter 14: Emerging Priorities211
issue. These deficiencies stem from the generalweakness of the public administration system itself—over-staffing, low salaries, political interference inappointments and transfers, inadequateperformance recognition, and others are systemic.These in turn affect resource management. Thecapacity to monitor the implementation of laws andpublic expenditure is weak at all levels. Inadequatesupervision, poor financial management, dilatorygovernment procedures, and lack of coordinationamong government entities all lead to poorperformance generally and to a serious neglect ofenvironmental issues in particular.Nepal needs to build up its capacity for nationaland regional development so that it can participateeffectively in the global economy. There is a need tostrengthen the public and private sectors,institutions, systems, processes, procedures, andpractices that support development efforts. Improvedcapacity is needed to entrench and sustain goodgovernance, design and manage effective policiesand programs, manage the environment, addresspoverty, and apply science and technology todevelopment problems. Capacity is also needed toaccelerate regional development and for Nepal toparticipate with other regions as an effective partnerin the global economy.Policy ReformsNepal began its work in environmental protectionand conservation of natural resources in the 1970s.However, the policies, strategies, plans, andprograms of the ensuing 30 years have not beenoverwhelmingly effective. The policies themselveswere unable to address cross-cutting issues;continuous interference by political parties, theinability of national level advisory bodies to functionproperly, and the inability of policy-level institutionsto implement policy due to lack of fundamentalresources all contributed to this failure. Key nationalagencies like the NPC and sectoral ministries havenot been proactive in implementing approvedpolicies and programs, and the Government hasfailed to attract the participation of the private sector.These shortcomings in policy planning andimplementation should be addressed quickly by (i)reviewing all existing policies on the environmentand updating them as needed to make them relevantto present needs, (ii) revisiting monitoring andimplementation mechanisms, (iii) attracting thebroader participation of private sector institutions,NGOs, local bodies, and community-basedorganizations (CBOs) in the process, and (iv)coordinating national environmental policies withdonors’ policies where possible.Institutional StrengtheningStrengthening environmental institutions involvesovercoming existing endemic weaknesses andrevitalizing institutions. In this regard a TechnicalAssistance (TA No. 2847-NEP) on InstitutionalStrengthening of Ministry of Population andEnvironment was provided by <strong>ADB</strong>. One of therecommendations from this Technical Assistancewas implemented as the Integrated EnvironmentManagement Program and funded by DANIDA. Inspite of this, various other aspects still need to beencouraged.Major stakeholder institutions in theenvironment sector include public sector bodies,corporate bodies, and others operating outside of thepublic sector (see Appendix 14.2). The unsatisfactoryperformance of these institutions is due largely totheir lack of capacity. These institutions are weakand their organizational structures often do not fullycorrespond to their mandates. Advisory bodies oftendo not perform professionally, and policymaking andcorporate bodies are often not held accountable.These institutions also suffer from a lack of skilledprofessionals, lack of funds, shortage of technicaland logistic facilities, weak interagency coordination,and conflicting and overlapping mandates. At thesame time, the Government has failed to empowermunicipalities and to creatively engage privatesectororganizations such as national andinternational NGOs, local bodies, and communitybasedorganizations in meaningful dialogue.MOEST is already overburdened by its role offormulating and implementing policies, plans, andprograms. It might be possible to alleviate some of thisburden and to streamline the environmentalmonitoring process by empowering and strengtheninglocal bodies and institutions to take over some of theroutine monitoring tasks. MOEST would remain themain coordinator of these efforts without having todirectly implement them, and could encourage agrowing pool of environmental experts to superviseimplementation of measures to mitigateenvironmental impacts. As the expertise of this groupgrows, they will increasingly be able to give field-levelfeedback to MOEST and to advise it on environmentalpolicy. Similarly, district development committees(DDCs) and village development committees (VDCs)can be empowered to act more autonomously withinthe framework of local self-governance and can begiven the tasks both of bringing environmental andnatural resource management concerns to theattention of MOEST and of carrying out some localenvironmental monitoring. Involving the VDCs wouldgo a long way to ensuring that information acquiredthrough broader public consultation was brought tothe attention of policymaking bodies.212 Environment Assessment of Nepal : Emerging Issues and Challenges
To overcome the constraints imposed byconflicting mandates, it might be necessary to reviewcritically the existing legislative measures, devisetheir enforcement modalities, and consolidate alllegal provisions under a single comprehensiveumbrella legislation. Such integration might facilitategovernance and harmonize the regulation of allenvironmental actions taken nationwide. Anotherpossibility would be to consider the establishment ofa National Pollution Control Board/Authority (to be atleast partially managed by the private sector) whosechief responsibility would be to oversee pollutionissues and enforce compliance with environmentalstandards. Similarly, with growing awareness on thepart of the public it may now be timely to considercreation of an independent Environmental RightsCommission to protect the environmental rights ofcitizens.Technical training is needed at all levels, andMOEST and other agencies involved in environmentalmonitoring need more and better skilledprofessionals to carry out their mandates. Theseneed to have career development opportunities andto be encouraged and rewarded. They also need tobe supplied with appropriate tools and equipment sothat they can carry out their assigned tasks. Researchand laboratory equipment are in short supply allaround, and this situation needs to be addressed.Improvements to the Legislative SystemA large number of environmental acts andregulations have been promulgated in Nepal (seeChapter 9) to facilitate the implementation ofenvironmental plans and programs, but these havehad only limited success. This legislation now needsto be updated and amended to make it responsive tothe present-day requirements of complex environmentalconcerns. In addition, new regulations areneeded to help Nepal take full advantage of WorldTrade Organization (WTO) membership.Trade and EnvironmentNepal recently became the 147th member of theWTO. The main aim of membership is to improveNepal’s economy by opening up trade with theworld. Before being able to reap the full benefits thatWTO membership implies, policymakers andbusinessmen need to be aware of how to make themost of these opportunities and how not to beovercome by open trading. One of the commitmentsmade by Nepal was to amend the EnvironmentProtection Act 1996 to compliment requirements ofWTO agreements related to trade and environment;this is discussed below. Nepal also needs to developadditional environmental standards for protectinghuman and plant life, and to consider issues liketrade related intellectual property rights (TRIPS),which have threatened the rights of developingcountries’ farmers rendering them more vulnerableand marginalized. Another thorny and delicate issueunder the WTO is that of agricultural subsidies,which many poor WTO members believe harm theirexports. Building the capacity of environmental cellsin the Federation of Nepalese Chambers ofCommerce and Industries and other majorassociations of commerce and industry will berequired. Industries should be motivated to adoptand comply with International StandardsOrganization (ISO) standards and ecolabeling ofindustrial products.Enforcement of Environmental LawsThe environmental laws and regulations that do existare only weakly enforced. Nepal’s poor performancein the environmental sector has, in large part, beenthe failure to fully empower regulatory bodies toenforce regulations, monitor compliance, andimpose penalties. The environmental commitmentof institutions nominally responsible for enforcement,such as NPC and MOEST, is weak andenforcement is piecemeal; there is a lack ofcoordination among the different agencies.A strong institutional base is needed to monitorand strengthen the legal instruments applied toenvironmental conservation. In many cases lawenforcement is thwarted due to poor institutionalinfrastructure, the lack of institutional decentralization,or the constant shifting of responsibilities fromone institution to another. A strong, transparent, andeffective monitoring system is needed to supportproper enforcement of laws and regulations. Forexample, to comply with international treaties, a listof rare and endangered species has been prepared.The difficulty, however, is that there is no scientificmonitoring to ascertain whether these species areactually still endangered or rare. Surveillance of legalinstruments both internationally and nationally islacking. Creating a repository of all the relevantenvironmental information in the country andmaking it accessible to all stakeholders throughelectronic means would help to make the systemmore transparent and easier to enforce. The sectionbelow on an “Environmental and Natural ResourcesInformation Network” begins to address this issue.Strengthening the EIA/SEA FrameworkUnder the provisions of the Environment ProtectionAct and Environment Protection Regulations, thetechnical, industrial, and socioeconomic impacts ofdevelopment projects on the environment and theChapter 14: Emerging Priorities213
population must be assessed. MOEST must approvethe requisite environmental impact assessment (EIA)reports before any project is started. Projects withoutsignificant environmental impacts only need aninitial environmental examination (IEE) to beconducted by relevant agencies. The NPC hasadopted and applied the concept of strategicenvironmental assessment (SEA) for projectdevelopment policies and programs included in theTenth Five-Year Plan (2002–2007). While the EIAassesses environmental impacts of developmentprojects at the project level, the SEA assessesimpacts at the planning, policy, and programmingstages and can be used in evaluating strategicproposals for appropriate decision making.EIA and SEA capacity issues are acute. The EIAis still largely considered to be an “add-on” projectburden, and EIA reports are commonly based oninadequate data. Although the then MOPE (nowMOEST) has already approved 25 EIA reports fromdifferent projects, it has not been able to monitor theproposed mitigation of identified impacts, and thereis no indication that its successor MOEST will do anybetter. Recent experience based on a cross-sectionof development projects shows that the EIA processis usually enforced only as part of the initial approvalprocess. The problems come later at theimplementation stage. Some common constraintsfaced during implementation of EIA measures aresummarized in Appendix 14.3.Capacity development in augmenting,mobilizing, and enhancing Nepal’s EIA and SEAcapability must be strengthened. The knowledge,tools, and skills necessary to operate an EIA or SEAsystem to an acceptable level of performance mustbe developed. The scope of capacity developmentcan range from establishing preconditions for EIA orSEA development to benchmarking good practices.Supporting measures include research, policyanalysis, institutional design, information exchange,training and skills transfer, building networks,professional development, and guidance onimplementing good practices. Appendix 14.4presents some operational problems identified in theimplementation of the EIA process, together withrecommended solutions.Environmental and NaturalResources Information NetworkInformed decision-making must be based onaccurate data and information. The synthesis andanalysis of basic environmental data yields theinformation that is the precondition for developing apolicy framework, policy design, and the plans andprograms for environmental and natural resourcemanagement. As the population at large becomessensitized to environmental issues, there is a growinginterest in analytical data on the environment. Thedemand for environmental information is escalatingand governments and other stakeholders in civilsociety have been the driving forces both on thesupply and the demand sides. Good, reliable data onNepal is clearly recognized by all stakeholders as afundamental tool for development.Although over the years considerableenvironmental data and information have beencompiled by various institutions, aid projects, andindividual researchers, this information has beendifficult to access. Data appear in isolated reports,and are often dispersed, heterogeneous, andinaccessible; more often than not, they areinsufficiently relevant in terms of continuity andreliability. Without an appropriate framework andmechanisms for data sharing, time and resources arewasted in the duplication of efforts. Public andprivate environmental institutions and bodies inNepal have accumulated environmental data andinformation on natural resources and environmentalconditions. These databases lack a centralized datapool and unified standards. At the national level thereis no national information database integrating all thedata, nor are there any data linkages that wouldallow the sharing of the existing information.An environment and natural resources informationnetwork must be established to facilitate theexchange of information, strengthen appropriatepolicymaking capacities, and be a real tool in theattempt to tackle environmental problems. A unifiedrepository would collect all established databases ofmajor environmental concerns with the participationof government, nongovernment, and academicinstitutions; the private sector, and otherstakeholders. Such a network, which would integratedata and information from decentralized providersand make them available to a multitude of users, isan interesting concept, and doubtless a useful one,but one that needs to be strictly managed to make itviable. Some potential management issues aredescribed below:(i) Initially, the existing structures need to beassessed and the capacity of the differentagencies reinforced to allow them to moreeasily generate and handle multisectoralenvironmental and natural resources dataand information.(ii) Sectoral agencies need to be coordinated sothat the data and information collected aresystematic and conform to a consistentinformation structure that ensures qualityand reliability.214 Environment Assessment of Nepal : Emerging Issues and Challenges
(iii) Socioeconomic and other sectoral data andinformation can then be harvested to derivepolicy-relevant aggregated indicators formajor environmental issues at the local andnational levels.(iv) An integrated environmental decisionsupportsystem focused on priorityenvironmental issues can then be developedto bring together existing knowledge andhelp to facilitate assessments, trends, andprojections in the area of environmentalprotection.(v) To maximize its usefulness, Nepal’s centralrepository of information would then need tobe networked and linked with differentregional and international agencies and withother well-developed and manageddatabases dealing with similar types ofinformation.Many issues—in particular, environmentalissues such as loss of biodiversity, glacier melting,soil erosion, air pollution, and flooding—transcendnational boundaries. Actions to combat these in onecountry often have profound regional or globalramifications. This is especially true regarding theenvironmental degradation and depletion of naturalresources that have intensified in the recent past. Indeciding on specific actions at the national level, it isnecessary also to carefully assess regionalimplications to avoid harming other countries. It isalso necessary to strengthen a sense of collectiveownership and responsibility for the environmentalchallenges faced in the <strong>Himalayan</strong> region. There isan urgent need to pursue effective measures ofregional cooperation to establish a regional networkfor effective sharing and exchange of information forsustainable decision-making on key transboundaryenvironmental problems.BibliographyAsian Development Bank (<strong>ADB</strong>). 2000. Report andRecommendation of the President to the Board ofDirectors on a Proposed Loan to the Kingdom ofNepal For The Small Towns Water Supply a n dSanitation Sector Project. Manila. Available:http://www.adb.org/documents/RRPs/NEP/rrp-1755-nep.pdf———.2002. Report and Recommendation of the Presidentto the Board of Directors on a ProposedLoan to the Kingdom of Nepal For The Urban andEnvironmental Improvement Project. M a n i l a .Available:http://www.adb.org/documents/RRPs/NEP/rrp_nep_32239.pdf———.2003. Project Performance Audit Report on theKathmandu Urban Development ProjectManila. Available: http://www.adb.org/documents/PPARs/NEP/ppar_nep_24321.pdfCentral Bureau of Statistics (CBS). 2003. PopulationMonograph of Nepal, Vol. I. Kathmandu.IUCN (The World Conservation Union). 1999. ConservationStatus of Siwalik Area of Ilam District. Kathmandu.King Mahendra Trust for Nature Conservation (KMTNC).2002. Annual Report. Kathmandu.Ministry of Forests and Soil Conservation (MOFSC). 2000.“Revised Forestry Sector Policy.” Draft, Ministry ofForests and Soil Conservation, Kathmandu.———.2002. Nepal Biodiversity Strategy. Kathmandu.———.2003a. National Wetlands Policy. Kathmandu.———.2003b. “Nepal Biodiversity Strategy ImplementationPlan.” Draft, Ministry of Forests and SoilConservation, Kathmandu.National Action Program (NAP). 2002. “National ActionProgram Formulation Process.” Report of theNational Workshop on Sustainable LandManagement, organized by Ministry of Populationand Environment, United Nations Convention toCombat Desertification, and Global Mechanism,Kathmandu.National Planning Commission (NPC). 2003. SustainableDevelopment Agenda for Nepal. Kathmandu:His Majesty’s Government of Nepal, NationalPlanning Commission and Ministry of Population andEnvironment.World Wide Fund for Nature (WWF). 2000. WWF in Nepal:Three Decades of Partnership in Conservation(1967–2000). Kathmandu.Chapter 14: Emerging Priorities215
Appendix 14.1: List of Key Environmental Laws and Related Legislation inNepalFor completeness, this list includes some Acts that have been superseded by later Acts and are no longer inforce. Only some amendments have been listed.Ancient Monument Protection Act, 1956Private Forests Nationalisation Act, 1957Forest Protection Act, 1956Civil Aviation Act, 1958Aquatic Animals Protection Act, 1961Forestry Act, 1963Forest Protection (Special Arrangements) Act, 1967Plant Protection Act, 1972National Parks and Wildlife Conservation Act, 1973 (amended 1974, 1982, 1989, 1993) and Regulations, 1974Public Roads Act, 1974Tourism Act, 1978King Mahendra Trust for Nature Conservation Act, 1982Decentralisation Act, 1982Mines and Minerals Act, 1985, and Regulations, 1999Soil and Watershed Conservation Act, 1982, and Regulations, 1985Nepal Petroleum Act, 1983Solid Waste Management and Resource Mobilization Act, 1987Pashupati Area Development Trust Act, 1987Seeds Act, 1988, and Regulations, 1997Kathmandu Valley Development Authority Act, 1988 (not enforced)The Constitution of the Kingdom of Nepal, 1990Pesticides Act, 1991Industrial Enterprises Act, 1992Social Welfare Act, 1992Labour Act, 1992Water Resources Act, 1992, and Regulations, 1993Vehicle and Transport Management Act, 1992, and Regulations, 1997Electricity Act, 1992,and Regulations, 1994Forest Act, 1993 (amended 1999), and Regulations, 1995 (amended 2001)Environmental Impact Assessment Guidelines, 1993Environmental Impact Assessment Guidelines for the Forestry Sector, 1995Nepal Civil Aviation Authority Act, 1996Buffer Zone Management Regulations, 1996, and Guidelines, 1999Nepal Tourism Board Act, 1996Environment Protection Act, 1996, and Regulations, 1997 (amended 1999)Town Development Fund Act, 1997Drinking Water Regulations, 1998Local Self-Governance Act, 1999, and Regulations, 2000216 Environment Assessment of Nepal : Emerging Issues and Challenges
Appendix 14.2: Some Common Constraints Faced by Nepal inImplementation of Environmental Impact Assessment: OperationalProblems and their SolutionsBased on the experiences of MOEST and other environmental agencies under the Government of Nepal,the following constraints and operational problems in execution of EIA related management plans have beenidentified in the country. Some recommendation solutions for resolving the operational problems have beenprovided here under.Constraints faced(i) There is a need for amendments of the provisions and clauses of the Environment Protection Act (EPA)and Environment Protection Regulations (EPR) themselves, to make them clearer and easier to follow(ii) There are procedural delays within MOEST (formerly MOPE) whose accountability has never beenquestioned,(iii) Due to lack of competent staff, MOPE failed to carry out the needed interventions in the EIA process,The newly formed MOEST will have to be more proactive in this regard.(iv) There are technical difficulties in organizing public hearings at sites that delays the approval process,(v) No concern has been demonstrated by apex agencies like NPC and NEPC about the ongoingunsatisfactory status of implementation of the EIA process,(vi) Many sectoral agencies are carrying out the EIA process as a formality and due to the inability in the pastof MOPE to administer and monitor the mitigation measures, the agencies concerned escapedpunishment. MOEST will have to be more attentive in tackling these issues.(vii) There are grievances from proponents and developers that the overall time required for following theprocess and preparation of EIA reports and their approval is too long.(viii) In many cases, mitigation measures identified in the EIA reports are not undertaken, and the experienceof one completed project is not taken into consideration while preparing and approving EIA reports forother projects.Operational problems and their solutionsProblems(i) There are inconsistencies and complexities in Schedules, which include list of projects requiring initialenvironment examinations (IEE) or EIA, format for terms of reference, and IEE and EIA reports. Some ofthe proposals requiring IEE or EIA are unclear and misleading.(ii) The environmental law is silent about the time limit for the implementation of an EIA report. Forexample, the proponent may prepare an EIA report and then process it for implementation after asignificant time lapse. In such cases, baseline conditions may change and many of the impacts andcorresponding mitigation measures will also have to be altered.(iii) The format and content of the Scoping <strong>Document</strong> has not been issued, which has reduced reportquality. In recent years, copying of (EIA) reports and their duplication has been a major problem.(iv) The reviewing agencies are unclear about the aspects to be reviewed in the Scoping <strong>Document</strong> and finalEIA report due to lack of review guidelines and criteria. In most cases, consultants and practitioners arereluctant to review and redo the reports to improve their quality.(v) In linear projects, a number of village development committees (VDCs) or municipalities may beaffected. The law is unclear about the number of public hearings to be carried out at the project site,and number of recommendation letters of VDCs or municipalities to be submitted to the approvingagency.(vi) Most EIA reports have not shown linkages between the baseline conditions, environmental impacts,mitigation measures, and monitoring requirements.Chapter 14: Emerging Priorities217
(vii) The EIA report approving agency MOEST, has not been adequately effective in issuing directives ontechnical matters due to lack of competent and knowledgeable staff in the respective fields.(viii) Environmental auditing by MOEST is usually meant to be undertaken two years after thecommencement of the services of the projects, but the requirement is vague and provides opportunitiesto MOEST to delay environmental monitoring of the projects.(ix) In many cases implementation of the environmental management plan approved in the EIA report isdeferred. In some cases, EIA has been carried out after completing the detailed design of a project justto comply with the legal provisions.Solutions(i) Amendment of the Environment Protection Regulations, particularly its Schedules(ii) Development of procedures for review of EIA reports, monitoring, and environmental auditing;establishing procedures for review of EIA reports by independent experts could be useful(iii) Organize exposure/orientation programs on EIA procedures for senior decision makers(iv) Launch special training courses for EIA practitioners and reviewers and officials involved in the process(v) Make provisions for remunerating reviewers of EIA reports, independent monitors, and auditors ofimplementation of mitigation measures(vi) MOEST should be supported in terms of funds and facilities to conduct monitoring of mitigationprograms and conduct environmental auditing of completed projects(vii) Provide logistics, vehicles, and other facilities to encourage site-visits before EIA report approval,conduct surveillance monitoring, and so on2<strong>18</strong> Environment Assessment of Nepal : Emerging Issues and Challenges
Annex: Millennium DevelopmentGoals and the Environment inNepalBackgroundThe Government of Nepal endorsed the United Nations Millennium Development Goals (MDGs) inSeptember 2000 together with <strong>18</strong>8 other nations. However, the “MDG Progress Report 2002” points out thatonly two targets—improving safe drinking water and reducing child mortality—are likely to be met by the2015 deadline.This weak performance, not only of Nepal but also of many other developing countries, led to theintroduction of an MDG needs assessment in the individual countries. The Needs Assessment looks at the timeboundtargets, determines their implications for resources, examines linkages with ongoing development plans,for example in Nepal the Tenth Plan and the Poverty Reduction Strategy Plan. This exercise has been carried outin a number of countries already, and a methodology has been developed that has permitted a more realisticidentification of the interventions and investments required to achieve the goals.Environment and the MDGsMillennium Development Goal 7Millennium Development Goal 7 is to ensure environmental sustainability. According to Task Force 6 onEnvironmental Sustainability, this means the ability of communities of plants, animals, microorganisms, andtheir nonliving surroundings to sustain themselves and people far into the future. It includes providing criticalecosystem goods and services to people and other species.There are three targets under Goal 7: Targets 9, 10 and 11.Target 9: Integrate the principles of sustainable development into country policies and programs andreverse the loss of environmental resources.The indicators for monitoring progress are:(i) proportion of land area covered by forest,(ii) ratio of area protected to maintain biological diversity to surface area,(iii) energy use (kilogram oil equivalent) per $1 GDP in purchasing power parity dollars,(iv) carbon dioxide emission per capita and consumption of ozone depleting CFCs in tons, and(v) proportion of population using solid fuels.Target 10: Halve by 2015 the proportion of people without sustainable access to safe drinking water andbasic sanitation.The indicators for monitoring progress are:(i) proportion of population with sustainable access to an improved water source, urban and rural, and(ii) proportion of population with access to improved sanitation, urban and rural.Target 11: Achieve a significant improvement in the lives of slum dwellers by 2020.The indicator for monitoring progress is:(i) proportion of households with access to secure tenure.Other Millennium Development GoalsIn addition to the targets directly related to environmental sustainability, there are a number of targets undereach of the other goals that have direct or indirect environmental implications.Annex219
Goal 1: Eradicate extreme poverty and hungerMost of the poor live in environmentally fragile areas: erosion-prone hillsides, semiarid lands, and tropical forest.In most instances the poor lack control over and access to natural resources. Many environments are alreadyhighly degraded, making it difficult to meet increasing demands for fuelwood, food, fiber, fodder, and others.Any strategy to reduce poverty and hunger cannot overlook these environmental concerns. The environmentaldimensions of the Poverty Reduction Strategy Plan in Nepal need to be reexamined.Goal 2: Achieve universal primary educationThis goal has no negative impact on the environment. Including environmental awareness in primary educationcould have strong benefits for the environment in the long run.Goal 3: Promote gender equality and empower womenIt is critical to make women knowledgeable about the environment and conservation of biodiversity. Limitedavailability of natural resources adversely impacts women’s work. Birth rates tend to be higher, children lesshealthy, and population growth more rapid where environments are degraded, leading to further pressures onbasic natural resources for livelihood.Goal 4: Reduce child mortalityAwareness of environmental sanitation may be critical. Better kept environments lead to better conditions ofnatural resources like water.Goal 5: Improve maternal healthSanitation is critical. Improved biodiversity may enhance nutrition and local availability of natural remedies.Goal 6: Combat HIV/AIDS, malaria, and other diseasesUnderlying environmental conditions—particularly waterborne and other infectious diseases—affect health.Good watershed management and pollution control are important. The relationship between infectious diseaseand changing environmental conditions needs to be studied more carefully. Availability of medicinal herbs fortreating local health problems requires conserving biodiversity.Other Key PointsIn addition, a number of other key points may be noted:(i) Activities with short-term benefits could have negative long-term environmental impacts that are noteasy to mitigate. These impacts could lead to other consequences in terms of time (future), space(downstream), and sector (industry’s impact on water or land).(ii) It can be very difficult to motivate people to make environmental investments, as effects may occursomewhere else and not be felt immediately. By their very nature as public goods, the use ofecological services cannot be restricted to some and excluded to others.(iii) Environmental sustainability requires dealing with immediate problems as well as taking a longtermperspective.(iv) Environmental problems have various spatial dimensions (upstream–downstream), which need tobe understood and approached appropriately.(v) There are many global aspects to environmental change that should be dealt with at the global level.For all these reasons environment is truly a crosscutting theme and relevant actions cannot be limited to afew areas. Environmental issues must be consciously addressed at every level of decision making. Withoutenvironmental sustainability, MDGs—even if they are reached in the short run—may face problems in the longterm. It is equally true that, without meeting the MDGs, environmental sustainability may not be feasible.220 Environment Assessment of Nepal : Emerging Issues and Challenges
Environmental Mainstreaming in the MDGs for NepalEnvironmental diversity and fragility are two sides of the coin in Nepal. If diversity has endowed the country withan amazing variety of ecosystems and scenic environments, these are delicately balanced by strong linkagesbetween the different components which are easily disrupted. Once disrupted, ecosystem degradation is swiftand people have realized through bitter experience that livelihood disruptions can follow very quickly. Whilesome disruptions are natural consequences of changing weather or natural cycles, human impacts are alsobecoming important. A rapidly growing population, increasing urbanization, transport links, industrial activities,and developmental activities are contributing to environmental damage. The Government is making efforts onseveral fronts to deal with these problems but, while some notable decisions and impacts are evident, theproblems are serious and increasing.Since the early 1980s, the Government of Nepal has made several efforts to integrate environmentalconcerns into national development plans and programs. The Environment Protection Council (EPC) wasestablished in 1993 and the Ministry of Population and Environment (MOPE) in 1995 to further develop andimplement environmental policies and programs. Since then, there has been some progress in developinglegislation, introducing environmental impact assessments, promulgating the Nepal Environmental Policy andAction Plan, enacting the Environment Protection Act 1996 and the Environment Protection Regulations in 1997,and developing standards to minimize the adverse effects of development activities on environment and health.In addition, the Government has made a commitment to pursue an integrated policy to achieve sustainabledevelopment objectives. To meet the goals of Agenda 21 and the MDGs, the Government of Nepal hasestablished the National Commission for Sustainable Development under the chairmanship of the PrimeMinister. New policies and strategies are emerging, such as the National Wetland Policy, Terai Arc LandscapeStrategy, Code of Conduct for Biodiversity, and the Action Plan for Herbs.Nepal is actively participating in the MDG program. The National Planning Commission (NPC) of HMG, withthe support of United Nations Development Programme (UNDP), is monitoring the progress being made inimplementing the MDGs.Progress regarding the achievement of the MDGs is at best mixed. With increasing economic difficultiesand the continuing conflict, there are serious doubts regarding the fulfilment of the MDGs. UNDP’s MDG ProgressReport 2005 has assessed Nepal’s progress towards the MDGs and indicated a generally weak but improvingsituation. The disruption in economic activities and service delivery because of the persisting conflict has madethe scenario even grimmer, requiring a careful reassessment of the efforts to successfully implement the povertyreduction strategy plan and the Tenth Plan, and monitor the progress on the different MDGs. A special concernhere is Goal 7, Ensure environmental sustainability. While the other MDGs directly relate to different sectors,some like poverty and environmental sustainability cut across them. Furthermore, environmental issues mayoften be in conflict with some of the proposed sectoral measures. UNDP has commenced an exercise toimprove the monitoring of progress related to the MDGs. This is a critical exercise and, if integrated with theimplementation of the Tenth Plan, could provide an excellent monitoring mechanism as well as a soundingboard for appropriate policy responses. Better integration of environmental components in this continuingexercise is fundamental to ensuring environmental sustainability.Although Goal 7 has been listed as ensuring environmental sustainability and some targets have beenidentified, this is clearly not enough for a number of reasons. First, there are environmental implications to othertargets besides those indicated in Goal 7. For example, Indicator 25 deals with the proportion of land areacovered by forest but, to meet Target 1, the share of forest area under community control may be important. Thereal challenge is to take each target and its indicators and to see if a realistic, measurable sub-indicator forensuring environmental sustainability can be identified. This will assist in indicating the cost being imposed onthe environment in fulfilling different MDGs. Goal 7 alone cannot ensure environmental sustainability if theenvironmental implications of the other MDGs are neither understood nor tracked over time. A systematic intersectoralreview of all the different aspects will help to develop the environmental sub-indicators for each of thetargets.The MDGs should not be seen as separate from the country’s regular development plans. At present, thedifferent line agencies that actually report on the progress of their sectoral activities do not appear to haveinternalized the MDGs.Poor implementation of existing laws and regulations, virtually no monitoring of environmental problemsand issues, lack of scientific data on some of the standards and site-specific parameters, and limited budgets forimplementing environmental programs are continuing difficulties. Without addressing these issues, it is unlikelythat environmental sustainability will improve.Annex221
Nepal’s Progress Towards the MDGs: Status at a GlanceGOALS WILL DEVELOPMENT GOAL BE REACHED STATUS OF SUPPORTIVEENVIRONMENT1 A. Extreme PovertyHalve the proportion of peopleliving below the national povertyline by 2015Likely Potentially Unlikely Lack ofdataStrong Fair Weak butImprovingWeak1 B. HungerHalve the proportion of peoplewho suffer from hunger between1990 and 2015Likely Potentially Unlikely Lack ofdataStrong Fair Weak butimprovingWeak2. Universal Primary EducationEnsure the by 2015 childreneverywhere, boys and girls alike,will be able to complete a fullcourse of primary schoolingLikely Potentially Unlikely Lack ofdataStrong Fair Weak butimprovingWeak3. Gender and EqualityAchieve equal access for boys andgirls to primary and secondaryeducation by 2005 and to all levelsof education no later than 2015Likely Potentially Unlikely Lack ofdataStrong Fair Weak butimprovingWeak4. Child MortalityReduce under-five mortality bytwo-thirds by 2015Likely Potentially Unlikely Lack ofdataStrong Fair Weak butimprovingWeak5. Maternal HealthReduce maternal mortality ratio bythree-quarters by 2015Likely Potentially Unlikely Lack ofdataStrong Fair Weak butimprovingWeak6 A. HIV/AIDSHalt and reverse the spread ofHIV/AIDS by 2015Likely Potentially Unlikely Lack ofdataStrong Fair Weak butimprovingWeak6 B. Malaria and Other MajorDiseasesHalt and reverse the incidence ofmalaria and other diseases by2015Likely Potentially Unlikely Lack ofdataStrong Fair Weak butimprovingWeak6 C. TuberculosisHalt and reverse the incidence oftuberculosis by 2015Likely Potentially Unlikely Lack ofdataStrong Fair Weak butimprovingWeak7 A. EnvironmentalSustainabilityReverse loss of environmentalresourcesLikely Potentially Unlikely Lack ofdataStrong Fair Weak butimprovingWeak7 B. Access to Safe DrinkingWaterHalve the proportion of peoplewithout access to sale drinkingwaterLikely Potentially Unlikely Lack ofdataStrong Fair Weak butimprovingWeakSource: UNDP (2005)222 Environment Assessment of Nepal : Emerging Issues and Challenges
MDG Needs Assessment Module for NepalAccording to the Nepal team (Zahir et al. 2004), the first purpose of the review was to unfold the workings of thetemplates so that the information fed into these templates and the results generated could be mapped intransparent ways. The second purpose was to make the templates Nepal specific.The needs assessment for Nepal covered five sectors: (i) agriculture, irrigation, and food security; (ii) roadsand other rural infrastructure; (iii) drinking water and sanitation; (iv) health; and (v) education. Environment andgender were to be treated as crosscutting themes.The study team revised the templates on education, water and sanitation, hunger, and agriculture; it alsodeveloped a costing template for roads and rural infrastructure, although not included in the original MDGs,infrastructure is considered critical for Nepal to progress in all the MDGs. A module has also been developed forcosting the health system.The entire exercise has gone through many rounds of interaction, especially with the concerned lineagencies. The main objective has been to make the exercise as realistic and consistent as possible with respectto the MDGs as well as with the country development goals and the plans and programs being implemented.The main problem has been the extremely poor information base for many of the parameters used in thetemplates. The exercise has highlighted many critical data gaps that hamper such an exercise. It alsoemphasizes the need to substantially improve regular reporting across sectors to carefully monitor progress inmeeting the MDGs. Cost information is a variable that has to be treated very carefully. For many of theinterventions, cost figures were lacking and estimates from other areas had to be used. In other cases,“reasonable” estimates have been used. This underscores the need to review these templates regularlywhenever new facts or conditions make this necessary.Wherever environmental parameters are already being measured and reported, these are easy toincorporate in the cost calculations. However, at present, only a few environmental parameters, such aspesticide use or aspects of water pollution (based on measurement of waterborne diseases for some areas),may be directly integrated in the cost calculations. In all other cases, the costs have to be part of feasibilitystudies, training, and monitoring activities. There appears to be broad agreement among the different sectoralteams regarding this approach. The main findings of the study team are highlighted below.Eradicating Extreme Poverty and HungerGoal 1: Eradicate extreme poverty and hungerTarget 1:Halve the proportion of people whose income is less than NRs 6,100 per capita per year at 2001 prices or NRs16.71 per capita per day. The 2004 Nepal Living Standards Survey shows that only about 30% are below thepoverty line, which is a significant improvement since 1995.Target 2:Halve between 1990 and 2015 the proportion of people who suffer from hunger. This includes reducing thepercentage of underweight children from 57% in 1990 to 28% in 2015.Proposals to eradicate extreme poverty and hunger center around wider dissemination and adoption of agriculturaltechnology, increased access to production inputs, commercialization and diversification within the sector, and marketpromotion and infrastructure development. At 2004 prices, the financial resources needed for 2005 were NRs 19,796 million,increasing to NRs 42,625 million in 2015. The total budget set aside for agriculture and irrigation was only NRs 6,026 million,which is 30% of the needed estimate for 2005.Attaining Universal Primary EducationGoal 2: Achieve universal primary educationTarget 3: Ensure that by 2015, children everywhere, boys and girls alike, will be able to complete a full courseof primary schooling.The total cost of attaining the MDG on education for 2005–2015 amounts to NRs 334.5 billion at FY2005prices. The average annual costs amount to NRs 30.4 billion at FY2005 prices, which is 20% higher than theGovernment primary education budget for FY2005.Annex223
Goal 4: Reduce child mortalityReduce by two thirds between 1990 and 2015, the under-5 mortality rate and also immunize 1-year-olds againstmeasles.Nepal is on track to meet this goal, as in 1996 the under-5 mortality rate was 1<strong>18</strong> per 1,000, which decreasedto 91 per 1,000 in 2000 and the target is to reduce this to less than 54 by 2015. Similarly, infant mortality stood at78 per 1,000 in 1995, which is to be reduced to less than 25 by 2015. The cost per child was NRs 90 in 2005,increasing to NRs 327 in 2015.Goal 5: Improve maternal health in NepalThe target is to reduce by three fourths the maternal mortality ratio and expand deliveries attended by healthcare providers. Per capita cost is NRs 34 in 2005, increasing to NRs 86 by 2015.Goal 6: Combat HIV/AIDS, malaria, and other diseasesHalting and reversing the incidence of HIV/AIDS, malaria, and other major diseases by 2015 to meet Goals 5 and6 will require spending NRs 11,791 million in 2005 and NRs 24,192 million in 2015.Water and SanitationGoal 7: Ensure environmental sustainabilityTarget 10: Halve by 2015 the proportion of people without sustainable access to safe drinking water andsanitation. The cost in 2005 was NRs 8,855 million, increasing to NRs 16,550 million in 2015. InFY2004, government expenditure in this sector was only NRs 2,025 million.Rural Transport and InfrastructureAlthough not a part of the MDGs, Nepal considers this area important for meeting MDGs. The target is to put in place ruralinfrastructure to ensure the necessary transport services and supply of energy resources to meet the MDGs.CostsThe total cost to meet the needs for the years 2005–2015 amounts to NRs 1,130,439 million at FY2005 prices, orabout $16,149 million.The total financing gap varies based on the assumptions made and ranges from NRs 599 billion to NRs 538billion. The latter scenario is based on the assumption of reduced security expenses.The financing gap under the third scenario is 34% for hunger, 24% for education, 15% for health, 14% fordrinking water and sanitation, and 13% for rural transport and electricity.BibliographyHis Majesty’s Government of Nepal (HMG) and United Nations (UN) Country Team. 2002. Nepal MillenniumDevelopment Goals Progress Report 2002. Kathmandu.National Planning Commission (NPC) and United Nations Development Programme (UNDP). 2005. NepalMillennium Development Goals Progress Report 2005. Kathmandu.Zahir, S., B.G. Baidya, D.P. Chapagain, M.P. Ghimire, B.R. Shrestha, and M.L. Maskey. 2004. “Attaining MillenniumDevelopment Goals: A Needs Assessment Study for Nepal.” Report Prepared for His Majesty’s Governmentof Nepal, National Planning Commission, and United Nations Development Programme Country Office–Nepal, Kathmandu.224 Environment Assessment of Nepal : Emerging Issues and Challenges
The environment plays a crucial role in enabling and sustaining poverty reduction—and the effect ismagnified within mountainous ecosystems such as those found in Nepal. Including environmentalconsiderations in planning is a must, but to do this we need the relevant environmental data. In Nepal,environmental data and information can be difficult to find. Many data sets are unpublished—held in reports,ministry files, and others—much is inconsistent, and there are big gaps, especially in terms of time series andreliable, verified data.The Environment Assessment of Nepal attempts to bring together a large part of what is available to providean analysis of environmental status and trends in the country; the policy, legal and institutional framework forenvironmental management; financing mechanisms; and major environmental issues and opportunities. TheAssessment highlights data inconsistencies, gaps, and needs, and the extensive list of sources provides anexcellent starting point for anyone attempting to locate relevant environmental data.The <strong>book</strong> is a demonstration of <strong>ADB</strong>’s and ICIMOD’s strong commitment to developing south Asia’senvironment knowledge base further, disseminating the information widely, and providing much neededenvironment assessment information to policy makers, researchers and development practitioners for thedevelopment of economically and environmentally sound ecosystems while improving living standards.


