ADB_book_18 April.qxp - Himalayan Document Centre - icimod
ADB_book_18 April.qxp - Himalayan Document Centre - icimod
ADB_book_18 April.qxp - Himalayan Document Centre - icimod
- No tags were found...
Create successful ePaper yourself
Turn your PDF publications into a flip-book with our unique Google optimized e-Paper software.
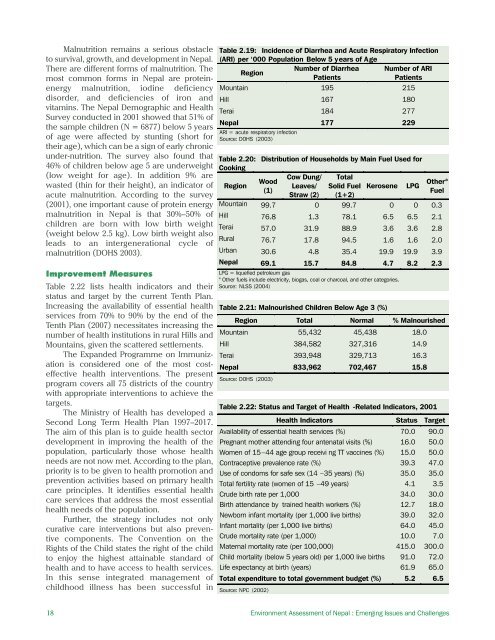
Malnutrition remains a serious obstacleto survival, growth, and development in Nepal.There are different forms of malnutrition. Themost common forms in Nepal are proteinenergymalnutrition, iodine deficiencydisorder, and deficiencies of iron andvitamins. The Nepal Demographic and HealthSurvey conducted in 2001 showed that 51% ofthe sample children (N = 6877) below 5 yearsof age were affected by stunting (short fortheir age), which can be a sign of early chronicunder-nutrition. The survey also found that46% of children below age 5 are underweight(low weight for age). In addition 9% arewasted (thin for their height), an indicator ofacute malnutrition. According to the survey(2001), one important cause of protein energymalnutrition in Nepal is that 30%–50% ofchildren are born with low birth weight(weight below 2.5 kg). Low birth weight alsoleads to an intergenerational cycle ofmalnutrition (DOHS 2003).Table 2.19: Incidence of Diarrhea and Acute Respiratory Infection(ARI) per ‘000 Population Below 5 years of AgeNumber of Diarrhea Number of ARIRegionPatientsPatientsMountain 195 215Hill 167 <strong>18</strong>0Terai <strong>18</strong>4 277Nepal 177 229ARI = acute respiratory infectionSource: DOHS (2003)Table 2.20: Distribution of Households by Main Fuel Used forCookingCow Dung/ TotalWoodRegionLeaves/ Solid Fuel Kerosene LPG(1)Straw (2) (1+2)Other aFuelMountain 99.7 0 99.7 0 0 0.3Hill 76.8 1.3 78.1 6.5 6.5 2.1Terai 57.0 31.9 88.9 3.6 3.6 2.8Rural 76.7 17.8 94.5 1.6 1.6 2.0Urban 30.6 4.8 35.4 19.9 19.9 3.9Nepal 69.1 15.7 84.8 4.7 8.2 2.3Improvement MeasuresLPG = liquefied petroleum gasa Other fuels include electricity, biogas, coal or charcoal, and other categories.Table 2.22 lists health indicators and their Source: NLSS (2004)status and target by the current Tenth Plan.Increasing the availability of essential health Table 2.21: Malnourished Children Below Age 3 (%)services from 70% to 90% by the end of theRegion Total Normal % MalnourishedTenth Plan (2007) necessitates increasing thenumber of health institutions in rural Hills and Mountain 55,432 45,438 <strong>18</strong>.0Mountains, given the scattered settlements. Hill 384,582 327,316 14.9The Expanded Programme on ImmunizationTerai 393,948 329,713 16.3is considered one of the most cost-Nepal 833,962 702,467 15.8effective health interventions. The presentSource: DOHS (2003)program covers all 75 districts of the countrywith appropriate interventions to achieve thetargets.The Ministry of Health has developed aTable 2.22: Status and Target of Health -Related Indicators, 2001Second Long Term Health Plan 1997–2017.The aim of this plan is to guide health sectordevelopment in improving the health of thepopulation, particularly those whose healthneeds are not now met. According to the plan,Health IndicatorsAvailability of essential health services (%)Pregnant mother attending four antenatal visits (%)Women of 15–44 age group receivi ng TT vaccines (%)Contraceptive prevalence rate (%)Status70.016.015.039.3Target90.050.050.047.0priority is to be given to health promotion and Use of condoms for safe sex (14 –35 years) (%) 35.0 35.0prevention activities based on primary health Total fertility rate (women of 15 –49 years) 4.1 3.5care principles. It identifies essential healthCrude birth rate per 1,000 34.0 30.0care services that address the most essentialBirth attendance by trained health workers (%) 12.7 <strong>18</strong>.0health needs of the population.Newborn infant mortality (per 1,000 live births) 39.0 32.0Further, the strategy includes not onlyInfant mortality (per 1,000 live births) 64.0 45.0curative care interventions but also preventivecomponents. The Convention on the Crude mortality rate (per 1,000) 10.0 7.0Rights of the Child states the right of the childto enjoy the highest attainable standard ofhealth and to have access to health services.In this sense integrated management ofchildhood illness has been successful inMaternal mortality rate (per 100,000)Child mortality (below 5 years old) per 1,000 live birthsLife expectancy at birth (years)Total expenditure to total government budget (%)415.091.061.95.2300.072.065.06.5Source: NPC (2002)<strong>18</strong> Environment Assessment of Nepal : Emerging Issues and Challenges


