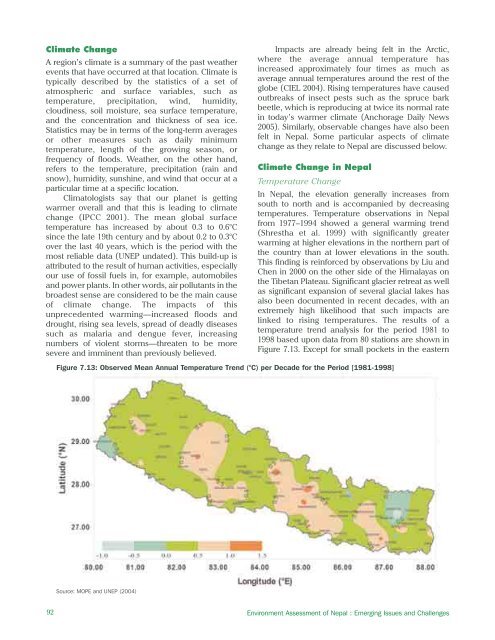
Climate ChangeA region’s climate is a summary of the past weatherevents that have occurred at that location. Climate istypically described by the statistics of a set ofatmospheric and surface variables, such astemperature, precipitation, wind, humidity,cloudiness, soil moisture, sea surface temperature,and the concentration and thickness of sea ice.Statistics may be in terms of the long-term averagesor other measures such as daily minimumtemperature, length of the growing season, orfrequency of floods. Weather, on the other hand,refers to the temperature, precipitation (rain andsnow), humidity, sunshine, and wind that occur at aparticular time at a specific location.Climatologists say that our planet is gettingwarmer overall and that this is leading to climatechange (IPCC 2001). The mean global surfacetemperature has increased by about 0.3 to 0.6°Csince the late 19th century and by about 0.2 to 0.3°Cover the last 40 years, which is the period with themost reliable data (UNEP undated). This build-up isattributed to the result of human activities, especiallyour use of fossil fuels in, for example, automobilesand power plants. In other words, air pollutants in thebroadest sense are considered to be the main causeof climate change. The impacts of thisunprecedented warming—increased floods anddrought, rising sea levels, spread of deadly diseasessuch as malaria and dengue fever, increasingnumbers of violent storms—threaten to be moresevere and imminent than previously believed.Impacts are already being felt in the Arctic,where the average annual temperature hasincreased approximately four times as much asaverage annual temperatures around the rest of theglobe (CIEL 2004). Rising temperatures have causedoutbreaks of insect pests such as the spruce barkbeetle, which is reproducing at twice its normal ratein today’s warmer climate (Anchorage Daily News2005). Similarly, observable changes have also beenfelt in Nepal. Some particular aspects of climatechange as they relate to Nepal are discussed below.Climate Change in NepalTemperature ChangeIn Nepal, the elevation generally increases fromsouth to north and is accompanied by decreasingtemperatures. Temperature observations in Nepalfrom 1977–1994 showed a general warming trend(Shrestha et al. 1999) with significantly greaterwarming at higher elevations in the northern part ofthe country than at lower elevations in the south.This finding is reinforced by observations by Liu andChen in 2000 on the other side of the Himalayas onthe Tibetan Plateau. Significant glacier retreat as wellas significant expansion of several glacial lakes hasalso been documented in recent decades, with anextremely high likelihood that such impacts arelinked to rising temperatures. The results of atemperature trend analysis for the period 1981 to1998 based upon data from 80 stations are shown inFigure 7.13. Except for small pockets in the easternFigure 7.13: Observed Mean Annual Temperature Trend (°C) per Decade for the Period [1981-1998]Source: MOPE and UNEP (2004)92 Environment Assessment of Nepal : Emerging Issues and Challenges
egion and far western Terai, most of Nepal showeda positive trend of between 0°C and 0.5°C perdecade. Agrawal et al. (2003) pointed out that thetemperature differences are most pronouncedduring the dry winter season, and least during theheight of the monsoon.A study carried out by MOPE and the UnitedNations Environment Programme (UNEP) for theInitial National Communication to the Conference ofthe Parties of the United Nations Framework Conventionon Climate Change using models (CanadianClimate Change Model [“CCCM”], Geophysical FluidDynamics Model [“GFD3]”, and Regional ClimateModel) and their projections showed a projected 2 to4°C rise in average annual temperature over Nepalwhen CO 2 is doubled. The magnitude of temperaturerise would be greater in western Nepal than in otherregions. According to the CCCM model, wintershowed the greatest increase of any season with thehighest value in the far-western region (2.4°C to5.4°C), and for all seasons, the rising gradient wasfrom east to west, whereas in the GFD3 model it wasfrom west to east during pre-monsoon and winter.Precipitation ChangeIn Nepal, altitude affects annual rainfall andprecipitation patterns. Up to about 3,000 m, annualrainfall totals increase with altitude; thereafter,annual totals decrease with increasing altitude andlatitude. Eastern Nepal receives approximately 2,500mm of rain annually, the Kathmandu area about1,420 mm, and western Nepal about 1,000 mm(Figure 7.14).In the prediction study conducted by MOPE andUNEP (MOPE and UNEP 2004) precipitation wasfound to increase for all seasons in general, with arising gradient from west to east using the GFD3model. The CCCM model predicted a negativegradient of precipitation from west to east duringwinter but followed the trend of the GFD3 model inother seasons. Trend analysis of observedprecipitation between 1981 and 1998 (Figure 7.15)showed a negative trend in the monsoon, postmonsoon, and annual scenarios which was morepronounced in western Nepal than in eastern Nepal.Most of the Terai belt, except in the eastern region,had a negative trend for all seasons.Impact of Climate Change in NepalThere are a number of anecdotal perceptions aboutNepal’s changing climate. However, further researchis needed before drawing firm conclusions as towhether and how the climate is already changing.In the Terai belt during the winter, news reportsindicate that fog persists until late morning, andwinter mornings are thus much colder than previousyears. Winter days in Kathmandu Valley are less cold,frost is becoming rare, and the summers are warmer.The beginning of spring has become a persistent coldrain. Rain has become less predictable anddependable, both in distribution and amount. Therehas been more ice and less snow. These changescan have a direct influence on surface runoff,agriculture, vegetation, and people’s daily lives.One of the few measured changes is that ofglacier retreat. The increase in temperature in theHimalaya and the vicinity appears to have beenhigher in the uplands than in the lowlands (Shresthaet al. 1999). The warming has resulted in markedretreat of the glaciers with a reduction in both areaand ice volume (Agrawal et al. 2003). The glacierfrom which Sir Edmund Hillary and Tenzing Norgayset out to conquer Mount Everest nearly 50 years agohas retreated three miles up the mountain—presumed to be a result of climate change—asreported by a team of climbers backed by UNEP(UNEP 2002). The <strong>Himalayan</strong> glaciers are arenewable storehouse of fresh water that benefitshundreds of millions of people downstream, thusglacier retreat has long-term implications for waterstorage and availability. Glacier retreat can also leadto more immediate problems. As glaciers retreat,lakes can form behind the newly exposed terminalmoraine. The unstable “dam” formed by the morainecan breach rapidly, leading to a sudden discharge ofhuge amounts of water and debris—a glacial lakeoutburst flood—often with catastrophic effects interms of damage to roads, bridges, trekking trails,villages, and agricultural lands, as well as loss ofhuman life and other infrastructure. Over the past 50years, there have been at least 21 recorded outburstflood events that have affected Nepal. In 2001,ICIMOD and UNEP documented 27 potentiallydangerous glacial lakes in Nepal (Mool et al. 2001).Climate change will inevitably have an impacton air pollution in the country. Rainfall markedlyreduces the levels of certain pollutants in ambient air,especially particulate matter. Increased frequency ofrain will reduce urban air pollution and vice versa.Equally, precipitation could set chemical processesin motion that have a negative impact. Increasedwind and storms may increase the levels oftransboundary pollutants, and/or increase dustlevels. Raised or lowered temperatures andprecipitation may impact on human activity and thuson levels of air pollutants. There are a myriaddifferent possibilities, but as yet prediction andmeasurement of possible climate change in Nepal isin its infancy, and thus the possible impacts can onlybe guessed at.Chapter 7: Air Pollution and Climate Change93
- Page 2 and 3:
About the OrganisationsAsian Develo
- Page 4 and 5:
© 2006 International Centre for In
- Page 6 and 7:
AcknowledgementsWe would like to ex
- Page 8 and 9:
PM2.5PAHRSSAARCSACEPSEASO 2TSPUKUND
- Page 10 and 11:
Chapter 6: Energy Resources 65Intro
- Page 12 and 13:
List of FiguresFigure 2.1: People a
- Page 14 and 15:
Table 6.1: Energy Consumption and P
- Page 16 and 17:
forests are also used for infrastru
- Page 18 and 19:
as data gathered by different agenc
- Page 20 and 21:
Table 2.1: Population Growth Rates
- Page 22 and 23:
mortality rates for rural and urban
- Page 24 and 25:
Agglomeration village in the centra
- Page 26 and 27:
soil erosion, and depletion of wate
- Page 30 and 31:
provision remains inadequate becaus
- Page 32 and 33:
Malnutrition remains a serious obst
- Page 34 and 35:
Table 2.24: Existing and Projected
- Page 36 and 37:
Table 2.28: Income Poverty Indicato
- Page 38 and 39:
Table 2.31: Change in Employment St
- Page 40 and 41:
In 2004, the average annual househo
- Page 42 and 43:
Mountain areas have the most food i
- Page 44 and 45:
Schaffner, U. 1987. “Road Constru
- Page 46 and 47:
Table 3.1: Agricultural Economic De
- Page 48 and 49:
Table 3.4: Estimated Soil Erosion R
- Page 50 and 51:
B. PradhanImpacts of land degradati
- Page 52 and 53:
Carson, B. 1985. “Erosion and Sed
- Page 54 and 55:
The trend of forest coverage in the
- Page 56 and 57: BiodiversityState of BiodiversityNe
- Page 58 and 59: The Government has given legal prot
- Page 60 and 61: Different ways of maintaining biodi
- Page 62 and 63: ———.2004. State of the Enviro
- Page 64 and 65: Appendix 4.1: Table continuedMajor
- Page 66 and 67: Appendix 4.2: Protected Plant and W
- Page 68 and 69: Table A4.2.3: Nepal's Share in Plan
- Page 70 and 71: to intense weathering, and percolat
- Page 72 and 73: Table 5.5: Water Supply and Water T
- Page 74 and 75: Table 5.9: Water Quality of Shallow
- Page 76 and 77: species are reported to be endanger
- Page 78 and 79: Ministry of Water Resources (MOWR).
- Page 80 and 81: Definition, Forms, and UnitsEnergy
- Page 82 and 83: Table 6.5: Hydropower PotentialRive
- Page 84 and 85: Chilime Hydroelectric Project: An E
- Page 86 and 87: load occurs from 6 pm to 9 pm with
- Page 88 and 89: assessment of wind energy and lack
- Page 90 and 91: Review of Dams and Development by t
- Page 92 and 93: IUCNElizabeth Khaka, UNEP-NairobiRu
- Page 94 and 95: therefore reflect the three guiding
- Page 96 and 97: is a seasonal dust storm. Anthropog
- Page 98 and 99: Figure 7.3: Average Air Quality, Ja
- Page 100 and 101: matter, hydrocarbons, and NO x (Nae
- Page 102 and 103: Figure: 7.9: Vehicle Registered in
- Page 104 and 105: Brick Kilnchlorofluorocarbons (HCFC
- Page 108 and 109: Figure 7.14: Mean Annual Precipitat
- Page 110 and 111: Table 7.3: National Ambient Air Qua
- Page 112 and 113: India. Available: http://www.cleana
- Page 114 and 115: ———.1999. “Ambient Air Qual
- Page 116 and 117: Appendix 7.1: World Health Organiza
- Page 118 and 119: Table 8.1: Criteria for Urban Statu
- Page 120 and 121: accommodate the rapidly increasing
- Page 122 and 123: managing solid waste. They are part
- Page 124 and 125: In most municipalities, hazardous w
- Page 126 and 127: in worsening public health conditio
- Page 128 and 129: objects of archaeological, historic
- Page 130 and 131: Min BajracharyaB. PradhanVehicles a
- Page 132 and 133: Department of Health Services (DOHS
- Page 134 and 135: Table 9.1 describes the major highl
- Page 136 and 137: the period to up 2017. The document
- Page 138 and 139: earthquakes; and awareness raising
- Page 140 and 141: Sub-regional LinkagesOther developi
- Page 142 and 143: Figure 9.1: The Key Environmental I
- Page 144 and 145: (iv)(v)(vi)plants, and other non-ti
- Page 146 and 147: environmental governance can be bet
- Page 148 and 149: can vary considerably. Both sides h
- Page 150 and 151: Dhungel, D.N., and A.B. Rajbhandari
- Page 152 and 153: Table A9.1.2: Industry-Specific Tol
- Page 154 and 155: . Cultural Heritage8. Convention fo
- Page 156 and 157:
Appendix 9.3: Some Prominent Enviro
- Page 158 and 159:
Some funding arrangements made by t
- Page 160 and 161:
(NARDF 2004) for a period of 1 to 3
- Page 162 and 163:
Table 10.2: Annual Income and Expen
- Page 164 and 165:
Table 10.4: Users’ Share in Benef
- Page 166 and 167:
From Hands Around Everest bookFrom
- Page 168 and 169:
Table 10.8: Subsidy Rate for Biogas
- Page 170 and 171:
microorganism communities and the n
- Page 172 and 173:
subsidies (Mason 1996). All these a
- Page 174 and 175:
addressed only part of the problem.
- Page 176 and 177:
historical practice of community-ma
- Page 178 and 179:
moved or relocated. The fact that s
- Page 180 and 181:
Kathmandu Valley and receives a lar
- Page 182 and 183:
cooperative ventures provided neith
- Page 184 and 185:
further poaching has not been repor
- Page 186 and 187:
http://www.pugwash.org/reports/pac/
- Page 188 and 189:
United Nations. 2003. World Populat
- Page 190 and 191:
how other countries with substantia
- Page 192 and 193:
(i) Broad-based and sustainable eco
- Page 194 and 195:
Although progress is encouraging, m
- Page 196 and 197:
Nepal’s Changing Pattern of Trade
- Page 198 and 199:
Table 12.2: Trade/ GDP RatiosFY1981
- Page 200 and 201:
Table 12.5: Percentage Share of Maj
- Page 202 and 203:
well as other provisions in specifi
- Page 204 and 205:
Future Implications for NepalIncrea
- Page 206 and 207:
International Trade Forum (ITN). 20
- Page 208 and 209:
- Gross domestic product per unit e
- Page 210 and 211:
Time Series InformationGenerally tw
- Page 212 and 213:
Table 13.1a: Different Datasets Col
- Page 214 and 215:
elevant due to its multidisciplinar
- Page 216 and 217:
Figure 13.6: Examples of Applicatio
- Page 218 and 219:
Judith DobmannThere are many source
- Page 220 and 221:
———.2003. Mapping Nepal Censu
- Page 222 and 223:
sustainable livelihoods requires an
- Page 224 and 225:
and haphazard. Population pressures
- Page 226 and 227:
issue. These deficiencies stem from
- Page 228 and 229:
population must be assessed. MOEST
- Page 230 and 231:
Appendix 14.1: List of Key Environm
- Page 232 and 233:
(vii) The EIA report approving agen
- Page 234 and 235:
Goal 1: Eradicate extreme poverty a
- Page 236 and 237:
Nepal’s Progress Towards the MDGs
- Page 238 and 239:
Goal 4: Reduce child mortalityReduc