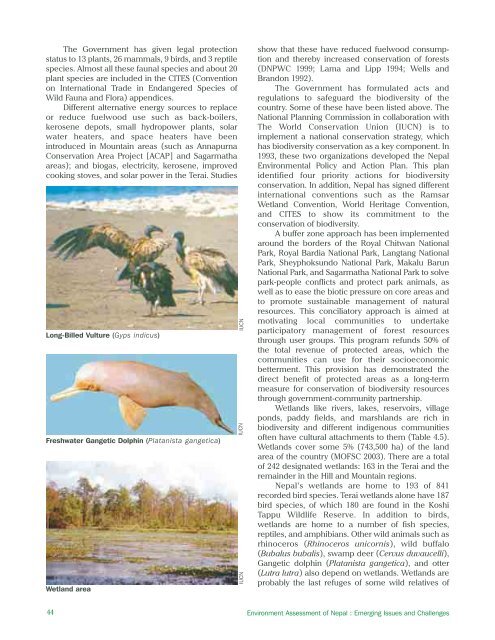
The Government has given legal protectionstatus to 13 plants, 26 mammals, 9 birds, and 3 reptilespecies. Almost all these faunal species and about 20plant species are included in the CITES (Conventionon International Trade in Endangered Species ofWild Fauna and Flora) appendices.Different alternative energy sources to replaceor reduce fuelwood use such as back-boilers,kerosene depots, small hydropower plants, solarwater heaters, and space heaters have beenintroduced in Mountain areas (such as AnnapurnaConservation Area Project [ACAP] and Sagarmathaareas); and biogas, electricity, kerosene, improvedcooking stoves, and solar power in the Terai. StudiesLong-Billed Vulture (Gyps indicus)Freshwater Gangetic Dolphin (Platanista gangetica)Wetland areaIUCNIUCN IUCNshow that these have reduced fuelwood consumptionand thereby increased conservation of forests(DNPWC 1999; Lama and Lipp 1994; Wells andBrandon 1992).The Government has formulated acts andregulations to safeguard the biodiversity of thecountry. Some of these have been listed above. TheNational Planning Commission in collaboration withThe World Conservation Union (IUCN) is toimplement a national conservation strategy, whichhas biodiversity conservation as a key component. In1993, these two organizations developed the NepalEnvironmental Policy and Action Plan. This planidentified four priority actions for biodiversityconservation. In addition, Nepal has signed differentinternational conventions such as the RamsarWetland Convention, World Heritage Convention,and CITES to show its commitment to theconservation of biodiversity.A buffer zone approach has been implementedaround the borders of the Royal Chitwan NationalPark, Royal Bardia National Park, Langtang NationalPark, Sheyphoksundo National Park, Makalu BarunNational Park, and Sagarmatha National Park to solvepark-people conflicts and protect park animals, aswell as to ease the biotic pressure on core areas andto promote sustainable management of naturalresources. This conciliatory approach is aimed atmotivating local communities to undertakeparticipatory management of forest resourcesthrough user groups. This program refunds 50% ofthe total revenue of protected areas, which thecommunities can use for their socioeconomicbetterment. This provision has demonstrated thedirect benefit of protected areas as a long-termmeasure for conservation of biodiversity resourcesthrough government-community partnership.Wetlands like rivers, lakes, reservoirs, villageponds, paddy fields, and marshlands are rich inbiodiversity and different indigenous communitiesoften have cultural attachments to them (Table 4.5).Wetlands cover some 5% (743,500 ha) of the landarea of the country (MOFSC 2003). There are a totalof 242 designated wetlands: 163 in the Terai and theremainder in the Hill and Mountain regions.Nepal’s wetlands are home to 193 of 841recorded bird species. Terai wetlands alone have <strong>18</strong>7bird species, of which <strong>18</strong>0 are found in the KoshiTappu Wildlife Reserve. In addition to birds,wetlands are home to a number of fish species,reptiles, and amphibians. Other wild animals such asrhinoceros (Rhinoceros unicornis), wild buffalo(Bubalus bubalis), swamp deer (Cervus duvaucelli),Gangetic dolphin (Platanista gangetica), and otter(Lutra lutra) also depend on wetlands. Wetlands areprobably the last refuges of some wild relatives of44 Environment Assessment of Nepal : Emerging Issues and Challenges
Table 4.5: Wetland Types in NepalWetland TypeEstimated Area(ha)Percent ofTotalRivers 395,000 53.12Lakes 5,000 0.67Reservoirs 1,380 0.19Village ponds 5,<strong>18</strong>3 0.70Paddy fields 325,000 43.71Marshland 12,000 1.61Total 743,563 100.00ha = hectareSource: M OFSC (2003)cultivated plants, and also have significant value forfishing, irrigation, and religious and recreational(boating, rafting) use. Many indigenous communitiesdepend on wetland resources for their survival.Accordingly, Nepal has sought to conserve thewetland ecosystem and ensure the participation oflocal communities for sustainable use of itscomponents (MOFSC 2003). This policy recognizeswetlands management as an essential component ofan ecosystem approach to natural resourcemanagement and has identified participatorywetlands management, classified wetlands from amanagement perspective, and developed othercomponents of sustainable development.Ecotourism development is an integral part ofthe protected area system in Nepal. The primeobjective of ecotourism has been to promote asymbiotic relationship between tourism and theenvironment, with a particular focus on uplifting thelocal host economy. This concept is also applied invillage communities sited in and around protectedareas.Through ecotourism, tourists get opportunitiesto observe and learn. Its potential contribution tocultural conservation and long-term sustainability ofcommunities and natural resources is huge.Ecotourism is considered a form of sustainabletourism that benefits the community, environment,and local economy. This may be achieved throughvarious means such as employment for local peopleor programs in which tourists contribute money tocommunity activities. In Nepal, the ACAP providesone of the best examples of ecotourism. Under thisproject, several village sites have been identified forcommunity-based ecotourism development.The ACAP, covering an area of 7,629 km 2 in thewestern <strong>Himalayan</strong> region, covers one of the threeconservation areas of Nepal. ACAP was created in1986 under the King Mahendra Trust for NatureConservation and gazetted as a Conservation Area in1992. The main aim of ACAP is to balance naturalresource conservation and sustainable communitydevelopment. The area is characterized by bothbiodiversity and cultural diversity. ACAP has beensuccessful in gradually changing traditionalsubsistence activities into a framework of soundresource management, supplemented byconservation, development of alternative energyprograms (such as micro hydroelectricity, biogasplants, solar power, kerosene depots, and fuelwoodsaving technology) to minimize the negative impactsof tourism and to enhance the living standards oflocal people. It follows the principles of maximumpeople’s participation, sustainability, and a catalyticrole. The focus in Jomsom, Manang, and Ghandruk,which are popular trekking areas, is on integratedtourism management and agro-pastoralism, wherelocal communities are involved in tourism-basedincome generating activities.The Annapurna Conservation Area has been aprime destination for trekkers ever since it wasopened to visitors. Of Nepal’s total 100,828 trekkers in2001, 65% visited the Annapurna area. ACAP isauthorized to collect entry fees from visitors, and therevenue from trekking has been used to create anendowment fund with the objective of achievingfinancial self-sustainability. The fund is used fornatural resource conservation and communitydevelopment, which has brought positive results tothe livelihoods of the people of the Annapurna area.An understanding of conservation and thesustainable use of natural resources has proved to bea crucial catalyst for sustaining development. ACAPhas since become a model for conservation anddevelopment not only for other parts of the countrybut also for the rest of the world. Many national parksand protected areas in Nepal have either adopted orrefined the ACAP model (ACAP 2002).SummaryThe forest is the most important natural resource,and the most important natural ecosystem, in Nepal.Forests are the principal source of fuelwood andfodder, and are also used for grazing and building ofroads, public buildings, and other infrastructure. Anychange—decrease or increase—in the forests canaffect wildlife, biodiversity and water sources, all ofwhich depend upon forests. Analysis of forestresources in Nepal has been based on differentsources and methods. These sources and methodshave shown a change in forest coverage—adecrease from 1986 to 1994 followed by an increaseup to 2000, but the surveys used differentmethodologies and techniques and it is difficult todraw any firm conclusions. Anecdotal evidence andlocal observations show that depletion of forest areais most common in areas with relatively betterChapter 4: Forestry and Biodiversity45
- Page 2 and 3:
About the OrganisationsAsian Develo
- Page 4 and 5:
© 2006 International Centre for In
- Page 6 and 7:
AcknowledgementsWe would like to ex
- Page 8 and 9: PM2.5PAHRSSAARCSACEPSEASO 2TSPUKUND
- Page 10 and 11: Chapter 6: Energy Resources 65Intro
- Page 12 and 13: List of FiguresFigure 2.1: People a
- Page 14 and 15: Table 6.1: Energy Consumption and P
- Page 16 and 17: forests are also used for infrastru
- Page 18 and 19: as data gathered by different agenc
- Page 20 and 21: Table 2.1: Population Growth Rates
- Page 22 and 23: mortality rates for rural and urban
- Page 24 and 25: Agglomeration village in the centra
- Page 26 and 27: soil erosion, and depletion of wate
- Page 30 and 31: provision remains inadequate becaus
- Page 32 and 33: Malnutrition remains a serious obst
- Page 34 and 35: Table 2.24: Existing and Projected
- Page 36 and 37: Table 2.28: Income Poverty Indicato
- Page 38 and 39: Table 2.31: Change in Employment St
- Page 40 and 41: In 2004, the average annual househo
- Page 42 and 43: Mountain areas have the most food i
- Page 44 and 45: Schaffner, U. 1987. “Road Constru
- Page 46 and 47: Table 3.1: Agricultural Economic De
- Page 48 and 49: Table 3.4: Estimated Soil Erosion R
- Page 50 and 51: B. PradhanImpacts of land degradati
- Page 52 and 53: Carson, B. 1985. “Erosion and Sed
- Page 54 and 55: The trend of forest coverage in the
- Page 56 and 57: BiodiversityState of BiodiversityNe
- Page 60 and 61: Different ways of maintaining biodi
- Page 62 and 63: ———.2004. State of the Enviro
- Page 64 and 65: Appendix 4.1: Table continuedMajor
- Page 66 and 67: Appendix 4.2: Protected Plant and W
- Page 68 and 69: Table A4.2.3: Nepal's Share in Plan
- Page 70 and 71: to intense weathering, and percolat
- Page 72 and 73: Table 5.5: Water Supply and Water T
- Page 74 and 75: Table 5.9: Water Quality of Shallow
- Page 76 and 77: species are reported to be endanger
- Page 78 and 79: Ministry of Water Resources (MOWR).
- Page 80 and 81: Definition, Forms, and UnitsEnergy
- Page 82 and 83: Table 6.5: Hydropower PotentialRive
- Page 84 and 85: Chilime Hydroelectric Project: An E
- Page 86 and 87: load occurs from 6 pm to 9 pm with
- Page 88 and 89: assessment of wind energy and lack
- Page 90 and 91: Review of Dams and Development by t
- Page 92 and 93: IUCNElizabeth Khaka, UNEP-NairobiRu
- Page 94 and 95: therefore reflect the three guiding
- Page 96 and 97: is a seasonal dust storm. Anthropog
- Page 98 and 99: Figure 7.3: Average Air Quality, Ja
- Page 100 and 101: matter, hydrocarbons, and NO x (Nae
- Page 102 and 103: Figure: 7.9: Vehicle Registered in
- Page 104 and 105: Brick Kilnchlorofluorocarbons (HCFC
- Page 106 and 107: Climate ChangeA region’s climate
- Page 108 and 109:
Figure 7.14: Mean Annual Precipitat
- Page 110 and 111:
Table 7.3: National Ambient Air Qua
- Page 112 and 113:
India. Available: http://www.cleana
- Page 114 and 115:
———.1999. “Ambient Air Qual
- Page 116 and 117:
Appendix 7.1: World Health Organiza
- Page 118 and 119:
Table 8.1: Criteria for Urban Statu
- Page 120 and 121:
accommodate the rapidly increasing
- Page 122 and 123:
managing solid waste. They are part
- Page 124 and 125:
In most municipalities, hazardous w
- Page 126 and 127:
in worsening public health conditio
- Page 128 and 129:
objects of archaeological, historic
- Page 130 and 131:
Min BajracharyaB. PradhanVehicles a
- Page 132 and 133:
Department of Health Services (DOHS
- Page 134 and 135:
Table 9.1 describes the major highl
- Page 136 and 137:
the period to up 2017. The document
- Page 138 and 139:
earthquakes; and awareness raising
- Page 140 and 141:
Sub-regional LinkagesOther developi
- Page 142 and 143:
Figure 9.1: The Key Environmental I
- Page 144 and 145:
(iv)(v)(vi)plants, and other non-ti
- Page 146 and 147:
environmental governance can be bet
- Page 148 and 149:
can vary considerably. Both sides h
- Page 150 and 151:
Dhungel, D.N., and A.B. Rajbhandari
- Page 152 and 153:
Table A9.1.2: Industry-Specific Tol
- Page 154 and 155:
. Cultural Heritage8. Convention fo
- Page 156 and 157:
Appendix 9.3: Some Prominent Enviro
- Page 158 and 159:
Some funding arrangements made by t
- Page 160 and 161:
(NARDF 2004) for a period of 1 to 3
- Page 162 and 163:
Table 10.2: Annual Income and Expen
- Page 164 and 165:
Table 10.4: Users’ Share in Benef
- Page 166 and 167:
From Hands Around Everest bookFrom
- Page 168 and 169:
Table 10.8: Subsidy Rate for Biogas
- Page 170 and 171:
microorganism communities and the n
- Page 172 and 173:
subsidies (Mason 1996). All these a
- Page 174 and 175:
addressed only part of the problem.
- Page 176 and 177:
historical practice of community-ma
- Page 178 and 179:
moved or relocated. The fact that s
- Page 180 and 181:
Kathmandu Valley and receives a lar
- Page 182 and 183:
cooperative ventures provided neith
- Page 184 and 185:
further poaching has not been repor
- Page 186 and 187:
http://www.pugwash.org/reports/pac/
- Page 188 and 189:
United Nations. 2003. World Populat
- Page 190 and 191:
how other countries with substantia
- Page 192 and 193:
(i) Broad-based and sustainable eco
- Page 194 and 195:
Although progress is encouraging, m
- Page 196 and 197:
Nepal’s Changing Pattern of Trade
- Page 198 and 199:
Table 12.2: Trade/ GDP RatiosFY1981
- Page 200 and 201:
Table 12.5: Percentage Share of Maj
- Page 202 and 203:
well as other provisions in specifi
- Page 204 and 205:
Future Implications for NepalIncrea
- Page 206 and 207:
International Trade Forum (ITN). 20
- Page 208 and 209:
- Gross domestic product per unit e
- Page 210 and 211:
Time Series InformationGenerally tw
- Page 212 and 213:
Table 13.1a: Different Datasets Col
- Page 214 and 215:
elevant due to its multidisciplinar
- Page 216 and 217:
Figure 13.6: Examples of Applicatio
- Page 218 and 219:
Judith DobmannThere are many source
- Page 220 and 221:
———.2003. Mapping Nepal Censu
- Page 222 and 223:
sustainable livelihoods requires an
- Page 224 and 225:
and haphazard. Population pressures
- Page 226 and 227:
issue. These deficiencies stem from
- Page 228 and 229:
population must be assessed. MOEST
- Page 230 and 231:
Appendix 14.1: List of Key Environm
- Page 232 and 233:
(vii) The EIA report approving agen
- Page 234 and 235:
Goal 1: Eradicate extreme poverty a
- Page 236 and 237:
Nepal’s Progress Towards the MDGs
- Page 238 and 239:
Goal 4: Reduce child mortalityReduc