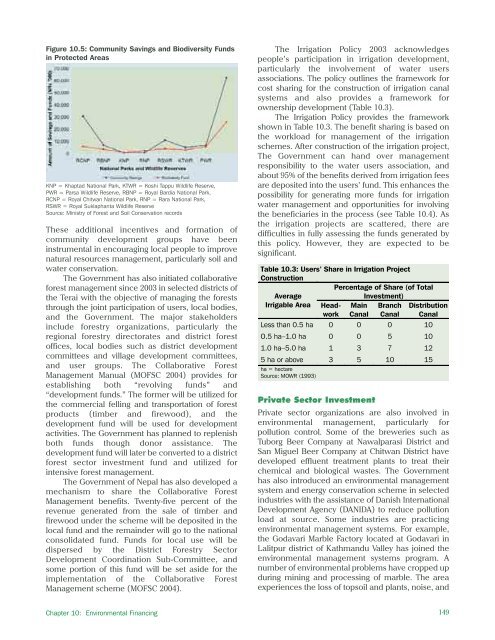
Table 10.2: Annual Income and Expenditure of Community Forestry User Groups (NRs)Items Terai % Hills % Total %Income SourceForest product sale 143,305,329 59.15 604,074,653 90.40 747,379,982 82.08GO/NGO grants 4,040,627 1.67 4,040,627 0.60 8,081,254 0.89Fine/punishment 1,921,990 0.79 2,981,133 0.45 4,903,123 0.54Membership fees 5,062,717 2.09 6,688,963 1.00 11,751,680 1.29Entrance fees 2,359,803 0.97 2,417,298 0.36 4,777,101 0.52Other income 85,487,836 35.29 27,040,978 4.05 112,528,814 12.36Last year balance 90,253 0.04 20,999,190 3.14 21,089,443 2.32Total income 242,268,555 100 668,242,842 100.00 910,511,397 100.00Annual ExpenditureForest watcher 27,488,708 14.99 <strong>18</strong>,674,938 6.83 46,163,646 10.10Silvicultural operations 31,108,914 16.97 52,773,342 19.29 83,882,256 <strong>18</strong>.36Training, study tour workshops 2,908,653 1.59 5,838,382 2.13 8,747,035 1.91Stationery 3,780,050 2.06 26,556,550 9.71 30,336,600 6.64Building construction 12,097,447 6.60 17,875,924 6.53 29,973,371 6.56Rent/equipment 2,004,638 1.09 1,902,831 0.70 3,907,469 0.86Salary/allowance 13,893,684 7.58 5,494,599 2.01 19,388,283 4.24Meeting/assembly 7,520,316 4.10 1,390,590 0.51 8,910,906 1.95Other group operational 0 0.00 226,268 0.08 226,268 0.05School support 11,120,1<strong>18</strong> 6.07 23,872,342 8.73 34,992,460 7.66Road construction 995,638 0.54 22,361,760 8.17 23,357,398 5.11Other infrastructure <strong>18</strong>,5<strong>18</strong>,452 10.10 57,491,735 21.01 76,010,<strong>18</strong>7 16.63Pro-poor program 1,608,566 0.88 11,041,367 4.04 12,649,933 2.77Miscellaneous 50,301,431 27.44 28,096,062 10.27 78,397,493 17.16Total cost (NRs) <strong>18</strong>3,346,615 100.00 273,596,690 100.00 456,943,305 100.00GO = government organization, NGO = non government organizationSource: Kanel (2004)conservation of endangered species; tourismdevelopment and conservation of historical andarchaeological sites; and wetland conservation anddevelopment within the buffer zone areas.As empowered by the Buffer Zone ManagementRegulations 1996, the buffer zone users have alsostarted community savings and biodiversity funds. Asthe protected areas are set aside for the conservationof biodiversity, buffer zone users have emphasizedconserving species of plants and animals in thenational parks and wildlife reserves and also in thebuffer zones. In four national parks and three wildlifereserves, a total of NRs 62 million have been saved inthe form of community savings during 1997 to 2004;of these NRs 26 million have been set aside as abiodiversity fund (Figure 10.5). The biodiversity fundwill be extensively utilized for the conservation oflegally protected, endangered, rare, threatened, andvulnerable species.Community development groups have alsobeen mobilized for the conservation of soil and waterresources. The Department of Soil Conservation andWatershed Management has promoted theformation of such groups. The Government providedup to 80% of the total cost for terrace improvementand off-farm conservation activities during the early1980s. As per the information provided by theDepartment, the Government has been phasing outthe subsidies, which had been reduced by about 50%by 2002. The cost sharing is based on the nature ofthe activity and the magnitude of the problems.Figure 10.4: Government Revenue from ProtectedAreas (excluding the Annapurna and ManasluConservation Areas)Source: Ministry of Forest and Soil Conservation records148 Environment Assessment of Nepal : Emerging Issues and Challenges
Figure 10.5: Community Savings and Biodiversity Fundsin Protected AreasKNP = Khaptad National Park, KTWR = Koshi Tappu Wildlife Reserve,PWR = Parsa Wildlife Reserve, RBNP = Royal Bardia National Park,RCNP = Royal Chitwan National Park, RNP = Rara National Park,RSWR = Royal Suklaphanta Wildlife ReserveSource: Ministry of Forest and Soil Conservation recordsThese additional incentives and formation ofcommunity development groups have beeninstrumental in encouraging local people to improvenatural resources management, particularly soil andwater conservation.The Government has also initiated collaborativeforest management since 2003 in selected districts ofthe Terai with the objective of managing the foreststhrough the joint participation of users, local bodies,and the Government. The major stakeholdersinclude forestry organizations, particularly theregional forestry directorates and district forestoffices, local bodies such as district developmentcommittees and village development committees,and user groups. The Collaborative ForestManagement Manual (MOFSC 2004) provides forestablishing both “revolving funds” and“development funds.” The former will be utilized forthe commercial felling and transportation of forestproducts (timber and firewood), and thedevelopment fund will be used for developmentactivities. The Government has planned to replenishboth funds though donor assistance. Thedevelopment fund will later be converted to a districtforest sector investment fund and utilized forintensive forest management.The Government of Nepal has also developed amechanism to share the Collaborative ForestManagement benefits. Twenty-five percent of therevenue generated from the sale of timber andfirewood under the scheme will be deposited in thelocal fund and the remainder will go to the nationalconsolidated fund. Funds for local use will bedispersed by the District Forestry SectorDevelopment Coordination Sub-Committee, andsome portion of this fund will be set aside for theimplementation of the Collaborative ForestManagement scheme (MOFSC 2004).The Irrigation Policy 2003 acknowledgespeople’s participation in irrigation development,particularly the involvement of water usersassociations. The policy outlines the framework forcost sharing for the construction of irrigation canalsystems and also provides a framework forownership development (Table 10.3).The Irrigation Policy provides the frameworkshown in Table 10.3. The benefit sharing is based onthe workload for management of the irrigationschemes. After construction of the irrigation project,The Government can hand over managementresponsibility to the water users association, andabout 95% of the benefits derived from irrigation feesare deposited into the users’ fund. This enhances thepossibility for generating more funds for irrigationwater management and opportunities for involvingthe beneficiaries in the process (see Table 10.4). Asthe irrigation projects are scattered, there aredifficulties in fully assessing the funds generated bythis policy. However, they are expected to besignificant.Table 10.3: Users’ Share in Irrigation ProjectConstructionAverageIrrigable AreaPercentage of Share (of TotalInvestment)Main BranchCanal CanalHeadworkDistributionCanalLess than 0.5 ha 0 0 0 10O.5 ha–1.0 ha 0 0 5 101.0 ha–5.0 ha 1 3 7 125 ha or above 3 5 10 15ha = hectareSource: MOWR (1993)Private Sector InvestmentPrivate sector organizations are also involved inenvironmental management, particularly forpollution control. Some of the breweries such asTuborg Beer Company at Nawalparasi District andSan Miguel Beer Company at Chitwan District havedeveloped effluent treatment plants to treat theirchemical and biological wastes. The Governmenthas also introduced an environmental managementsystem and energy conservation scheme in selectedindustries with the assistance of Danish InternationalDevelopment Agency (DANIDA) to reduce pollutionload at source. Some industries are practicingenvironmental management systems. For example,the Godavari Marble Factory located at Godavari inLalitpur district of Kathmandu Valley has joined theenvironmental management systems program. Anumber of environmental problems have cropped upduring mining and processing of marble. The areaexperiences the loss of topsoil and plants, noise, andChapter 10: Environmental Financing149
- Page 2 and 3:
About the OrganisationsAsian Develo
- Page 4 and 5:
© 2006 International Centre for In
- Page 6 and 7:
AcknowledgementsWe would like to ex
- Page 8 and 9:
PM2.5PAHRSSAARCSACEPSEASO 2TSPUKUND
- Page 10 and 11:
Chapter 6: Energy Resources 65Intro
- Page 12 and 13:
List of FiguresFigure 2.1: People a
- Page 14 and 15:
Table 6.1: Energy Consumption and P
- Page 16 and 17:
forests are also used for infrastru
- Page 18 and 19:
as data gathered by different agenc
- Page 20 and 21:
Table 2.1: Population Growth Rates
- Page 22 and 23:
mortality rates for rural and urban
- Page 24 and 25:
Agglomeration village in the centra
- Page 26 and 27:
soil erosion, and depletion of wate
- Page 30 and 31:
provision remains inadequate becaus
- Page 32 and 33:
Malnutrition remains a serious obst
- Page 34 and 35:
Table 2.24: Existing and Projected
- Page 36 and 37:
Table 2.28: Income Poverty Indicato
- Page 38 and 39:
Table 2.31: Change in Employment St
- Page 40 and 41:
In 2004, the average annual househo
- Page 42 and 43:
Mountain areas have the most food i
- Page 44 and 45:
Schaffner, U. 1987. “Road Constru
- Page 46 and 47:
Table 3.1: Agricultural Economic De
- Page 48 and 49:
Table 3.4: Estimated Soil Erosion R
- Page 50 and 51:
B. PradhanImpacts of land degradati
- Page 52 and 53:
Carson, B. 1985. “Erosion and Sed
- Page 54 and 55:
The trend of forest coverage in the
- Page 56 and 57:
BiodiversityState of BiodiversityNe
- Page 58 and 59:
The Government has given legal prot
- Page 60 and 61:
Different ways of maintaining biodi
- Page 62 and 63:
———.2004. State of the Enviro
- Page 64 and 65:
Appendix 4.1: Table continuedMajor
- Page 66 and 67:
Appendix 4.2: Protected Plant and W
- Page 68 and 69:
Table A4.2.3: Nepal's Share in Plan
- Page 70 and 71:
to intense weathering, and percolat
- Page 72 and 73:
Table 5.5: Water Supply and Water T
- Page 74 and 75:
Table 5.9: Water Quality of Shallow
- Page 76 and 77:
species are reported to be endanger
- Page 78 and 79:
Ministry of Water Resources (MOWR).
- Page 80 and 81:
Definition, Forms, and UnitsEnergy
- Page 82 and 83:
Table 6.5: Hydropower PotentialRive
- Page 84 and 85:
Chilime Hydroelectric Project: An E
- Page 86 and 87:
load occurs from 6 pm to 9 pm with
- Page 88 and 89:
assessment of wind energy and lack
- Page 90 and 91:
Review of Dams and Development by t
- Page 92 and 93:
IUCNElizabeth Khaka, UNEP-NairobiRu
- Page 94 and 95:
therefore reflect the three guiding
- Page 96 and 97:
is a seasonal dust storm. Anthropog
- Page 98 and 99:
Figure 7.3: Average Air Quality, Ja
- Page 100 and 101:
matter, hydrocarbons, and NO x (Nae
- Page 102 and 103:
Figure: 7.9: Vehicle Registered in
- Page 104 and 105:
Brick Kilnchlorofluorocarbons (HCFC
- Page 106 and 107:
Climate ChangeA region’s climate
- Page 108 and 109:
Figure 7.14: Mean Annual Precipitat
- Page 110 and 111:
Table 7.3: National Ambient Air Qua
- Page 112 and 113: India. Available: http://www.cleana
- Page 114 and 115: ———.1999. “Ambient Air Qual
- Page 116 and 117: Appendix 7.1: World Health Organiza
- Page 118 and 119: Table 8.1: Criteria for Urban Statu
- Page 120 and 121: accommodate the rapidly increasing
- Page 122 and 123: managing solid waste. They are part
- Page 124 and 125: In most municipalities, hazardous w
- Page 126 and 127: in worsening public health conditio
- Page 128 and 129: objects of archaeological, historic
- Page 130 and 131: Min BajracharyaB. PradhanVehicles a
- Page 132 and 133: Department of Health Services (DOHS
- Page 134 and 135: Table 9.1 describes the major highl
- Page 136 and 137: the period to up 2017. The document
- Page 138 and 139: earthquakes; and awareness raising
- Page 140 and 141: Sub-regional LinkagesOther developi
- Page 142 and 143: Figure 9.1: The Key Environmental I
- Page 144 and 145: (iv)(v)(vi)plants, and other non-ti
- Page 146 and 147: environmental governance can be bet
- Page 148 and 149: can vary considerably. Both sides h
- Page 150 and 151: Dhungel, D.N., and A.B. Rajbhandari
- Page 152 and 153: Table A9.1.2: Industry-Specific Tol
- Page 154 and 155: . Cultural Heritage8. Convention fo
- Page 156 and 157: Appendix 9.3: Some Prominent Enviro
- Page 158 and 159: Some funding arrangements made by t
- Page 160 and 161: (NARDF 2004) for a period of 1 to 3
- Page 164 and 165: Table 10.4: Users’ Share in Benef
- Page 166 and 167: From Hands Around Everest bookFrom
- Page 168 and 169: Table 10.8: Subsidy Rate for Biogas
- Page 170 and 171: microorganism communities and the n
- Page 172 and 173: subsidies (Mason 1996). All these a
- Page 174 and 175: addressed only part of the problem.
- Page 176 and 177: historical practice of community-ma
- Page 178 and 179: moved or relocated. The fact that s
- Page 180 and 181: Kathmandu Valley and receives a lar
- Page 182 and 183: cooperative ventures provided neith
- Page 184 and 185: further poaching has not been repor
- Page 186 and 187: http://www.pugwash.org/reports/pac/
- Page 188 and 189: United Nations. 2003. World Populat
- Page 190 and 191: how other countries with substantia
- Page 192 and 193: (i) Broad-based and sustainable eco
- Page 194 and 195: Although progress is encouraging, m
- Page 196 and 197: Nepal’s Changing Pattern of Trade
- Page 198 and 199: Table 12.2: Trade/ GDP RatiosFY1981
- Page 200 and 201: Table 12.5: Percentage Share of Maj
- Page 202 and 203: well as other provisions in specifi
- Page 204 and 205: Future Implications for NepalIncrea
- Page 206 and 207: International Trade Forum (ITN). 20
- Page 208 and 209: - Gross domestic product per unit e
- Page 210 and 211: Time Series InformationGenerally tw
- Page 212 and 213:
Table 13.1a: Different Datasets Col
- Page 214 and 215:
elevant due to its multidisciplinar
- Page 216 and 217:
Figure 13.6: Examples of Applicatio
- Page 218 and 219:
Judith DobmannThere are many source
- Page 220 and 221:
———.2003. Mapping Nepal Censu
- Page 222 and 223:
sustainable livelihoods requires an
- Page 224 and 225:
and haphazard. Population pressures
- Page 226 and 227:
issue. These deficiencies stem from
- Page 228 and 229:
population must be assessed. MOEST
- Page 230 and 231:
Appendix 14.1: List of Key Environm
- Page 232 and 233:
(vii) The EIA report approving agen
- Page 234 and 235:
Goal 1: Eradicate extreme poverty a
- Page 236 and 237:
Nepal’s Progress Towards the MDGs
- Page 238 and 239:
Goal 4: Reduce child mortalityReduc