

ADB_book_18 April.qxp - Himalayan Document Centre - icimod
ADB_book_18 April.qxp - Himalayan Document Centre - icimod
ADB_book_18 April.qxp - Himalayan Document Centre - icimod
- No tags were found...

You also want an ePaper? Increase the reach of your titles
YUMPU automatically turns print PDFs into web optimized ePapers that Google loves.
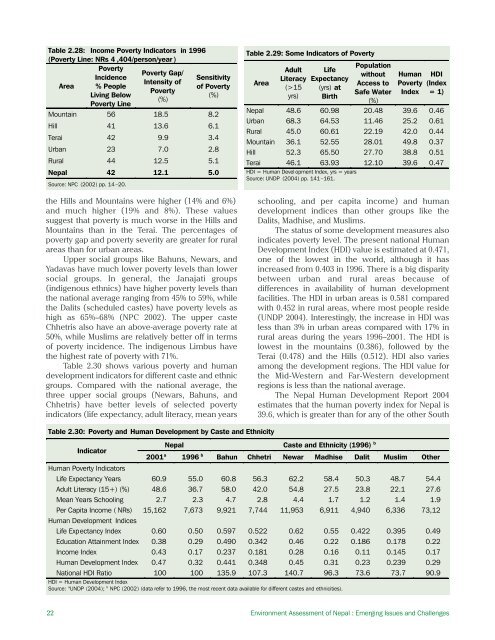
Table 2.28: Income Poverty Indicators in 1996(Poverty Line: NRs 4 ,404/person/year )PovertyPoverty Gap/IncidenceSensitivityIntensity ofArea % Peopleof PovertyPovertyLiving Below(%)(%)Poverty LineMountain 56 <strong>18</strong>.5 8.2Hill 41 13.6 6.1Terai 42 9.9 3.4Urban 23 7.0 2.8Rural 44 12.5 5.1Nepal 42 12.1 5.0Source: NPC (2002) pp. 14 –20.the Hills and Mountains were higher (14% and 6%)and much higher (19% and 8%). These valuessuggest that poverty is much worse in the Hills andMountains than in the Terai. The percentages ofpoverty gap and poverty severity are greater for ruralareas than for urban areas.Upper social groups like Bahuns, Newars, andYadavas have much lower poverty levels than lowersocial groups. In general, the Janajati groups(indigenous ethnics) have higher poverty levels thanthe national average ranging from 45% to 59%, whilethe Dalits (scheduled castes) have poverty levels ashigh as 65%–68% (NPC 2002). The upper casteChhetris also have an above-average poverty rate at50%, while Muslims are relatively better off in termsof poverty incidence. The indigenous Limbus havethe highest rate of poverty with 71%.Table 2.30 shows various poverty and humandevelopment indicators for different caste and ethnicgroups. Compared with the national average, thethree upper social groups (Newars, Bahuns, andChhetris) have better levels of selected povertyindicators (life expectancy, adult literacy, mean yearsTable 2.29: Some Indicators of PovertyAreaAdultLiteracy(>15yrs)LifeExpectancy(yrs) atBirthPopulationwithoutAccess toSafe Water(%)HumanPovertyIndexHDI(Index= 1)Nepal 48.6 60.98 20.48 39.6 0.46Urban 68.3 64.53 11.46 25.2 0.61Rural 45.0 60.61 22.19 42.0 0.44Mountain 36.1 52.55 28.01 49.8 0.37Hill 52.3 65.50 27.70 38.8 0.51Terai 46.1 63.93 12.10 39.6 0.47HDI = Human Devel opment Index, yrs = yearsSource: UNDP (2004) pp. 141–161.schooling, and per capita income) and humandevelopment indices than other groups like theDalits, Madhise, and Muslims.The status of some development measures alsoindicates poverty level. The present national HumanDevelopment Index (HDI) value is estimated at 0.471,one of the lowest in the world, although it hasincreased from 0.403 in 1996. There is a big disparitybetween urban and rural areas because ofdifferences in availability of human developmentfacilities. The HDI in urban areas is 0.581 comparedwith 0.452 in rural areas, where most people reside(UNDP 2004). Interestingly, the increase in HDI wasless than 3% in urban areas compared with 17% inrural areas during the years 1996–2001. The HDI islowest in the mountains (0.386), followed by theTerai (0.478) and the Hills (0.512). HDI also variesamong the development regions. The HDI value forthe Mid-Western and Far-Western developmentregions is less than the national average.The Nepal Human Development Report 2004estimates that the human poverty index for Nepal is39.6, which is greater than for any of the other SouthTable 2.30: Poverty and Human Development by Caste and EthnicityIndicatorHuman Poverty IndicatorsNepalCaste and Ethnicity (1996) b2001 a 1996 b Bahun Chhetri Newar Madhise Dalit Muslim OtherLife Expectancy Years 60.9 55.0 60.8 56.3 62.2 58.4 50.3 48.7 54.4Adult Literacy (15+) (%) 48.6 36.7 58.0 42.0 54.8 27.5 23.8 22.1 27.6Mean Years Schooling 2.7 2.3 4.7 2.8 4.4 1.7 1.2 1.4 1.9Per Capita Income ( NRs) 15,162 7,673 9,921 7,744 11,953 6,911 4,940 6,336 73,12Human Development IndicesLife Expectancy Index 0.60 0.50 0.597 0.522 0.62 0.55 0.422 0.395 0.49Education Attainment Index 0.38 0.29 0.490 0.342 0.46 0.22 0.<strong>18</strong>6 0.178 0.22Income Index 0.43 0.17 0.237 0.<strong>18</strong>1 0.28 0.16 0.11 0.145 0.17Human Development Index 0.47 0.32 0.441 0.348 0.45 0.31 0.23 0.239 0.29National HDI Ratio 100 100 135.9 107.3 140.7 96.3 73.6 73.7 90.9HDI = Human Development IndexSource: a UNDP (2004); b NPC (2002) (data refer to 1996, the most recent data available for different castes and ethnicities).22 Environment Assessment of Nepal : Emerging Issues and Challenges


