ADB_book_18 April.qxp - Himalayan Document Centre - icimod
ADB_book_18 April.qxp - Himalayan Document Centre - icimod
ADB_book_18 April.qxp - Himalayan Document Centre - icimod
- No tags were found...
You also want an ePaper? Increase the reach of your titles
YUMPU automatically turns print PDFs into web optimized ePapers that Google loves.
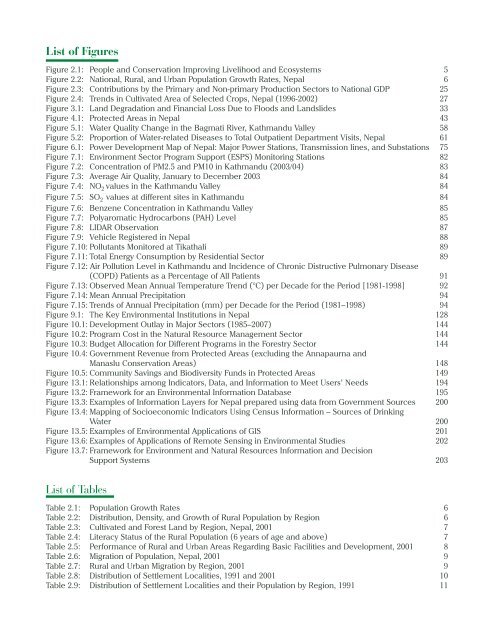
List of FiguresFigure 2.1: People and Conservation Improving Livelihood and Ecosystems 5Figure 2.2: National, Rural, and Urban Population Growth Rates, Nepal 6Figure 2.3: Contributions by the Primary and Non-primary Production Sectors to National GDP 25Figure 2.4: Trends in Cultivated Area of Selected Crops, Nepal (1996-2002) 27Figure 3.1: Land Degradation and Financial Loss Due to Floods and Landslides 33Figure 4.1: Protected Areas in Nepal 43Figure 5.1: Water Quality Change in the Bagmati River, Kathmandu Valley 58Figure 5.2: Proportion of Water-related Diseases to Total Outpatient Department Visits, Nepal 61Figure 6.1: Power Development Map of Nepal: Major Power Stations, Transmission lines, and Substations 75Figure 7.1: Environment Sector Program Support (ESPS) Monitoring Stations 82Figure 7.2: Concentration of PM2.5 and PM10 in Kathmandu (2003/04) 83Figure 7.3: Average Air Quality, January to December 2003 84Figure 7.4: NO 2 values in the Kathmandu Valley 84Figure 7.5: SO 2 values at different sites in Kathmandu 84Figure 7.6: Benzene Concentration in Kathmandu Valley 85Figure 7.7: Polyaromatic Hydrocarbons (PAH) Level 85Figure 7.8: LIDAR Observation 87Figure 7.9: Vehicle Registered in Nepal 88Figure 7.10: Pollutants Monitored at Tikathali 89Figure 7.11: Total Energy Consumption by Residential Sector 89Figure 7.12: Air Pollution Level in Kathmandu and Incidence of Chronic Distructive Pulmonary Disease(COPD) Patients as a Percentage of All Patients 91Figure 7.13: Observed Mean Annual Temperature Trend (°C) per Decade for the Period [1981-1998] 92Figure 7.14: Mean Annual Precipitation 94Figure 7.15: Trends of Annual Precipitation (mm) per Decade for the Period (1981–1998) 94Figure 9.1: The Key Environmental Institutions in Nepal 128Figure 10.1: Development Outlay in Major Sectors (1985–2007) 144Figure 10.2: Program Cost in the Natural Resource Management Sector 144Figure 10.3: Budget Allocation for Different Programs in the Forestry Sector 144Figure 10.4: Government Revenue from Protected Areas (excluding the Annapaurna andManaslu Conservation Areas) 148Figure 10.5: Community Savings and Biodiversity Funds in Protected Areas 149Figure 13.1: Relationships among Indicators, Data, and Information to Meet Users’ Needs 194Figure 13.2: Framework for an Environmental Information Database 195Figure 13.3: Examples of Information Layers for Nepal prepared using data from Government Sources 200Figure 13.4: Mapping of Socioeconomic Indicators Using Census Information – Sources of DrinkingWater 200Figure 13.5: Examples of Environmental Applications of GIS 201Figure 13.6: Examples of Applications of Remote Sensing in Environmental Studies 202Figure 13.7: Framework for Environment and Natural Resources Information and DecisionSupport Systems 203List of TablesTable 2.1: Population Growth Rates 6Table 2.2: Distribution, Density, and Growth of Rural Population by Region 6Table 2.3: Cultivated and Forest Land by Region, Nepal, 2001 7Table 2.4: Literacy Status of the Rural Population (6 years of age and above) 7Table 2.5: Performance of Rural and Urban Areas Regarding Basic Facilities and Development, 2001 8Table 2.6: Migration of Population, Nepal, 2001 9Table 2.7: Rural and Urban Migration by Region, 2001 9Table 2.8: Distribution of Settlement Localities, 1991 and 2001 10Table 2.9: Distribution of Settlement Localities and their Population by Region, 1991 11


