Brick Kilnchlorofluorocarbons (HCFC–22) as ozone depletingsubstances (ODS). The consumption of these twosubstances was 30 tons and 23 tons, respectively(NBSM and UNEP undated). The country does notproduce any ODS itself—all these substances areimported. The annual per capita ODS consumptionin Nepal in 1999 was 0.0013 kg. The regulatorymeasures developed to address the problem aredescribed in a later section.Natural Sources of Air PollutionNatural sources of air pollution include suchthings as volcanic eruption, forest fires, pollens fromvegetation, and salt particles from sea spray. Forestfires occur annually in all the major physiographicand climatic regions of Nepal, including the Terai andBhabar, the Siwaliks or the inner Terai, the MiddleMountains, and the High Mountains, althoughreliable statistics are not available. Pollen grains areanother natural contaminant associated with healthproblems such as allergies. Many people suffer fromasthma or hay fever although the symptomsdisappear at the end of the pollen season—someeven develop bronchitis, bronchial asthma, anddermatitis. Suspended dust from roads is also highlyvisible in Nepal, adding to the suspended particleload in the air.Impact of Air PollutionAlthough air pollution has become a visible environmentalproblem in the last decade, only limited dataare available to evaluate its magnitude and impact.The health impact of indoor and outdoor airpollution can be assessed by the increase in thenumber of patients suffering from diseases related toair pollution. Health effects range from minorirritation of eyes and the upper respiratory system tochronic respiratory disease, heart disease, lungcancer, and death. Air pollution has been shown toB.B. Pradhancause acute respiratory infections in children andchronic bronchitis in adults. It has also been shownto worsen the condition of people with pre-existingheart or lung disease. Among asthmatics, airpollution has been shown to aggravate the frequencyand severity of attacks. Both short-term and longtermexposures have also been linked to prematuremortality and reduced life expectancy (Mishra 2003).The health impact of air pollution depends onthe pollutant type, its concentration in the air, lengthof exposure, other pollutants in the air, and individualsusceptibility. Different people are affected by airpollution in different ways. Poor people,undernourished people, the very young and very old,and people with pre-existing respiratory disease andother ill health are more at risk (Mishra 2003).Exposure to particles can lead to a variety ofserious health problems. Fine particles pose thegreatest problems because they can get deep intothe lungs and some fine particles into thebloodstream. Long-term exposure to particulatematter shows decreased lung function, chronicbronchitis, premature deaths, and heart attacks. Nolong-term epidemiological studies have beenconducted in Nepal, but a few studies haveconducted preliminary medical examinations of agroup of exposed people or used dose-responserelationships developed elsewhere.According to the data published by the thenMinistry of Health (now Ministry of Health andPopulation), among patients visiting the majorhospital (DOHS 2003), ARI ranks as the third-highestcause of morbidity in Nepal after diarrhea, affecting3.13% of the total population (this document,Chapter 2, Table 2.<strong>18</strong>). Chronic bronchitis falls at theeighth position.Pandey et al. (1987) examined 240 rural childrenunder 2 years of age for 6 months and found asignificant relationship between the number of hoursspent near the fire (as reported by the mother) andthe incidence of moderate and severe cases of ARI.The study suggested that indoor air pollution is animportant risk factor for ARI. A 1971 review of thecases of discharges from ten hospitals with acombined capacity of 265 beds revealed that ARIaccounted for 32% of mortality for infants less than 1year and 11% for children aged 1–4 (WINROCK2004).COPD is another major risk, especially amongwomen, and has been strongly associated withsmoke exposure from cooking on open biomassstoves. In rural Nepal, nearly 15% of non-smokingwomen 20 years and older had chronic bronchitis(WINROCK 2004), a high rate for non-smokers.Similar cases are observed in the urban centerswhere outdoor air pollution is soaring. A study by the90 Environment Assessment of Nepal : Emerging Issues and Challenges
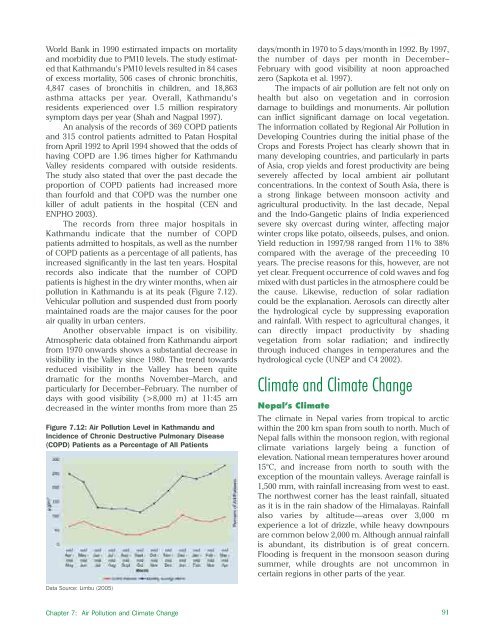
World Bank in 1990 estimated impacts on mortalityand morbidity due to PM10 levels. The study estimatedthat Kathmandu’s PM10 levels resulted in 84 casesof excess mortality, 506 cases of chronic bronchitis,4,847 cases of bronchitis in children, and <strong>18</strong>,863asthma attacks per year. Overall, Kathmandu’sresidents experienced over 1.5 million respiratorysymptom days per year (Shah and Nagpal 1997).An analysis of the records of 369 COPD patientsand 315 control patients admitted to Patan Hospitalfrom <strong>April</strong> 1992 to <strong>April</strong> 1994 showed that the odds ofhaving COPD are 1.96 times higher for KathmanduValley residents compared with outside residents.The study also stated that over the past decade theproportion of COPD patients had increased morethan fourfold and that COPD was the number onekiller of adult patients in the hospital (CEN andENPHO 2003).The records from three major hospitals inKathmandu indicate that the number of COPDpatients admitted to hospitals, as well as the numberof COPD patients as a percentage of all patients, hasincreased significantly in the last ten years. Hospitalrecords also indicate that the number of COPDpatients is highest in the dry winter months, when airpollution in Kathmandu is at its peak (Figure 7.12).Vehicular pollution and suspended dust from poorlymaintained roads are the major causes for the poorair quality in urban centers.Another observable impact is on visibility.Atmospheric data obtained from Kathmandu airportfrom 1970 onwards shows a substantial decrease invisibility in the Valley since 1980. The trend towardsreduced visibility in the Valley has been quitedramatic for the months November–March, andparticularly for December–February. The number ofdays with good visibility (>8,000 m) at 11:45 amdecreased in the winter months from more than 25Figure 7.12: Air Pollution Level in Kathmandu andIncidence of Chronic Destructive Pulmonary Disease(COPD) Patients as a Percentage of All Patientsdays/month in 1970 to 5 days/month in 1992. By 1997,the number of days per month in December–February with good visibility at noon approachedzero (Sapkota et al. 1997).The impacts of air pollution are felt not only onhealth but also on vegetation and in corrosiondamage to buildings and monuments. Air pollutioncan inflict significant damage on local vegetation.The information collated by Regional Air Pollution inDeveloping Countries during the initial phase of theCrops and Forests Project has clearly shown that inmany developing countries, and particularly in partsof Asia, crop yields and forest productivity are beingseverely affected by local ambient air pollutantconcentrations. In the context of South Asia, there isa strong linkage between monsoon activity andagricultural productivity. In the last decade, Nepaland the Indo-Gangetic plains of India experiencedsevere sky overcast during winter, affecting majorwinter crops like potato, oilseeds, pulses, and onion.Yield reduction in 1997/98 ranged from 11% to 38%compared with the average of the preceeding 10years. The precise reasons for this, however, are notyet clear. Frequent occurrence of cold waves and fogmixed with dust particles in the atmosphere could bethe cause. Likewise, reduction of solar radiationcould be the explanation. Aerosols can directly alterthe hydrological cycle by suppressing evaporationand rainfall. With respect to agricultural changes, itcan directly impact productivity by shadingvegetation from solar radiation; and indirectlythrough induced changes in temperatures and thehydrological cycle (UNEP and C4 2002).Climate and Climate ChangeNepal’s ClimateThe climate in Nepal varies from tropical to arcticwithin the 200 km span from south to north. Much ofNepal falls within the monsoon region, with regionalclimate variations largely being a function ofelevation. National mean temperatures hover around15°C, and increase from north to south with theexception of the mountain valleys. Average rainfall is1,500 mm, with rainfall increasing from west to east.The northwest corner has the least rainfall, situatedas it is in the rain shadow of the Himalayas. Rainfallalso varies by altitude—areas over 3,000 mexperience a lot of drizzle, while heavy downpoursare common below 2,000 m. Although annual rainfallis abundant, its distribution is of great concern.Flooding is frequent in the monsoon season duringsummer, while droughts are not uncommon incertain regions in other parts of the year.Data Source: Limbu (2005)Chapter 7: Air Pollution and Climate Change91
- Page 2 and 3:
About the OrganisationsAsian Develo
- Page 4 and 5:
© 2006 International Centre for In
- Page 6 and 7:
AcknowledgementsWe would like to ex
- Page 8 and 9:
PM2.5PAHRSSAARCSACEPSEASO 2TSPUKUND
- Page 10 and 11:
Chapter 6: Energy Resources 65Intro
- Page 12 and 13:
List of FiguresFigure 2.1: People a
- Page 14 and 15:
Table 6.1: Energy Consumption and P
- Page 16 and 17:
forests are also used for infrastru
- Page 18 and 19:
as data gathered by different agenc
- Page 20 and 21:
Table 2.1: Population Growth Rates
- Page 22 and 23:
mortality rates for rural and urban
- Page 24 and 25:
Agglomeration village in the centra
- Page 26 and 27:
soil erosion, and depletion of wate
- Page 30 and 31:
provision remains inadequate becaus
- Page 32 and 33:
Malnutrition remains a serious obst
- Page 34 and 35:
Table 2.24: Existing and Projected
- Page 36 and 37:
Table 2.28: Income Poverty Indicato
- Page 38 and 39:
Table 2.31: Change in Employment St
- Page 40 and 41:
In 2004, the average annual househo
- Page 42 and 43:
Mountain areas have the most food i
- Page 44 and 45:
Schaffner, U. 1987. “Road Constru
- Page 46 and 47:
Table 3.1: Agricultural Economic De
- Page 48 and 49:
Table 3.4: Estimated Soil Erosion R
- Page 50 and 51:
B. PradhanImpacts of land degradati
- Page 52 and 53:
Carson, B. 1985. “Erosion and Sed
- Page 54 and 55: The trend of forest coverage in the
- Page 56 and 57: BiodiversityState of BiodiversityNe
- Page 58 and 59: The Government has given legal prot
- Page 60 and 61: Different ways of maintaining biodi
- Page 62 and 63: ———.2004. State of the Enviro
- Page 64 and 65: Appendix 4.1: Table continuedMajor
- Page 66 and 67: Appendix 4.2: Protected Plant and W
- Page 68 and 69: Table A4.2.3: Nepal's Share in Plan
- Page 70 and 71: to intense weathering, and percolat
- Page 72 and 73: Table 5.5: Water Supply and Water T
- Page 74 and 75: Table 5.9: Water Quality of Shallow
- Page 76 and 77: species are reported to be endanger
- Page 78 and 79: Ministry of Water Resources (MOWR).
- Page 80 and 81: Definition, Forms, and UnitsEnergy
- Page 82 and 83: Table 6.5: Hydropower PotentialRive
- Page 84 and 85: Chilime Hydroelectric Project: An E
- Page 86 and 87: load occurs from 6 pm to 9 pm with
- Page 88 and 89: assessment of wind energy and lack
- Page 90 and 91: Review of Dams and Development by t
- Page 92 and 93: IUCNElizabeth Khaka, UNEP-NairobiRu
- Page 94 and 95: therefore reflect the three guiding
- Page 96 and 97: is a seasonal dust storm. Anthropog
- Page 98 and 99: Figure 7.3: Average Air Quality, Ja
- Page 100 and 101: matter, hydrocarbons, and NO x (Nae
- Page 102 and 103: Figure: 7.9: Vehicle Registered in
- Page 106 and 107: Climate ChangeA region’s climate
- Page 108 and 109: Figure 7.14: Mean Annual Precipitat
- Page 110 and 111: Table 7.3: National Ambient Air Qua
- Page 112 and 113: India. Available: http://www.cleana
- Page 114 and 115: ———.1999. “Ambient Air Qual
- Page 116 and 117: Appendix 7.1: World Health Organiza
- Page 118 and 119: Table 8.1: Criteria for Urban Statu
- Page 120 and 121: accommodate the rapidly increasing
- Page 122 and 123: managing solid waste. They are part
- Page 124 and 125: In most municipalities, hazardous w
- Page 126 and 127: in worsening public health conditio
- Page 128 and 129: objects of archaeological, historic
- Page 130 and 131: Min BajracharyaB. PradhanVehicles a
- Page 132 and 133: Department of Health Services (DOHS
- Page 134 and 135: Table 9.1 describes the major highl
- Page 136 and 137: the period to up 2017. The document
- Page 138 and 139: earthquakes; and awareness raising
- Page 140 and 141: Sub-regional LinkagesOther developi
- Page 142 and 143: Figure 9.1: The Key Environmental I
- Page 144 and 145: (iv)(v)(vi)plants, and other non-ti
- Page 146 and 147: environmental governance can be bet
- Page 148 and 149: can vary considerably. Both sides h
- Page 150 and 151: Dhungel, D.N., and A.B. Rajbhandari
- Page 152 and 153: Table A9.1.2: Industry-Specific Tol
- Page 154 and 155:
. Cultural Heritage8. Convention fo
- Page 156 and 157:
Appendix 9.3: Some Prominent Enviro
- Page 158 and 159:
Some funding arrangements made by t
- Page 160 and 161:
(NARDF 2004) for a period of 1 to 3
- Page 162 and 163:
Table 10.2: Annual Income and Expen
- Page 164 and 165:
Table 10.4: Users’ Share in Benef
- Page 166 and 167:
From Hands Around Everest bookFrom
- Page 168 and 169:
Table 10.8: Subsidy Rate for Biogas
- Page 170 and 171:
microorganism communities and the n
- Page 172 and 173:
subsidies (Mason 1996). All these a
- Page 174 and 175:
addressed only part of the problem.
- Page 176 and 177:
historical practice of community-ma
- Page 178 and 179:
moved or relocated. The fact that s
- Page 180 and 181:
Kathmandu Valley and receives a lar
- Page 182 and 183:
cooperative ventures provided neith
- Page 184 and 185:
further poaching has not been repor
- Page 186 and 187:
http://www.pugwash.org/reports/pac/
- Page 188 and 189:
United Nations. 2003. World Populat
- Page 190 and 191:
how other countries with substantia
- Page 192 and 193:
(i) Broad-based and sustainable eco
- Page 194 and 195:
Although progress is encouraging, m
- Page 196 and 197:
Nepal’s Changing Pattern of Trade
- Page 198 and 199:
Table 12.2: Trade/ GDP RatiosFY1981
- Page 200 and 201:
Table 12.5: Percentage Share of Maj
- Page 202 and 203:
well as other provisions in specifi
- Page 204 and 205:
Future Implications for NepalIncrea
- Page 206 and 207:
International Trade Forum (ITN). 20
- Page 208 and 209:
- Gross domestic product per unit e
- Page 210 and 211:
Time Series InformationGenerally tw
- Page 212 and 213:
Table 13.1a: Different Datasets Col
- Page 214 and 215:
elevant due to its multidisciplinar
- Page 216 and 217:
Figure 13.6: Examples of Applicatio
- Page 218 and 219:
Judith DobmannThere are many source
- Page 220 and 221:
———.2003. Mapping Nepal Censu
- Page 222 and 223:
sustainable livelihoods requires an
- Page 224 and 225:
and haphazard. Population pressures
- Page 226 and 227:
issue. These deficiencies stem from
- Page 228 and 229:
population must be assessed. MOEST
- Page 230 and 231:
Appendix 14.1: List of Key Environm
- Page 232 and 233:
(vii) The EIA report approving agen
- Page 234 and 235:
Goal 1: Eradicate extreme poverty a
- Page 236 and 237:
Nepal’s Progress Towards the MDGs
- Page 238 and 239:
Goal 4: Reduce child mortalityReduc