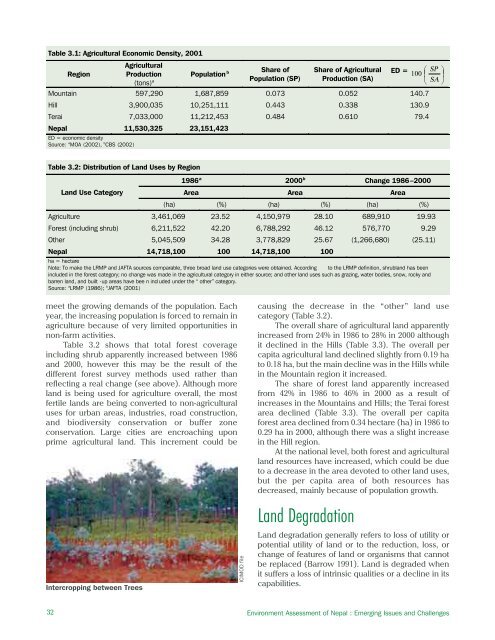
Table 3.1: Agricultural Economic Density, 2001RegionAgriculturalProduction(tons) a Population b Share ofPopulation (SP)Share of AgriculturalProduction (SA)ED =100Mountain 597,290 1,687,859 0.073 0.052 140.7Hill 3,900,035 10,251,111 0.443 0.338 130.9Terai 7,033,000 11,212,453 0.484 0.610 79.4Nepal 11,530,325 23,151,423ED = economic densitySource: a MOA (2002), b CBS (2002)SP SA Table 3.2: Distribution of Land Uses by RegionLand Use Category1986 a 2000 b Change 1986–2000Area Area Area(ha) (%) (ha) (%) (ha) (%)Agriculture 3,461,069 23.52 4,150,979 28.10 689,910 19.93Forest (including shrub) 6,211,522 42.20 6,788,292 46.12 576,770 9.29Other 5,045,509 34.28 3,778,829 25.67 (1,266,680) (25.11)Nepal 14,7<strong>18</strong>,100 100 14,7<strong>18</strong>,100 100ha = hectareNote: To make the LRMP and JAFTA sources comparable, three broad land use categories were obtained. According to the LRMP definition, shrubland has beenincluded in the forest category; no change was made in the agricultural category in either source; and other land uses such as grazing, water bodies, snow, rocky andbarren land, and built -up areas have bee n included under the “ other” category.Source: a LRMP (1986); b JAFTA (2001)meet the growing demands of the population. Eachyear, the increasing population is forced to remain inagriculture because of very limited opportunities innon-farm activities.Table 3.2 shows that total forest coverageincluding shrub apparently increased between 1986and 2000, however this may be the result of thedifferent forest survey methods used rather thanreflecting a real change (see above). Although moreland is being used for agriculture overall, the mostfertile lands are being converted to non-agriculturaluses for urban areas, industries, road construction,and biodiversity conservation or buffer zoneconservation. Large cities are encroaching uponprime agricultural land. This increment could beIntercropping between TreesICIMOD filecausing the decrease in the “other” land usecategory (Table 3.2).The overall share of agricultural land apparentlyincreased from 24% in 1986 to 28% in 2000 althoughit declined in the Hills (Table 3.3). The overall percapita agricultural land declined slightly from 0.19 hato 0.<strong>18</strong> ha, but the main decline was in the Hills whilein the Mountain region it increased.The share of forest land apparently increasedfrom 42% in 1986 to 46% in 2000 as a result ofincreases in the Mountains and Hills; the Terai forestarea declined (Table 3.3). The overall per capitaforest area declined from 0.34 hectare (ha) in 1986 to0.29 ha in 2000, although there was a slight increasein the Hill region.At the national level, both forest and agriculturalland resources have increased, which could be dueto a decrease in the area devoted to other land uses,but the per capita area of both resources hasdecreased, mainly because of population growth.Land DegradationLand degradation generally refers to loss of utility orpotential utility of land or to the reduction, loss, orchange of features of land or organisms that cannotbe replaced (Barrow 1991). Land is degraded whenit suffers a loss of intrinsic qualities or a decline in itscapabilities.32 Environment Assessment of Nepal : Emerging Issues and Challenges
Table 3.3: Change in Agricultural and Forest Lands by RegionRegionAgricultural Land(%)Per Capita Agricultural Land(ha)Forest Land(%)Per Capita Forest Land(ha)1986 a 2000 b 1986 a 2000 b 1986 a 2000 b 1986 a 2000 bMountain 5.33 10.02 0.19 0.31 27.50 31.03 0.99 0.95Hill 33.37 28.06 0.24 0.17 50.06 62.89 0.36 0.38Terai 41.57 56.17 0.16 0.17 50.43 38.88 0.20 0.12Nepal 23.52 28.20 0.19 0.<strong>18</strong> 42.20 46.12 0.34 0.29ha = hectareNote: The population for de nsity computation of agricultural and forest resources in 1986 and 2000 is based on the 1991 and 2001 population censusesrespectively.Source: a LRMP (1986); b JAFTA (2001)Environments and ecosystems are increasinglymore controlled or disrupted and degraded byhuman activities. Landslides, topsoil erosion,siltation, and salinization are different forms of landdegradation. Visible forms of land degradationinclude dust storms, deep gullies, and landslides.Figure 3.1: Land Degradation and Financial Loss Due toFloods and LandslidesCauses of Land DegradationThe magnitude of land degradation in a placedepends on the local geology, land type, landform,land use, rainfall intensity, and human activity. Landdegradation results from any causative factor orcombination of factors that reduces the physical,chemical, or biological status of land and which mayrestrict the land’s productive capacity. Landdegradation is due to (a) natural (biogeophysical)causes, (b) human causes, or (c) a combination ofboth. Owing to the complex features of the mountainterrain, the nature of land degradation varies greatlyin Nepal.Landslides are the most important factor in landdegradation in Nepal. Landslides occur almost everyyear, particularly in the sloping areas of highmountains and low hills during the monsoon season.The consequences of landslides include topsoilerosion; damaged and destroyed roads, trails, andbridges; loss of land, lives, and property; and siltationin low-lying areas resulting in unproductive land(Figure 3.1). About 1.8 million ha (13%) of the land inthe Mountains is estimated to be severely degradedby landslides (CBS 1998).Table 3.4 provides information on soil erosionrates for different land uses, rock types, and slopelevels in the country. The soil erosion rate is higher inthe unmanaged land use category and on steepslopes than in the managed land use category.Similarly, intensity of soil loss is found less incultivated lowlands than in rain-fed sloping terraces,ranging from as low as 7.8 tons/ha/year in theforested Siwalik hills to as much as 570 tons/ha/yearin the unforested midhills (CBS 2004). In the middleHills of Nepal the rate of soil loss in grassland is 0.7-Source: CBS (1998)Bare Land Exposed to Erosion, MustangB. PradhanChapter 3: Land Resources and Land Degradation33
- Page 2 and 3: About the OrganisationsAsian Develo
- Page 4 and 5: © 2006 International Centre for In
- Page 6 and 7: AcknowledgementsWe would like to ex
- Page 8 and 9: PM2.5PAHRSSAARCSACEPSEASO 2TSPUKUND
- Page 10 and 11: Chapter 6: Energy Resources 65Intro
- Page 12 and 13: List of FiguresFigure 2.1: People a
- Page 14 and 15: Table 6.1: Energy Consumption and P
- Page 16 and 17: forests are also used for infrastru
- Page 18 and 19: as data gathered by different agenc
- Page 20 and 21: Table 2.1: Population Growth Rates
- Page 22 and 23: mortality rates for rural and urban
- Page 24 and 25: Agglomeration village in the centra
- Page 26 and 27: soil erosion, and depletion of wate
- Page 30 and 31: provision remains inadequate becaus
- Page 32 and 33: Malnutrition remains a serious obst
- Page 34 and 35: Table 2.24: Existing and Projected
- Page 36 and 37: Table 2.28: Income Poverty Indicato
- Page 38 and 39: Table 2.31: Change in Employment St
- Page 40 and 41: In 2004, the average annual househo
- Page 42 and 43: Mountain areas have the most food i
- Page 44 and 45: Schaffner, U. 1987. “Road Constru
- Page 48 and 49: Table 3.4: Estimated Soil Erosion R
- Page 50 and 51: B. PradhanImpacts of land degradati
- Page 52 and 53: Carson, B. 1985. “Erosion and Sed
- Page 54 and 55: The trend of forest coverage in the
- Page 56 and 57: BiodiversityState of BiodiversityNe
- Page 58 and 59: The Government has given legal prot
- Page 60 and 61: Different ways of maintaining biodi
- Page 62 and 63: ———.2004. State of the Enviro
- Page 64 and 65: Appendix 4.1: Table continuedMajor
- Page 66 and 67: Appendix 4.2: Protected Plant and W
- Page 68 and 69: Table A4.2.3: Nepal's Share in Plan
- Page 70 and 71: to intense weathering, and percolat
- Page 72 and 73: Table 5.5: Water Supply and Water T
- Page 74 and 75: Table 5.9: Water Quality of Shallow
- Page 76 and 77: species are reported to be endanger
- Page 78 and 79: Ministry of Water Resources (MOWR).
- Page 80 and 81: Definition, Forms, and UnitsEnergy
- Page 82 and 83: Table 6.5: Hydropower PotentialRive
- Page 84 and 85: Chilime Hydroelectric Project: An E
- Page 86 and 87: load occurs from 6 pm to 9 pm with
- Page 88 and 89: assessment of wind energy and lack
- Page 90 and 91: Review of Dams and Development by t
- Page 92 and 93: IUCNElizabeth Khaka, UNEP-NairobiRu
- Page 94 and 95: therefore reflect the three guiding
- Page 96 and 97:
is a seasonal dust storm. Anthropog
- Page 98 and 99:
Figure 7.3: Average Air Quality, Ja
- Page 100 and 101:
matter, hydrocarbons, and NO x (Nae
- Page 102 and 103:
Figure: 7.9: Vehicle Registered in
- Page 104 and 105:
Brick Kilnchlorofluorocarbons (HCFC
- Page 106 and 107:
Climate ChangeA region’s climate
- Page 108 and 109:
Figure 7.14: Mean Annual Precipitat
- Page 110 and 111:
Table 7.3: National Ambient Air Qua
- Page 112 and 113:
India. Available: http://www.cleana
- Page 114 and 115:
———.1999. “Ambient Air Qual
- Page 116 and 117:
Appendix 7.1: World Health Organiza
- Page 118 and 119:
Table 8.1: Criteria for Urban Statu
- Page 120 and 121:
accommodate the rapidly increasing
- Page 122 and 123:
managing solid waste. They are part
- Page 124 and 125:
In most municipalities, hazardous w
- Page 126 and 127:
in worsening public health conditio
- Page 128 and 129:
objects of archaeological, historic
- Page 130 and 131:
Min BajracharyaB. PradhanVehicles a
- Page 132 and 133:
Department of Health Services (DOHS
- Page 134 and 135:
Table 9.1 describes the major highl
- Page 136 and 137:
the period to up 2017. The document
- Page 138 and 139:
earthquakes; and awareness raising
- Page 140 and 141:
Sub-regional LinkagesOther developi
- Page 142 and 143:
Figure 9.1: The Key Environmental I
- Page 144 and 145:
(iv)(v)(vi)plants, and other non-ti
- Page 146 and 147:
environmental governance can be bet
- Page 148 and 149:
can vary considerably. Both sides h
- Page 150 and 151:
Dhungel, D.N., and A.B. Rajbhandari
- Page 152 and 153:
Table A9.1.2: Industry-Specific Tol
- Page 154 and 155:
. Cultural Heritage8. Convention fo
- Page 156 and 157:
Appendix 9.3: Some Prominent Enviro
- Page 158 and 159:
Some funding arrangements made by t
- Page 160 and 161:
(NARDF 2004) for a period of 1 to 3
- Page 162 and 163:
Table 10.2: Annual Income and Expen
- Page 164 and 165:
Table 10.4: Users’ Share in Benef
- Page 166 and 167:
From Hands Around Everest bookFrom
- Page 168 and 169:
Table 10.8: Subsidy Rate for Biogas
- Page 170 and 171:
microorganism communities and the n
- Page 172 and 173:
subsidies (Mason 1996). All these a
- Page 174 and 175:
addressed only part of the problem.
- Page 176 and 177:
historical practice of community-ma
- Page 178 and 179:
moved or relocated. The fact that s
- Page 180 and 181:
Kathmandu Valley and receives a lar
- Page 182 and 183:
cooperative ventures provided neith
- Page 184 and 185:
further poaching has not been repor
- Page 186 and 187:
http://www.pugwash.org/reports/pac/
- Page 188 and 189:
United Nations. 2003. World Populat
- Page 190 and 191:
how other countries with substantia
- Page 192 and 193:
(i) Broad-based and sustainable eco
- Page 194 and 195:
Although progress is encouraging, m
- Page 196 and 197:
Nepal’s Changing Pattern of Trade
- Page 198 and 199:
Table 12.2: Trade/ GDP RatiosFY1981
- Page 200 and 201:
Table 12.5: Percentage Share of Maj
- Page 202 and 203:
well as other provisions in specifi
- Page 204 and 205:
Future Implications for NepalIncrea
- Page 206 and 207:
International Trade Forum (ITN). 20
- Page 208 and 209:
- Gross domestic product per unit e
- Page 210 and 211:
Time Series InformationGenerally tw
- Page 212 and 213:
Table 13.1a: Different Datasets Col
- Page 214 and 215:
elevant due to its multidisciplinar
- Page 216 and 217:
Figure 13.6: Examples of Applicatio
- Page 218 and 219:
Judith DobmannThere are many source
- Page 220 and 221:
———.2003. Mapping Nepal Censu
- Page 222 and 223:
sustainable livelihoods requires an
- Page 224 and 225:
and haphazard. Population pressures
- Page 226 and 227:
issue. These deficiencies stem from
- Page 228 and 229:
population must be assessed. MOEST
- Page 230 and 231:
Appendix 14.1: List of Key Environm
- Page 232 and 233:
(vii) The EIA report approving agen
- Page 234 and 235:
Goal 1: Eradicate extreme poverty a
- Page 236 and 237:
Nepal’s Progress Towards the MDGs
- Page 238 and 239:
Goal 4: Reduce child mortalityReduc