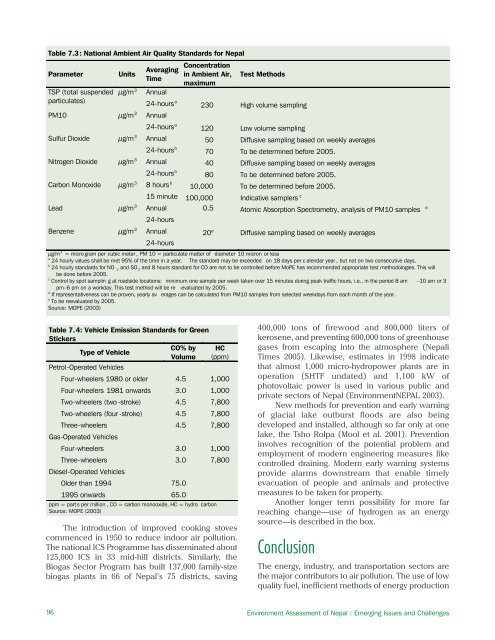
Table 7.3: National Ambient Air Quality Standards for NepalParameterTSP (total suspendedparticulates)UnitsAveragingTimeConcentrationin Ambient Air,maximumTest Methodsμg/m 3 Annual24-hours a 230 High volume samplingPM10 μg/m 3 Annual24-hours a 120 Low volume samplingSulfur Dioxide μg/m 3 Annual 50 Diffusive sampling based on weekly averages24-hours b 70 To be determined before 2005.Nitrogen Dioxide μg/m 3 Annual 40 Diffusive sampling based on weekly averages24-hours b 80 To be determined before 2005.Carbon Monoxide μg/m 3 8 hours b 10,000 To be determined before 2005.15 minute 100,000 Indicative samplers cAnnual 0.5 Atomic Absorption Spectrometry, analysis of PM10 samples dLead μg/m 3 24-hoursAnnual 20 e Diffusive sampling based on weekly averagesBenzene μg/m 3 24-hoursμg/m 3 = micro gram per cubic meter , PM 10 = particulate matter of diameter 10 micron or lessa 24 hourly values shall be met 95% of the time in a year. The standard may be exceeded on <strong>18</strong> days per c alendar year , but not on two consecutive days.b 24 hourly standards for NO 2and SO 2and 8 hours standard for CO are not to be controlled before MoPE has recommended appropriate test methodologies. This willbe done before 2005.c Control by spot samplin g at roadside locations: minimum one sample per week taken over 15 minutes during peak traffic hours, i.e., in the period 8 am –10 am or 3pm–6 pm on a workday. This test method will be re -evaluated by 2005.d If representativeness can be proven, yearly av erages can be calculated from PM10 samples from selected weekdays from each month of the year.e To be reevaluated by 2005.Source: MOPE (2003)Table 7.4: Vehicle Emission Standards for GreenStickersCO% by HCType of VehicleVolume (ppm)Petrol-Operated VehiclesFour-wheelers 1980 or older 4.5 1,000Four-wheelers 1981 onwards 3.0 1,000Two-wheelers (two -stroke) 4.5 7,800Two-wheelers (four -stroke) 4.5 7,800Three-wheelers 4.5 7,800Gas-Operated VehiclesFour-wheelers 3.0 1,000Three-wheelers 3.0 7,800Diesel-Operated VehiclesOlder than 1994 75.01995 onwards 65.0ppm = part s per million , CO = carbon monooxide, HC = hydro carbonSource: MOPE (2003)The introduction of improved cooking stovescommenced in 1950 to reduce indoor air pollution.The national ICS Programme has disseminated about125,000 ICS in 33 mid-hill districts. Similarly, theBiogas Sector Program has built 137,000 family-sizebiogas plants in 66 of Nepal’s 75 districts, saving400,000 tons of firewood and 800,000 liters ofkerosene, and preventing 600,000 tons of greenhousegases from escaping into the atmosphere (NepaliTimes 2005). Likewise, estimates in 1998 indicatethat almost 1,000 micro-hydropower plants are inoperation (SHTF undated) and 1,100 kW ofphotovoltaic power is used in various public andprivate sectors of Nepal (EnvironmentNEPAL 2003).New methods for prevention and early warningof glacial lake outburst floods are also beingdeveloped and installed, although so far only at onelake, the Tsho Rolpa (Mool et al. 2001). Preventioninvolves recognition of the potential problem andemployment of modern engineering measures likecontrolled draining. Modern early warning systemsprovide alarms downstream that enable timelyevacuation of people and animals and protectivemeasures to be taken for property.Another longer term possibility for more farreaching change—use of hydrogen as an energysource—is described in the box.ConclusionThe energy, industry, and transportation sectors arethe major contributors to air pollution. The use of lowquality fuel, inefficient methods of energy production96 Environment Assessment of Nepal : Emerging Issues and Challenges
Hydrogen Energy—A Brighter Option for NepalEnergy is a vital input to the national economy and wellbeing of people. Normally, economic growth requires more useof energy. Current patterns of energy use result in emissions of pollutants. Local-level pollutants such as carbonmonoxide, suspended particles, and hydrocarbons degrade air quality and damage health. Sulfur dioxides and nitrogenoxides are examples of regional level pollutants that contribute to acid deposition, which can damage vegetation such asforests and crops, and human-made structures. Large increases in emissions may occur during the next 20 to 50 years ifcurrent trends persist. Air pollution has become a priority issue in most countries in Asia.At present sustainable energy is of increasing interest in the region. The rapid growth of atmospheric environmentalissues along with the fear of energy shortages is creating a consensus about the potential benefits of hydrogen fromrenewable energy sources. These interesting perspectives are further supported by the development of key technologies,such as renewable energy sources, advanced production processes, and fuel cell vehicles. This provides an idealopportunity to introduce a hydrogen economy in Nepal. Nepal is one of the top five countries in the world in terms ofhydroelectric production potential. Nepal could provide the opportunity to introduce emission-free production of hydrogenenergy not only to the country but for the whole region. In addition, Nepal has the added advantage of cheap labor whichcan support the production of hydrogen at an affordable price. The economic and environmental benefits of hydrogenenergy could also help to reduce poverty by creating domestic jobs and providing electricity beyond the national power grid.Source: A project proposal by UNEP RRC.AP.and use, and poor condition of vehicles and trafficmanagement are among the reasons for increasingemissions in Nepal. Biomass burning for cooking andspace heating is a source of indoor air pollution andresultant health effects. Though long-term data onpollution are lacking, available information revealsthat the nature and extent of air pollution is serious inmajor urban areas and in the hill regions of Nepal.Air pollutants also contribute to the developingproblem of climate change, although it is notpossible to assess to what extent. At the same time,climate change will itself have an impact on thepattern and extent of air pollution.As Nepal imports petrol, it should start demandinglow benzene petrol. It should also emphasizezero-emission electric vehicles such as trolley bussesand Safa tempo. In the long term, Nepal should optfor hydrogen energy which will benefit the countryboth economically and environmentally. Though thecapital investment cost is higher at the beginning,this would be repaid in the long run.Raising awareness is another fundamentalmeasure to curb air pollution. This can be donethrough hands-on workshops, seminars, and sitevisits. However, the media should play a key role inthe overall strategy. Media coverage of key messagesthat need to be delivered to primary stakeholderswould reinforce the importance of those messages.At the same time, using the media ensures that thesemessages reach the general public as well, serving asinformation as well as reinforcing the importance ofthose messages.Along with awareness raising, capacity buildingis equally important. Scientific information remainsthe basis for any pollution-control efforts, andcapacity building of both institutions and individualsis vital. The contemporary view of capacity buildinggoes beyond the conventional perception of training.The central concerns of air quality management tomanage change, to resolve conflict, to manageinstitutional pluralism, to enhance coordination, tofoster communication, to develop a strong credibledatabase, and to ensure that data and informationare shared—require a broad and holistic view ofcapacity development, which is still poor in Nepaland needs to be strengthened.BibliographyAdhikari, A.P. 1998. Urban and Environmental Planning inNepal: Analysis, Polices and Proposals. Kathmandu:The World Conservation Union (IUCN).Adhikari, D.P. 1997. “Energy and EnvironmentalImplications of Alternative Transport Options: TheCase of Kathmandu, Nepal.” Unpublished M. Eng.Thesis, Asian Institute of Technology, Bangkok.Agrawala, S., V. Raksakulthai, M. Aalst, P. Larsen, J. Smith,and J. Reynolds. 2003. Development and ClimateChange In Nepal: Focus On Water Resources andHydropower. Paris: Organisation for Economic Cooperationand Development. Available:http://www.oecd.org/ dataoecd/6/51/19742202.pdfAnchorage Daily News. 2005. “Scientists Link WarmerWeather to Beetle Outbreak.” September 11.Available: http://www.fire.uni-freiburg.de/media/2005/news_20050912_us2.htmAsian Institute of Technology (AIT). undated. “Energy,Environment and Climate Change Issues: Nepal.” Astudy by the Asian Regional Research Programme inEnergy, Environment and Climate, Bangkok.Basnyat, P., R.N. Bhattarai, and S.K. Mishra. 2004. “Use ofEarth Air Tunnel HVAC System in Minimising IndoorAir Pollution.” Paper presented at the Workshop onBetter Air Quality (BAQ) 2004, 6–8 December, Agra,Chapter 7: Air Pollution and Climate Change97
- Page 2 and 3:
About the OrganisationsAsian Develo
- Page 4 and 5:
© 2006 International Centre for In
- Page 6 and 7:
AcknowledgementsWe would like to ex
- Page 8 and 9:
PM2.5PAHRSSAARCSACEPSEASO 2TSPUKUND
- Page 10 and 11:
Chapter 6: Energy Resources 65Intro
- Page 12 and 13:
List of FiguresFigure 2.1: People a
- Page 14 and 15:
Table 6.1: Energy Consumption and P
- Page 16 and 17:
forests are also used for infrastru
- Page 18 and 19:
as data gathered by different agenc
- Page 20 and 21:
Table 2.1: Population Growth Rates
- Page 22 and 23:
mortality rates for rural and urban
- Page 24 and 25:
Agglomeration village in the centra
- Page 26 and 27:
soil erosion, and depletion of wate
- Page 30 and 31:
provision remains inadequate becaus
- Page 32 and 33:
Malnutrition remains a serious obst
- Page 34 and 35:
Table 2.24: Existing and Projected
- Page 36 and 37:
Table 2.28: Income Poverty Indicato
- Page 38 and 39:
Table 2.31: Change in Employment St
- Page 40 and 41:
In 2004, the average annual househo
- Page 42 and 43:
Mountain areas have the most food i
- Page 44 and 45:
Schaffner, U. 1987. “Road Constru
- Page 46 and 47:
Table 3.1: Agricultural Economic De
- Page 48 and 49:
Table 3.4: Estimated Soil Erosion R
- Page 50 and 51:
B. PradhanImpacts of land degradati
- Page 52 and 53:
Carson, B. 1985. “Erosion and Sed
- Page 54 and 55:
The trend of forest coverage in the
- Page 56 and 57:
BiodiversityState of BiodiversityNe
- Page 58 and 59:
The Government has given legal prot
- Page 60 and 61: Different ways of maintaining biodi
- Page 62 and 63: ———.2004. State of the Enviro
- Page 64 and 65: Appendix 4.1: Table continuedMajor
- Page 66 and 67: Appendix 4.2: Protected Plant and W
- Page 68 and 69: Table A4.2.3: Nepal's Share in Plan
- Page 70 and 71: to intense weathering, and percolat
- Page 72 and 73: Table 5.5: Water Supply and Water T
- Page 74 and 75: Table 5.9: Water Quality of Shallow
- Page 76 and 77: species are reported to be endanger
- Page 78 and 79: Ministry of Water Resources (MOWR).
- Page 80 and 81: Definition, Forms, and UnitsEnergy
- Page 82 and 83: Table 6.5: Hydropower PotentialRive
- Page 84 and 85: Chilime Hydroelectric Project: An E
- Page 86 and 87: load occurs from 6 pm to 9 pm with
- Page 88 and 89: assessment of wind energy and lack
- Page 90 and 91: Review of Dams and Development by t
- Page 92 and 93: IUCNElizabeth Khaka, UNEP-NairobiRu
- Page 94 and 95: therefore reflect the three guiding
- Page 96 and 97: is a seasonal dust storm. Anthropog
- Page 98 and 99: Figure 7.3: Average Air Quality, Ja
- Page 100 and 101: matter, hydrocarbons, and NO x (Nae
- Page 102 and 103: Figure: 7.9: Vehicle Registered in
- Page 104 and 105: Brick Kilnchlorofluorocarbons (HCFC
- Page 106 and 107: Climate ChangeA region’s climate
- Page 108 and 109: Figure 7.14: Mean Annual Precipitat
- Page 112 and 113: India. Available: http://www.cleana
- Page 114 and 115: ———.1999. “Ambient Air Qual
- Page 116 and 117: Appendix 7.1: World Health Organiza
- Page 118 and 119: Table 8.1: Criteria for Urban Statu
- Page 120 and 121: accommodate the rapidly increasing
- Page 122 and 123: managing solid waste. They are part
- Page 124 and 125: In most municipalities, hazardous w
- Page 126 and 127: in worsening public health conditio
- Page 128 and 129: objects of archaeological, historic
- Page 130 and 131: Min BajracharyaB. PradhanVehicles a
- Page 132 and 133: Department of Health Services (DOHS
- Page 134 and 135: Table 9.1 describes the major highl
- Page 136 and 137: the period to up 2017. The document
- Page 138 and 139: earthquakes; and awareness raising
- Page 140 and 141: Sub-regional LinkagesOther developi
- Page 142 and 143: Figure 9.1: The Key Environmental I
- Page 144 and 145: (iv)(v)(vi)plants, and other non-ti
- Page 146 and 147: environmental governance can be bet
- Page 148 and 149: can vary considerably. Both sides h
- Page 150 and 151: Dhungel, D.N., and A.B. Rajbhandari
- Page 152 and 153: Table A9.1.2: Industry-Specific Tol
- Page 154 and 155: . Cultural Heritage8. Convention fo
- Page 156 and 157: Appendix 9.3: Some Prominent Enviro
- Page 158 and 159: Some funding arrangements made by t
- Page 160 and 161:
(NARDF 2004) for a period of 1 to 3
- Page 162 and 163:
Table 10.2: Annual Income and Expen
- Page 164 and 165:
Table 10.4: Users’ Share in Benef
- Page 166 and 167:
From Hands Around Everest bookFrom
- Page 168 and 169:
Table 10.8: Subsidy Rate for Biogas
- Page 170 and 171:
microorganism communities and the n
- Page 172 and 173:
subsidies (Mason 1996). All these a
- Page 174 and 175:
addressed only part of the problem.
- Page 176 and 177:
historical practice of community-ma
- Page 178 and 179:
moved or relocated. The fact that s
- Page 180 and 181:
Kathmandu Valley and receives a lar
- Page 182 and 183:
cooperative ventures provided neith
- Page 184 and 185:
further poaching has not been repor
- Page 186 and 187:
http://www.pugwash.org/reports/pac/
- Page 188 and 189:
United Nations. 2003. World Populat
- Page 190 and 191:
how other countries with substantia
- Page 192 and 193:
(i) Broad-based and sustainable eco
- Page 194 and 195:
Although progress is encouraging, m
- Page 196 and 197:
Nepal’s Changing Pattern of Trade
- Page 198 and 199:
Table 12.2: Trade/ GDP RatiosFY1981
- Page 200 and 201:
Table 12.5: Percentage Share of Maj
- Page 202 and 203:
well as other provisions in specifi
- Page 204 and 205:
Future Implications for NepalIncrea
- Page 206 and 207:
International Trade Forum (ITN). 20
- Page 208 and 209:
- Gross domestic product per unit e
- Page 210 and 211:
Time Series InformationGenerally tw
- Page 212 and 213:
Table 13.1a: Different Datasets Col
- Page 214 and 215:
elevant due to its multidisciplinar
- Page 216 and 217:
Figure 13.6: Examples of Applicatio
- Page 218 and 219:
Judith DobmannThere are many source
- Page 220 and 221:
———.2003. Mapping Nepal Censu
- Page 222 and 223:
sustainable livelihoods requires an
- Page 224 and 225:
and haphazard. Population pressures
- Page 226 and 227:
issue. These deficiencies stem from
- Page 228 and 229:
population must be assessed. MOEST
- Page 230 and 231:
Appendix 14.1: List of Key Environm
- Page 232 and 233:
(vii) The EIA report approving agen
- Page 234 and 235:
Goal 1: Eradicate extreme poverty a
- Page 236 and 237:
Nepal’s Progress Towards the MDGs
- Page 238 and 239:
Goal 4: Reduce child mortalityReduc