

ADB_book_18 April.qxp - Himalayan Document Centre - icimod
ADB_book_18 April.qxp - Himalayan Document Centre - icimod
ADB_book_18 April.qxp - Himalayan Document Centre - icimod
- No tags were found...

You also want an ePaper? Increase the reach of your titles
YUMPU automatically turns print PDFs into web optimized ePapers that Google loves.
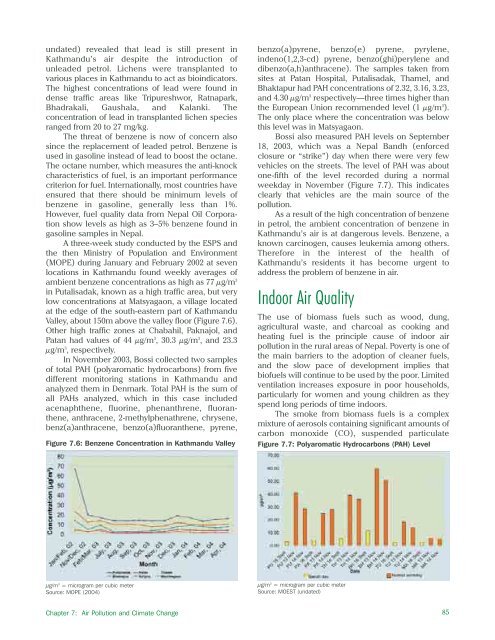
undated) revealed that lead is still present inKathmandu’s air despite the introduction ofunleaded petrol. Lichens were transplanted tovarious places in Kathmandu to act as bioindicators.The highest concentrations of lead were found indense traffic areas like Tripureshwor, Ratnapark,Bhadrakali, Gaushala, and Kalanki. Theconcentration of lead in transplanted lichen speciesranged from 20 to 27 mg/kg.The threat of benzene is now of concern alsosince the replacement of leaded petrol. Benzene isused in gasoline instead of lead to boost the octane.The octane number, which measures the anti-knockcharacteristics of fuel, is an important performancecriterion for fuel. Internationally, most countries haveensured that there should be minimum levels ofbenzene in gasoline, generally less than 1%.However, fuel quality data from Nepal Oil Corporationshow levels as high as 3–5% benzene found ingasoline samples in Nepal.A three-week study conducted by the ESPS andthe then Ministry of Population and Environment(MOPE) during January and February 2002 at sevenlocations in Kathmandu found weekly averages ofambient benzene concentrations as high as 77 μg/m 3in Putalisadak, known as a high traffic area, but verylow concentrations at Matsyagaon, a village locatedat the edge of the south-eastern part of KathmanduValley, about 150m above the valley floor (Figure 7.6).Other high traffic zones at Chabahil, Paknajol, andPatan had values of 44 μg/m 3 , 30.3 μg/m 3 , and 23.3μg/m 3 , respectively.In November 2003, Bossi collected two samplesof total PAH (polyaromatic hydrocarbons) from fivedifferent monitoring stations in Kathmandu andanalyzed them in Denmark. Total PAH is the sum ofall PAHs analyzed, which in this case includedacenaphthene, fluorine, phenanthrene, fluoranthene,anthracene, 2-methylphenathrene, chrysene,benz(a)anthracene, benzo(a)fluoranthene, pyrene,Figure 7.6: Benzene Concentration in Kathmandu Valleybenzo(a)pyrene, benzo(e) pyrene, pyrylene,indeno(1,2,3-cd) pyrene, benzo(ghi)perylene anddibenzo(a,h)anthracene). The samples taken fromsites at Patan Hospital, Putalisadak, Thamel, andBhaktapur had PAH concentrations of 2.32, 3.16, 3.23,and 4.30 μg/m 3 respectively—three times higher thanthe European Union recommended level (1 μg/m 3 ).The only place where the concentration was belowthis level was in Matsyagaon.Bossi also measured PAH levels on September<strong>18</strong>, 2003, which was a Nepal Bandh (enforcedclosure or “strike”) day when there were very fewvehicles on the streets. The level of PAH was aboutone-fifth of the level recorded during a normalweekday in November (Figure 7.7). This indicatesclearly that vehicles are the main source of thepollution.As a result of the high concentration of benzenein petrol, the ambient concentration of benzene inKathmandu’s air is at dangerous levels. Benzene, aknown carcinogen, causes leukemia among others.Therefore in the interest of the health ofKathmandu’s residents it has become urgent toaddress the problem of benzene in air.Indoor Air QualityThe use of biomass fuels such as wood, dung,agricultural waste, and charcoal as cooking andheating fuel is the principle cause of indoor airpollution in the rural areas of Nepal. Poverty is one ofthe main barriers to the adoption of cleaner fuels,and the slow pace of development implies thatbiofuels will continue to be used by the poor. Limitedventilation increases exposure in poor households,particularly for women and young children as theyspend long periods of time indoors.The smoke from biomass fuels is a complexmixture of aerosols containing significant amounts ofcarbon monoxide (CO), suspended particulateFigure 7.7: Polyaromatic Hydrocarbons (PAH) Levelμg/m 3 = microgram per cubic meterSource: MOPE (2004)μg/m 3 = microgram per cubic meterSource: MOEST (undated)Chapter 7: Air Pollution and Climate Change85


