

ADB_book_18 April.qxp - Himalayan Document Centre - icimod
ADB_book_18 April.qxp - Himalayan Document Centre - icimod
ADB_book_18 April.qxp - Himalayan Document Centre - icimod
- No tags were found...

Create successful ePaper yourself
Turn your PDF publications into a flip-book with our unique Google optimized e-Paper software.
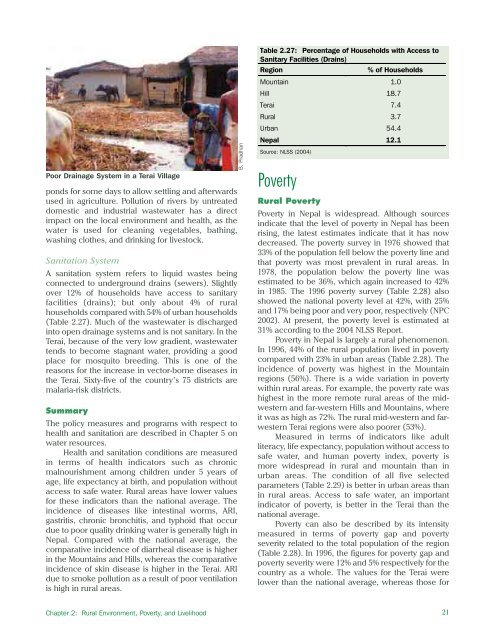
Poor Drainage System in a Terai Villageponds for some days to allow settling and afterwardsused in agriculture. Pollution of rivers by untreateddomestic and industrial wastewater has a directimpact on the local environment and health, as thewater is used for cleaning vegetables, bathing,washing clothes, and drinking for livestock.Sanitation SystemA sanitation system refers to liquid wastes beingconnected to underground drains (sewers). Slightlyover 12% of households have access to sanitaryfacilities (drains); but only about 4% of ruralhouseholds compared with 54% of urban households(Table 2.27). Much of the wastewater is dischargedinto open drainage systems and is not sanitary. In theTerai, because of the very low gradient, wastewatertends to become stagnant water, providing a goodplace for mosquito breeding. This is one of thereasons for the increase in vector-borne diseases inthe Terai. Sixty-five of the country’s 75 districts aremalaria-risk districts.SummaryThe policy measures and programs with respect tohealth and sanitation are described in Chapter 5 onwater resources.Health and sanitation conditions are measuredin terms of health indicators such as chronicmalnourishment among children under 5 years ofage, life expectancy at birth, and population withoutaccess to safe water. Rural areas have lower valuesfor these indicators than the national average. Theincidence of diseases like intestinal worms, ARI,gastritis, chronic bronchitis, and typhoid that occurdue to poor quality drinking water is generally high inNepal. Compared with the national average, thecomparative incidence of diarrheal disease is higherin the Mountains and Hills, whereas the comparativeincidence of skin disease is higher in the Terai. ARIdue to smoke pollution as a result of poor ventilationis high in rural areas.B. PradhanTable 2.27: Percentage of Households with Access toSanitary Facilities (Drains)RegionPoverty% of HouseholdsMountain 1.0Hill <strong>18</strong>.7Terai 7.4Rural 3.7Urban 54.4Nepal 12.1Source: NLSS (2004)Rural PovertyPoverty in Nepal is widespread. Although sourcesindicate that the level of poverty in Nepal has beenrising, the latest estimates indicate that it has nowdecreased. The poverty survey in 1976 showed that33% of the population fell below the poverty line andthat poverty was most prevalent in rural areas. In1978, the population below the poverty line wasestimated to be 36%, which again increased to 42%in 1985. The 1996 poverty survey (Table 2.28) alsoshowed the national poverty level at 42%, with 25%and 17% being poor and very poor, respectively (NPC2002). At present, the poverty level is estimated at31% according to the 2004 NLSS Report.Poverty in Nepal is largely a rural phenomenon.In 1996, 44% of the rural population lived in povertycompared with 23% in urban areas (Table 2.28). Theincidence of poverty was highest in the Mountainregions (56%). There is a wide variation in povertywithin rural areas. For example, the poverty rate washighest in the more remote rural areas of the midwesternand far-western Hills and Mountains, whereit was as high as 72%. The rural mid-western and farwesternTerai regions were also poorer (53%).Measured in terms of indicators like adultliteracy, life expectancy, population without access tosafe water, and human poverty index, poverty ismore widespread in rural and mountain than inurban areas. The condition of all five selectedparameters (Table 2.29) is better in urban areas thanin rural areas. Access to safe water, an importantindicator of poverty, is better in the Terai than thenational average.Poverty can also be described by its intensitymeasured in terms of poverty gap and povertyseverity related to the total population of the region(Table 2.28). In 1996, the figures for poverty gap andpoverty severity were 12% and 5% respectively for thecountry as a whole. The values for the Terai werelower than the national average, whereas those forChapter 2: Rural Environment, Poverty, and Livelihood21


