mortality rates for rural and urban areas are 79 and 50per thousand live births, respectively. The datashown in Table 2.5 indicate some of the humandevelopment measures and basic facilities in ruraland urban areas. Selected measures of humandevelopment—including gross domestic product(GDP) per capita, human development index,education index, life expectancy index, genderrelated indices and human poverty index—show thatthe performance of rural areas is much poorer thanthat of urban areas. Similarly, there are markeddifferences regarding basic facilities such as pipeddrinking water, sanitation, electricity, fuel used, andmass media exposure. In most cases, the facilities forhouseholds in rural areas are fewer than in urbanareas. The Nepal Living Standards Survey (NLSS)2004 (NLSS 2004) indicates that a majority ofhouseholds consider their access to public servicessuch as health, education, drinking water, electricity,road, post office and telephone as “fair”, whereas“bad” ratings range from 15% (education and postoffice) to 44% (road).The population of Nepal includes diverse ethnicgroups and castes, languages, religions, and culturaltraditions. In the Hill and Terai regions, Janjatispopulations (ethnic groups) account for 36.5% of thetotal population and Hindu castes for nearly 59%.Unlike urban areas, the population of rural localitiesin all regions is characterized by more or lesshomogenous ethnicity and caste. However, thepopulation of the emerging rural towns and marketcenters is more diverse.MigrationMovement of people from one place to another foreconomic, social, cultural, and other reasons has along tradition in Nepal. Migration of hill populationsincreased after the 1950s following the control ofendemic malaria in the Terai region and the warmriver valleys.Table 2.5: Performance of Rural and Urban Areas Regarding Basic Facilities and Development , 2001Demographic FeaturesHuman DevelopmentMeasuresDescription Rural UrbanTotal fertility rate (women age d 15–49) 4.4 2.1Current use of contraception (any method) 46.8 66.0Childhood mortality (per 1,000 live births)Infant 79.3 50.1Child 35.4 16.7Under five 111.9 65.9GDP per capita (PPP) $ (2000) 1,094 2,133Human development index (2000) 0.446 0.616Education index (2000) 0.276 0.568Life expectancy index (2000) 0.562 0.769Gender related development index (2000) 0.426 0.605Gender empowerment measure 0.333 0.443Human poverty index (2000) 41.4 23.9Basic FacilitiesMalnourishment among children under 5 years (%) 56.3 36.1Piped drinking water (% households) 33.0 55.2Sanitation facilities (% households)Flush toilet 6.1 58.3Pit toilet 17.1 14.6No facility 75.3 20.1Other 1.5 7.0Electricity connection (% households) 17.4 85.7Fuel used (% households)Firewood 94.1 39.1Kerosene 2.3 35.8Other 3.6 25.1Exposure to mass media, newspaper, radio and TV (% hh) 10.3 40.6hh = households, GDP = gross domestic product, PPP = purchasing power p arity, TV = televisionSource: CBS (2003) p. 409.8 Environment Assessment of Nepal : Emerging Issues and Challenges
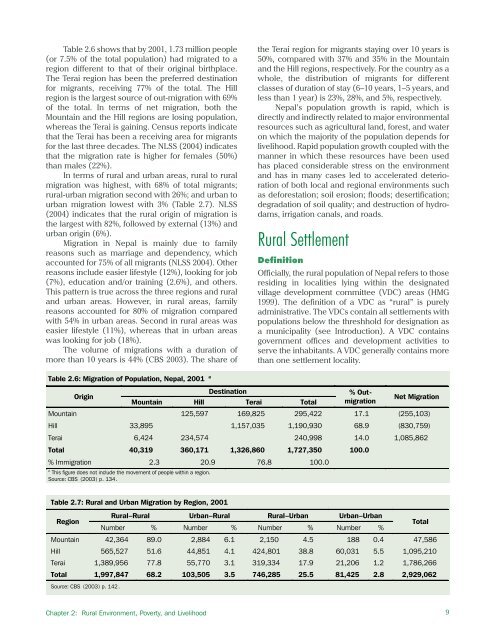
Table 2.6 shows that by 2001, 1.73 million people(or 7.5% of the total population) had migrated to aregion different to that of their original birthplace.The Terai region has been the preferred destinationfor migrants, receiving 77% of the total. The Hillregion is the largest source of out-migration with 69%of the total. In terms of net migration, both theMountain and the Hill regions are losing population,whereas the Terai is gaining. Census reports indicatethat the Terai has been a receiving area for migrantsfor the last three decades. The NLSS (2004) indicatesthat the migration rate is higher for females (50%)than males (22%).In terms of rural and urban areas, rural to ruralmigration was highest, with 68% of total migrants;rural-urban migration second with 26%; and urban tourban migration lowest with 3% (Table 2.7). NLSS(2004) indicates that the rural origin of migration isthe largest with 82%, followed by external (13%) andurban origin (6%).Migration in Nepal is mainly due to familyreasons such as marriage and dependency, whichaccounted for 75% of all migrants (NLSS 2004). Otherreasons include easier lifestyle (12%), looking for job(7%), education and/or training (2.6%), and others.This pattern is true across the three regions and ruraland urban areas. However, in rural areas, familyreasons accounted for 80% of migration comparedwith 54% in urban areas. Second in rural areas waseasier lifestyle (11%), whereas that in urban areaswas looking for job (<strong>18</strong>%).The volume of migrations with a duration ofmore than 10 years is 44% (CBS 2003). The share ofthe Terai region for migrants staying over 10 years is50%, compared with 37% and 35% in the Mountainand the Hill regions, respectively. For the country as awhole, the distribution of migrants for differentclasses of duration of stay (6–10 years, 1–5 years, andless than 1 year) is 23%, 28%, and 5%, respectively.Nepal’s population growth is rapid, which isdirectly and indirectly related to major environmentalresources such as agricultural land, forest, and wateron which the majority of the population depends forlivelihood. Rapid population growth coupled with themanner in which these resources have been usedhas placed considerable stress on the environmentand has in many cases led to accelerated deteriorationof both local and regional environments suchas deforestation; soil erosion; floods; desertification;degradation of soil quality; and destruction of hydrodams,irrigation canals, and roads.Rural SettlementDefinitionOfficially, the rural population of Nepal refers to thoseresiding in localities lying within the designatedvillage development committee (VDC) areas (HMG1999). The definition of a VDC as “rural” is purelyadministrative. The VDCs contain all settlements withpopulations below the threshhold for designation asa municipality (see Introduction). A VDC containsgovernment offices and development activities toserve the inhabitants. A VDC generally contains morethan one settlement locality.Table 2.6: Migration of Population, Nepal, 2001 a DestinationOriginMountain Hill Terai Total% OutmigrationNet MigrationMountain 125,597 169,825 295,422 17.1 (255,103)Hill 33,895 1,157,035 1,190,930 68.9 (830,759)Terai 6,424 234,574 240,998 14.0 1,085,862Total 40,319 360,171 1,326,860 1,727,350 100.0% Immigration 2.3 20.9 76.8 100.0a This figure does not include the movement of people within a region.Source: CBS (2003) p. 134.Table 2.7: Rural and Urban Migration by Region, 2001RegionRural–Rural Urban–Rural Rural–Urban Urban–UrbanNumber % Number % Number % Number %TotalMountain 42,364 89.0 2,884 6.1 2,150 4.5 <strong>18</strong>8 0.4 47,586Hill 565,527 51.6 44,851 4.1 424,801 38.8 60,031 5.5 1,095,210Terai 1,389,956 77.8 55,770 3.1 319,334 17.9 21,206 1.2 1,786,266Total 1,997,847 68.2 103,505 3.5 746,285 25.5 81,425 2.8 2,929,062Source: CBS (2003) p. 142.Chapter 2: Rural Environment, Poverty, and Livelihood9
- Page 2 and 3: About the OrganisationsAsian Develo
- Page 4 and 5: © 2006 International Centre for In
- Page 6 and 7: AcknowledgementsWe would like to ex
- Page 8 and 9: PM2.5PAHRSSAARCSACEPSEASO 2TSPUKUND
- Page 10 and 11: Chapter 6: Energy Resources 65Intro
- Page 12 and 13: List of FiguresFigure 2.1: People a
- Page 14 and 15: Table 6.1: Energy Consumption and P
- Page 16 and 17: forests are also used for infrastru
- Page 18 and 19: as data gathered by different agenc
- Page 20 and 21: Table 2.1: Population Growth Rates
- Page 24 and 25: Agglomeration village in the centra
- Page 26 and 27: soil erosion, and depletion of wate
- Page 30 and 31: provision remains inadequate becaus
- Page 32 and 33: Malnutrition remains a serious obst
- Page 34 and 35: Table 2.24: Existing and Projected
- Page 36 and 37: Table 2.28: Income Poverty Indicato
- Page 38 and 39: Table 2.31: Change in Employment St
- Page 40 and 41: In 2004, the average annual househo
- Page 42 and 43: Mountain areas have the most food i
- Page 44 and 45: Schaffner, U. 1987. “Road Constru
- Page 46 and 47: Table 3.1: Agricultural Economic De
- Page 48 and 49: Table 3.4: Estimated Soil Erosion R
- Page 50 and 51: B. PradhanImpacts of land degradati
- Page 52 and 53: Carson, B. 1985. “Erosion and Sed
- Page 54 and 55: The trend of forest coverage in the
- Page 56 and 57: BiodiversityState of BiodiversityNe
- Page 58 and 59: The Government has given legal prot
- Page 60 and 61: Different ways of maintaining biodi
- Page 62 and 63: ———.2004. State of the Enviro
- Page 64 and 65: Appendix 4.1: Table continuedMajor
- Page 66 and 67: Appendix 4.2: Protected Plant and W
- Page 68 and 69: Table A4.2.3: Nepal's Share in Plan
- Page 70 and 71: to intense weathering, and percolat
- Page 72 and 73:
Table 5.5: Water Supply and Water T
- Page 74 and 75:
Table 5.9: Water Quality of Shallow
- Page 76 and 77:
species are reported to be endanger
- Page 78 and 79:
Ministry of Water Resources (MOWR).
- Page 80 and 81:
Definition, Forms, and UnitsEnergy
- Page 82 and 83:
Table 6.5: Hydropower PotentialRive
- Page 84 and 85:
Chilime Hydroelectric Project: An E
- Page 86 and 87:
load occurs from 6 pm to 9 pm with
- Page 88 and 89:
assessment of wind energy and lack
- Page 90 and 91:
Review of Dams and Development by t
- Page 92 and 93:
IUCNElizabeth Khaka, UNEP-NairobiRu
- Page 94 and 95:
therefore reflect the three guiding
- Page 96 and 97:
is a seasonal dust storm. Anthropog
- Page 98 and 99:
Figure 7.3: Average Air Quality, Ja
- Page 100 and 101:
matter, hydrocarbons, and NO x (Nae
- Page 102 and 103:
Figure: 7.9: Vehicle Registered in
- Page 104 and 105:
Brick Kilnchlorofluorocarbons (HCFC
- Page 106 and 107:
Climate ChangeA region’s climate
- Page 108 and 109:
Figure 7.14: Mean Annual Precipitat
- Page 110 and 111:
Table 7.3: National Ambient Air Qua
- Page 112 and 113:
India. Available: http://www.cleana
- Page 114 and 115:
———.1999. “Ambient Air Qual
- Page 116 and 117:
Appendix 7.1: World Health Organiza
- Page 118 and 119:
Table 8.1: Criteria for Urban Statu
- Page 120 and 121:
accommodate the rapidly increasing
- Page 122 and 123:
managing solid waste. They are part
- Page 124 and 125:
In most municipalities, hazardous w
- Page 126 and 127:
in worsening public health conditio
- Page 128 and 129:
objects of archaeological, historic
- Page 130 and 131:
Min BajracharyaB. PradhanVehicles a
- Page 132 and 133:
Department of Health Services (DOHS
- Page 134 and 135:
Table 9.1 describes the major highl
- Page 136 and 137:
the period to up 2017. The document
- Page 138 and 139:
earthquakes; and awareness raising
- Page 140 and 141:
Sub-regional LinkagesOther developi
- Page 142 and 143:
Figure 9.1: The Key Environmental I
- Page 144 and 145:
(iv)(v)(vi)plants, and other non-ti
- Page 146 and 147:
environmental governance can be bet
- Page 148 and 149:
can vary considerably. Both sides h
- Page 150 and 151:
Dhungel, D.N., and A.B. Rajbhandari
- Page 152 and 153:
Table A9.1.2: Industry-Specific Tol
- Page 154 and 155:
. Cultural Heritage8. Convention fo
- Page 156 and 157:
Appendix 9.3: Some Prominent Enviro
- Page 158 and 159:
Some funding arrangements made by t
- Page 160 and 161:
(NARDF 2004) for a period of 1 to 3
- Page 162 and 163:
Table 10.2: Annual Income and Expen
- Page 164 and 165:
Table 10.4: Users’ Share in Benef
- Page 166 and 167:
From Hands Around Everest bookFrom
- Page 168 and 169:
Table 10.8: Subsidy Rate for Biogas
- Page 170 and 171:
microorganism communities and the n
- Page 172 and 173:
subsidies (Mason 1996). All these a
- Page 174 and 175:
addressed only part of the problem.
- Page 176 and 177:
historical practice of community-ma
- Page 178 and 179:
moved or relocated. The fact that s
- Page 180 and 181:
Kathmandu Valley and receives a lar
- Page 182 and 183:
cooperative ventures provided neith
- Page 184 and 185:
further poaching has not been repor
- Page 186 and 187:
http://www.pugwash.org/reports/pac/
- Page 188 and 189:
United Nations. 2003. World Populat
- Page 190 and 191:
how other countries with substantia
- Page 192 and 193:
(i) Broad-based and sustainable eco
- Page 194 and 195:
Although progress is encouraging, m
- Page 196 and 197:
Nepal’s Changing Pattern of Trade
- Page 198 and 199:
Table 12.2: Trade/ GDP RatiosFY1981
- Page 200 and 201:
Table 12.5: Percentage Share of Maj
- Page 202 and 203:
well as other provisions in specifi
- Page 204 and 205:
Future Implications for NepalIncrea
- Page 206 and 207:
International Trade Forum (ITN). 20
- Page 208 and 209:
- Gross domestic product per unit e
- Page 210 and 211:
Time Series InformationGenerally tw
- Page 212 and 213:
Table 13.1a: Different Datasets Col
- Page 214 and 215:
elevant due to its multidisciplinar
- Page 216 and 217:
Figure 13.6: Examples of Applicatio
- Page 218 and 219:
Judith DobmannThere are many source
- Page 220 and 221:
———.2003. Mapping Nepal Censu
- Page 222 and 223:
sustainable livelihoods requires an
- Page 224 and 225:
and haphazard. Population pressures
- Page 226 and 227:
issue. These deficiencies stem from
- Page 228 and 229:
population must be assessed. MOEST
- Page 230 and 231:
Appendix 14.1: List of Key Environm
- Page 232 and 233:
(vii) The EIA report approving agen
- Page 234 and 235:
Goal 1: Eradicate extreme poverty a
- Page 236 and 237:
Nepal’s Progress Towards the MDGs
- Page 238 and 239:
Goal 4: Reduce child mortalityReduc