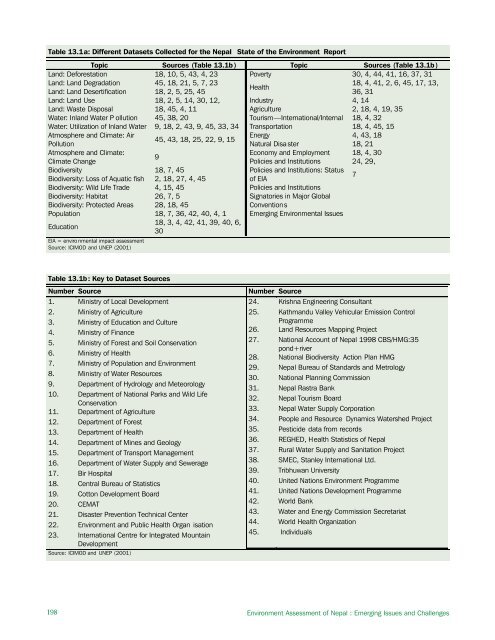
Table 13.1a: Different Datasets Collected for the Nepal State of the Environment ReportTopic Sources (Table 13.1b )Land: Deforestation <strong>18</strong>, 10, 5, 43, 4, 23Land: Land Degradation 45, <strong>18</strong>, 21, 5, 7, 23Land: Land Desertification <strong>18</strong>, 2, 5, 25, 45Land: Land Use <strong>18</strong>, 2, 5, 14, 30, 12,Land: Waste Disposal <strong>18</strong>, 45, 4, 11Water: Inland Water P ollution 45, 38, 20Water: Utilization of Inland Water 9, <strong>18</strong>, 2, 43, 9, 45, 33, 34Atmosphere and Climate: AirPollution45, 43, <strong>18</strong>, 25, 22, 9, 15Atmosphere and Climate:Climate Change9Biodiversity <strong>18</strong>, 7, 45Biodiversity: Loss of Aquatic fish 2, <strong>18</strong>, 27, 4, 45Biodiversity: Wild Life Trade 4, 15, 45Biodiversity: Habitat 26, 7, 5Biodiversity: Protected Areas 28, <strong>18</strong>, 45Population <strong>18</strong>, 7, 36, 42, 40, 4, 1Education<strong>18</strong>, 3, 4, 42, 41, 39, 40, 6,30EIA = enviro nmental impact assessmentSource: ICIMOD and UNEP (2001)Topic Sources (Table 13.1b )Poverty 30, 4, 44, 41, 16, 37, 31Health<strong>18</strong>, 4, 41, 2, 6, 45, 17, 13,36, 31Industry 4, 14Agriculture 2, <strong>18</strong>, 4, 19, 35Tourism—International/Internal <strong>18</strong>, 4, 32Transportation <strong>18</strong>, 4, 45, 15Energy 4, 43, <strong>18</strong>Natural Disa ster <strong>18</strong>, 21Economy and Employment <strong>18</strong>, 4, 30Policies and Institutions 24, 29,Policies and Institutions: Statusof EIA7Policies and InstitutionsSignatories in Major GlobalConventionsEmerging Environmental IssuesTable 13.1b: Key to Dataset SourcesNumber Source1. Ministry of Local Development2. Ministry of Agriculture3. Ministry of Education and Culture4. Ministry of Finance5. Ministry of Forest and Soil Conservation6. Ministry of Health7. Ministry of Population and Environment8. Ministry of Water Resources9. Department of Hydrology and Meteorology10. Department of National Parks and Wild LifeConservation11. Department of Agriculture12. Department of Forest13. Department of Health14. Department of Mines and Geology15. Department of Transport Management16. Department of Water Supply and Sewerage17. Bir Hospital<strong>18</strong>. Central Bureau of Statistics19. Cotton Development Board20. CEMAT21. Disaster Prevention Technical Center22. Environment and Public Health Organ isation23. International <strong>Centre</strong> for Integrated MountainDevelopmentSource: ICIMOD and UNEP (2001)Number Source24. Krishna Engineering Consultant25. Kathmandu Valley Vehicular Emission ControlProgramme26. Land Resources Mapping Project27. National Account of Nepal 1998 CBS/HMG:35pond+river28. National Biodiversity Action Plan HMG29. Nepal Bureau of Standards and Metrology30. National Planning Commission31. Nepal Rastra Bank32. Nepal Tourism Board33. Nepal Water Supply Corporation34. People and Resource Dynamics Watershed Project35. Pesticide data from records36. REGHED, Health Statistics of Nepal37. Rural Water Supply and Sanitation Project38. SMEC, Stanley International Ltd.39. Tribhuwan University40. United Nations Environment Programme41. United Nations Development Programme42. World Bank43. Water and Ene rgy Commission Secretariat44. World Health Organization45. Individuals198 Environment Assessment of Nepal : Emerging Issues and Challenges
ment. The data are collected regularly from districtand regional forestry offices through observation, totalcounting, and measurement, and the disaggregation isdistrict, regional, and ecological. The forest resourcesinventory is based on standardized statisticalmethods, and sample errors, standard errors, andvariation coefficients are computed. An AsianDevelopment Bank (<strong>ADB</strong>) technical assistance report(<strong>ADB</strong> 2004) recommends that MOFSC strengthen itscapability in coordinating the production of importantstatistics on forestry and the environment to be able tofill the current data gaps.The CBS and the Department of Health Servicesof the Ministry of Health are the two major sources ofhealth and environment related statistics. TheDepartment of Health Services has an integratedhealth management information system that aims toencourage bottom-up planning from communitylevel to national level. About 400 indicators arecollected every month and about 100 derived fromdifferent reports. The indicators monitored concernchild health, reproductive health (safe motherhoodand family planning), and disease control. Despitemany social surveys being conducted, <strong>ADB</strong> (2004)points out considerable data gaps as well as thenecessity to allocate responsibilities for generatingsuch data to avoid duplication of functions.In addition, a number of other organizationsincluding research institutes, universities, NGOs, andindividual researchers collect data and information intheir areas of specialization as indicated in Table 13.1.Existing Environmental InformationCollecting, compiling, and harmonizing informationfrom different sources are often difficult tasks.Furthermore, collecting environmental data fromsecondary sources or descriptive data has proven tobe a daunting task in Nepal. The past study on theState of the Environment Nepal and the present studyare good examples and share the same experience.Except for data found in reports, reliable data arevery difficult to obtain and many institutions lack theproper data handling capability. The problemsinclude the fact that sources of environmental dataand information are generally diverse andincoherent; the marked unwillingness on the part ofmost of the institutions and individuals to share dataand information; and a lack of the datastandardization and consistency that would makethem usable under a common platform—often thereare simply no data available.Circulation of environmental information shouldbe stimulated at the national level. Issues emanatingfrom the present institutional context need to beaddressed to improve the environmental data andinformation available in Nepal.Integration and Analysis ofEnvironmental InformationThe information required for environmentalassessment and monitoring covers a wide spectrum.There is an increasing need for better integration ofenvironmental concerns into decisions that canaffect the environment in major economic andhuman activities such as energy, industry, transport,agriculture, and tourism. Information on the naturalresources base and environment is essential.Information on human activities impacting theenvironment, emission of pollutants, natural events,and human responses to environmental changes isequally important for assessing the ecosystem as awhole.Careful integration of environmental data intosocial and economic dimensions is increasinglyrecognized as vital for scientific understanding andsocietal decision making (Maclaren et al. 1994). Thishas a number of implications for the collection,management, and use of information, including thenecessity of synthesizing and presenting scientificand technical information in readable, usable form,and of displaying the links between environmentaland socioeconomic issues. Such integration can befostered by proper institutional mechanisms as wellas by using modern analytical tools and decisionsupportsystems, which will support betterunderstanding of environmental trends andconditions and help develop and implement policies,plans, and actions. The following section describesthe use of such modern scientific tools.Geographic Information Systems (GIS)Environmental problems have distinct spatial andtemporal dimensions. From an operationalstandpoint, data must be referenced geographically.Decisions related to the environment, protection ofbiodiversity, environmental damage due to naturalhazards, urban growth, and so on need informationthrough space and time. Due to the very highvariability in topography and ecologicalcharacteristics, Nepal poses challenges in compilingand analyzing such information.Advanced information communicationtechnology, GIS, and space technology represent anew generation of tools for scientific analysis.Myriads of these tools are converging and are nowavailable to quantify, model, document, anddisseminate information on key environmental andnatural resources conditions and trends. Theinformation thus generated is readily understood bypolicymakers and the public. GIS technology isChapter 13: Environmental Information, Analysis, and Integration199
- Page 2 and 3:
About the OrganisationsAsian Develo
- Page 4 and 5:
© 2006 International Centre for In
- Page 6 and 7:
AcknowledgementsWe would like to ex
- Page 8 and 9:
PM2.5PAHRSSAARCSACEPSEASO 2TSPUKUND
- Page 10 and 11:
Chapter 6: Energy Resources 65Intro
- Page 12 and 13:
List of FiguresFigure 2.1: People a
- Page 14 and 15:
Table 6.1: Energy Consumption and P
- Page 16 and 17:
forests are also used for infrastru
- Page 18 and 19:
as data gathered by different agenc
- Page 20 and 21:
Table 2.1: Population Growth Rates
- Page 22 and 23:
mortality rates for rural and urban
- Page 24 and 25:
Agglomeration village in the centra
- Page 26 and 27:
soil erosion, and depletion of wate
- Page 30 and 31:
provision remains inadequate becaus
- Page 32 and 33:
Malnutrition remains a serious obst
- Page 34 and 35:
Table 2.24: Existing and Projected
- Page 36 and 37:
Table 2.28: Income Poverty Indicato
- Page 38 and 39:
Table 2.31: Change in Employment St
- Page 40 and 41:
In 2004, the average annual househo
- Page 42 and 43:
Mountain areas have the most food i
- Page 44 and 45:
Schaffner, U. 1987. “Road Constru
- Page 46 and 47:
Table 3.1: Agricultural Economic De
- Page 48 and 49:
Table 3.4: Estimated Soil Erosion R
- Page 50 and 51:
B. PradhanImpacts of land degradati
- Page 52 and 53:
Carson, B. 1985. “Erosion and Sed
- Page 54 and 55:
The trend of forest coverage in the
- Page 56 and 57:
BiodiversityState of BiodiversityNe
- Page 58 and 59:
The Government has given legal prot
- Page 60 and 61:
Different ways of maintaining biodi
- Page 62 and 63:
———.2004. State of the Enviro
- Page 64 and 65:
Appendix 4.1: Table continuedMajor
- Page 66 and 67:
Appendix 4.2: Protected Plant and W
- Page 68 and 69:
Table A4.2.3: Nepal's Share in Plan
- Page 70 and 71:
to intense weathering, and percolat
- Page 72 and 73:
Table 5.5: Water Supply and Water T
- Page 74 and 75:
Table 5.9: Water Quality of Shallow
- Page 76 and 77:
species are reported to be endanger
- Page 78 and 79:
Ministry of Water Resources (MOWR).
- Page 80 and 81:
Definition, Forms, and UnitsEnergy
- Page 82 and 83:
Table 6.5: Hydropower PotentialRive
- Page 84 and 85:
Chilime Hydroelectric Project: An E
- Page 86 and 87:
load occurs from 6 pm to 9 pm with
- Page 88 and 89:
assessment of wind energy and lack
- Page 90 and 91:
Review of Dams and Development by t
- Page 92 and 93:
IUCNElizabeth Khaka, UNEP-NairobiRu
- Page 94 and 95:
therefore reflect the three guiding
- Page 96 and 97:
is a seasonal dust storm. Anthropog
- Page 98 and 99:
Figure 7.3: Average Air Quality, Ja
- Page 100 and 101:
matter, hydrocarbons, and NO x (Nae
- Page 102 and 103:
Figure: 7.9: Vehicle Registered in
- Page 104 and 105:
Brick Kilnchlorofluorocarbons (HCFC
- Page 106 and 107:
Climate ChangeA region’s climate
- Page 108 and 109:
Figure 7.14: Mean Annual Precipitat
- Page 110 and 111:
Table 7.3: National Ambient Air Qua
- Page 112 and 113:
India. Available: http://www.cleana
- Page 114 and 115:
———.1999. “Ambient Air Qual
- Page 116 and 117:
Appendix 7.1: World Health Organiza
- Page 118 and 119:
Table 8.1: Criteria for Urban Statu
- Page 120 and 121:
accommodate the rapidly increasing
- Page 122 and 123:
managing solid waste. They are part
- Page 124 and 125:
In most municipalities, hazardous w
- Page 126 and 127:
in worsening public health conditio
- Page 128 and 129:
objects of archaeological, historic
- Page 130 and 131:
Min BajracharyaB. PradhanVehicles a
- Page 132 and 133:
Department of Health Services (DOHS
- Page 134 and 135:
Table 9.1 describes the major highl
- Page 136 and 137:
the period to up 2017. The document
- Page 138 and 139:
earthquakes; and awareness raising
- Page 140 and 141:
Sub-regional LinkagesOther developi
- Page 142 and 143:
Figure 9.1: The Key Environmental I
- Page 144 and 145:
(iv)(v)(vi)plants, and other non-ti
- Page 146 and 147:
environmental governance can be bet
- Page 148 and 149:
can vary considerably. Both sides h
- Page 150 and 151:
Dhungel, D.N., and A.B. Rajbhandari
- Page 152 and 153:
Table A9.1.2: Industry-Specific Tol
- Page 154 and 155:
. Cultural Heritage8. Convention fo
- Page 156 and 157:
Appendix 9.3: Some Prominent Enviro
- Page 158 and 159:
Some funding arrangements made by t
- Page 160 and 161:
(NARDF 2004) for a period of 1 to 3
- Page 162 and 163: Table 10.2: Annual Income and Expen
- Page 164 and 165: Table 10.4: Users’ Share in Benef
- Page 166 and 167: From Hands Around Everest bookFrom
- Page 168 and 169: Table 10.8: Subsidy Rate for Biogas
- Page 170 and 171: microorganism communities and the n
- Page 172 and 173: subsidies (Mason 1996). All these a
- Page 174 and 175: addressed only part of the problem.
- Page 176 and 177: historical practice of community-ma
- Page 178 and 179: moved or relocated. The fact that s
- Page 180 and 181: Kathmandu Valley and receives a lar
- Page 182 and 183: cooperative ventures provided neith
- Page 184 and 185: further poaching has not been repor
- Page 186 and 187: http://www.pugwash.org/reports/pac/
- Page 188 and 189: United Nations. 2003. World Populat
- Page 190 and 191: how other countries with substantia
- Page 192 and 193: (i) Broad-based and sustainable eco
- Page 194 and 195: Although progress is encouraging, m
- Page 196 and 197: Nepal’s Changing Pattern of Trade
- Page 198 and 199: Table 12.2: Trade/ GDP RatiosFY1981
- Page 200 and 201: Table 12.5: Percentage Share of Maj
- Page 202 and 203: well as other provisions in specifi
- Page 204 and 205: Future Implications for NepalIncrea
- Page 206 and 207: International Trade Forum (ITN). 20
- Page 208 and 209: - Gross domestic product per unit e
- Page 210 and 211: Time Series InformationGenerally tw
- Page 214 and 215: elevant due to its multidisciplinar
- Page 216 and 217: Figure 13.6: Examples of Applicatio
- Page 218 and 219: Judith DobmannThere are many source
- Page 220 and 221: ———.2003. Mapping Nepal Censu
- Page 222 and 223: sustainable livelihoods requires an
- Page 224 and 225: and haphazard. Population pressures
- Page 226 and 227: issue. These deficiencies stem from
- Page 228 and 229: population must be assessed. MOEST
- Page 230 and 231: Appendix 14.1: List of Key Environm
- Page 232 and 233: (vii) The EIA report approving agen
- Page 234 and 235: Goal 1: Eradicate extreme poverty a
- Page 236 and 237: Nepal’s Progress Towards the MDGs
- Page 238 and 239: Goal 4: Reduce child mortalityReduc