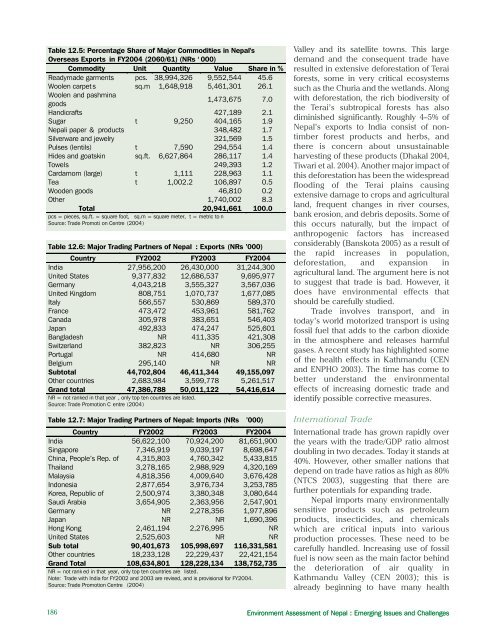
Table 12.5: Percentage Share of Major Commodities in Nepal'sOverseas Exports in FY2004 (2060/61) (NRs ‘ 000)Commodity Unit Quantity Value Share in %Readymade garments pcs. 38,994,326 9,552,544 45.6Woolen carpet s sq.m 1,648,9<strong>18</strong> 5,461,301 26.1Woolen and pashminagoods1,473,675 7.0Handicrafts 427,<strong>18</strong>9 2.1Sugar t 9,250 404,165 1.9Nepali paper & products 348,482 1.7Silverware and jewelry 321,569 1.5Pulses (lentils) t 7,590 294,554 1.4Hides and goatskin sq.ft. 6,627,864 286,117 1.4Towels 249,393 1.2Cardamom (large) t 1,111 228,963 1.1Tea t 1,002.2 106,897 0.5Wooden goods 46,810 0.2Other 1,740,002 8.3Total 20,941,661 100.0pcs = pieces, sq.ft. = square foot, sq.m = square meter, t = metric to nSource: Trade Promoti on <strong>Centre</strong> (2004)Table 12.6: Major Trading Partners of Nepal : Exports (NRs ’000)Country FY2002 FY2003 FY2004India 27,956,200 26,430,000 31,244,300United States 9,377,832 12,686,537 9,695,977Germany 4,043,2<strong>18</strong> 3,555,327 3,567,036United Kingdom 808,751 1,070,737 1,677,085Italy 566,557 530,869 589,370France 473,472 453,961 581,762Canada 305,978 383,651 546,403Japan 492,833 474,247 525,601Bangladesh NR 411,335 421,308Switzerland 382,823 NR 306,255Portugal NR 414,680 NRBelgium 295,140 NR NRSubtotal 44,702,804 46,411,344 49,155,097Other countries 2,683,984 3,599,778 5,261,517Grand total 47,386,788 50,011,122 54,416,614NR = not ranked in that year , only top ten countries are listed.Source: Trade Promotion C entre (2004)Table 12.7: Major Trading Partners of Nepal: Imports (NRs ’000)Country FY2002 FY2003 FY2004India 56,622,100 70,924,200 81,651,900Singapore 7,346,919 9,039,197 8,698,647China, People’s Rep. of 4,315,803 4,760,342 5,433,815Thailand 3,278,165 2,988,929 4,320,169Malaysia 4,8<strong>18</strong>,356 4,009,640 3,676,428Indonesia 2,877,654 3,976,734 3,253,785Korea, Republic of 2,500,974 3,380,348 3,080,644Saudi Arabia 3,654,905 2,363,956 2,547,901Germany NR 2,278,356 1,977,896Japan NR NR 1,690,396Hong Kong 2,461,194 2,276,995 NRUnited States 2,525,603 NR NRSub total 90,401,673 105,998,697 116,331,581Other countries <strong>18</strong>,233,128 22,229,437 22,421,154Grand Total 108,634,801 128,228,134 138,752,735NR = not rank ed in that year, only top ten countries are listed.Note: Trade with India for FY2002 and 2003 are revised, and is provisional for FY2004.Source: Trade Promotion <strong>Centre</strong> (2004)Valley and its satellite towns. This largedemand and the consequent trade haveresulted in extensive deforestation of Teraiforests, some in very critical ecosystemssuch as the Churia and the wetlands. Alongwith deforestation, the rich biodiversity ofthe Terai’s subtropical forests has alsodiminished significantly. Roughly 4–5% ofNepal’s exports to India consist of nontimberforest products and herbs, andthere is concern about unsustainableharvesting of these products (Dhakal 2004,Tiwari et al. 2004). Another major impact ofthis deforestation has been the widespreadflooding of the Terai plains causingextensive damage to crops and agriculturalland, frequent changes in river courses,bank erosion, and debris deposits. Some ofthis occurs naturally, but the impact ofanthropogenic factors has increasedconsiderably (Banskota 2005) as a result ofthe rapid increases in population,deforestation, and expansion inagricultural land. The argument here is notto suggest that trade is bad. However, itdoes have environmental effects thatshould be carefully studied.Trade involves transport, and intoday’s world motorized transport is usingfossil fuel that adds to the carbon dioxidein the atmosphere and releases harmfulgases. A recent study has highlighted someof the health effects in Kathmandu (CENand ENPHO 2003). The time has come tobetter understand the environmentaleffects of increasing domestic trade andidentify possible corrective measures.International TradeInternational trade has grown rapidly overthe years with the trade/GDP ratio almostdoubling in two decades. Today it stands at40%. However, other smaller nations thatdepend on trade have ratios as high as 80%(NTCS 2003), suggesting that there arefurther potentials for expanding trade.Nepal imports many environmentallysensitive products such as petroleumproducts, insecticides, and chemicalswhich are critical inputs into variousproduction processes. These need to becarefully handled. Increasing use of fossilfuel is now seen as the main factor behindthe deterioration of air quality inKathmandu Valley (CEN 2003); this isalready beginning to have many health<strong>18</strong>6 Environment Assessment of Nepal : Emerging Issues and Challenges
effects. Kathmandu Valley has a specialenvironmental problem of temperature inversion,due to which air pollutants do not disperse veryeasily (Tuladhar 2003). Unleaded petrol wasintroduced in the country only recently, and there isconcern about adulteration in the fuels available. Ifimproving the quality of fossil fuel to minimize thepresence of harmful substances is one aspect, thereis also a need for the carriers to be environmentallyfriendly. Many of the vehicles are in a very poor state,and these are responsible for a lot of the pollution.Another major problem is related to imports ofpesticides and toxic and harmful substances. Theirproper handling, use, storage, and transport arerelatively unknown at present. Some studies on theuse of pesticides have shown that few precautionshave been taken, and that pesticides could becomea public health hazard at any time (Pokharel 2003).While developed countries are introducing stringentregulations on many harmful and toxic chemicals,there is little monitoring of what is happening inNepal. Nepal’s weak monitoring and policingcapacity could make it an attractive candidate fordumping harmful and chemical substances, whosetoxicity may only become known after they are in thecountry. This is an important area and needs to begiven serious attention in light of the long and highlyporous open border with India.What about environmentally sensitive exports?So far Nepal has been fortunate because no majorexport consignment has been rejected onenvironmental grounds. Environmental standards inthe European Union (EU) and the US have becomehighly stringent and some aspects of this arediscussed in the next section. Discussions withdifferent experts 1 , have identified several current andlikely problems regarding exports to the EU:(i) Exports of woolen carpets to Germany wererequired (voluntarily) to have ecolabels.(ii) India imposed quarantine restrictions onginger exports from Nepal, and exports werefrequently stranded at the border because ofthe delay by India on pest risk analysis. Nepalcould not provide the necessary data to Indiain time for the analysis. Now the quarantineproblem on ginger has been solved.(iii) Italy recently returned a shipment ofChywanprash because of the presence oftoxic substances.(iv) Some concerns have been expressed aboutpesticides and other prohibited residues intea samples from Nepal.(v) Nepal honey is not in the open list of the EUbecause of an insufficient residuemonitoring plan and lack of legislation inNepal to control the quality of honey. Further,the considerable production by indigenoushoneybees is not recognized as “honey”under EU directives.There may be other cases, but very little of thisknowledge is in the public domain. Although the listis small so far, the lists of prohibited items in the USand the EU are very large, and care must be taken toensure that farmers and producers from Nepal arewell aware of these requirements. So far Nepal’sexports have been limited and therefore theproblems are also small. Some positivedevelopments in this respect have been the award ofOeko-Tex 100 ecolabel certificates to five Nepaliexporters to EU countries. There have also beenefforts to promote cleaner production measures inindustrial units, some of which are exporters(Adhikari 2004). Similarly the practice of organicfarming and integrated pest management is alsobeing encouraged. While these are positive signs,boosting Nepal’s future exports will require majorefforts to ensure that these are safe for theenvironment and humans, and meet the emergingstandards in different parts of the world.Trade and Environment-relatedExperience of Other CountriesKirchbach (ITN 2001) highlights a number ofinteresting points regarding trade-relatedenvironmental barriers. He points out that of 4,917products examined in world trade, only 24% did notface some kind of environment-related trade barrierin 2001. While the number of products is large, theirvalue as a percentage of total trade is only 13%. Eitherexporters are focusing their attention on restriction offree markets or these are mostly low-value productsof agricultural, forest, or mineral origin. About 90% ofthe barriers are concentrated in 44 products. Themost common ones are food items, plants, bulbs andcut flowers, boneless bovine cuts, large automobiles,trucks, smaller automobiles, motor vehicle parts,coniferous timber, natural gas, footwear, medicine,telephones, and wildlife products. Apart from straightbans on imports, these barriers can take manyforms—surcharges, internal taxes, advance paymentrequirements, transfer delays, quality control, priorauthorization, quotas, obligations to return usedproducts, and so on. Exports from less developedcountries have been subjected most frequently toenvironment-related trade barriers.What are the reasons for these barriers? Basedon a review of the provisions in the WTO rules, as1Dr. Krishna P. Pant, Senior Economist, Ministry of Agriculture and Cooperatives; Dr. Deb B. Shakya, Agro Enterprise Center, Federation of Nepalese Chambers ofCommerce and Industry (FNCCI); Mr. Ratnakar Adhikari, Executive Director, South Asia Watch on Trade, Economics and Environment (SAWTEE)Chapter 12: Environment and Trade<strong>18</strong>7
- Page 2 and 3:
About the OrganisationsAsian Develo
- Page 4 and 5:
© 2006 International Centre for In
- Page 6 and 7:
AcknowledgementsWe would like to ex
- Page 8 and 9:
PM2.5PAHRSSAARCSACEPSEASO 2TSPUKUND
- Page 10 and 11:
Chapter 6: Energy Resources 65Intro
- Page 12 and 13:
List of FiguresFigure 2.1: People a
- Page 14 and 15:
Table 6.1: Energy Consumption and P
- Page 16 and 17:
forests are also used for infrastru
- Page 18 and 19:
as data gathered by different agenc
- Page 20 and 21:
Table 2.1: Population Growth Rates
- Page 22 and 23:
mortality rates for rural and urban
- Page 24 and 25:
Agglomeration village in the centra
- Page 26 and 27:
soil erosion, and depletion of wate
- Page 30 and 31:
provision remains inadequate becaus
- Page 32 and 33:
Malnutrition remains a serious obst
- Page 34 and 35:
Table 2.24: Existing and Projected
- Page 36 and 37:
Table 2.28: Income Poverty Indicato
- Page 38 and 39:
Table 2.31: Change in Employment St
- Page 40 and 41:
In 2004, the average annual househo
- Page 42 and 43:
Mountain areas have the most food i
- Page 44 and 45:
Schaffner, U. 1987. “Road Constru
- Page 46 and 47:
Table 3.1: Agricultural Economic De
- Page 48 and 49:
Table 3.4: Estimated Soil Erosion R
- Page 50 and 51:
B. PradhanImpacts of land degradati
- Page 52 and 53:
Carson, B. 1985. “Erosion and Sed
- Page 54 and 55:
The trend of forest coverage in the
- Page 56 and 57:
BiodiversityState of BiodiversityNe
- Page 58 and 59:
The Government has given legal prot
- Page 60 and 61:
Different ways of maintaining biodi
- Page 62 and 63:
———.2004. State of the Enviro
- Page 64 and 65:
Appendix 4.1: Table continuedMajor
- Page 66 and 67:
Appendix 4.2: Protected Plant and W
- Page 68 and 69:
Table A4.2.3: Nepal's Share in Plan
- Page 70 and 71:
to intense weathering, and percolat
- Page 72 and 73:
Table 5.5: Water Supply and Water T
- Page 74 and 75:
Table 5.9: Water Quality of Shallow
- Page 76 and 77:
species are reported to be endanger
- Page 78 and 79:
Ministry of Water Resources (MOWR).
- Page 80 and 81:
Definition, Forms, and UnitsEnergy
- Page 82 and 83:
Table 6.5: Hydropower PotentialRive
- Page 84 and 85:
Chilime Hydroelectric Project: An E
- Page 86 and 87:
load occurs from 6 pm to 9 pm with
- Page 88 and 89:
assessment of wind energy and lack
- Page 90 and 91:
Review of Dams and Development by t
- Page 92 and 93:
IUCNElizabeth Khaka, UNEP-NairobiRu
- Page 94 and 95:
therefore reflect the three guiding
- Page 96 and 97:
is a seasonal dust storm. Anthropog
- Page 98 and 99:
Figure 7.3: Average Air Quality, Ja
- Page 100 and 101:
matter, hydrocarbons, and NO x (Nae
- Page 102 and 103:
Figure: 7.9: Vehicle Registered in
- Page 104 and 105:
Brick Kilnchlorofluorocarbons (HCFC
- Page 106 and 107:
Climate ChangeA region’s climate
- Page 108 and 109:
Figure 7.14: Mean Annual Precipitat
- Page 110 and 111:
Table 7.3: National Ambient Air Qua
- Page 112 and 113:
India. Available: http://www.cleana
- Page 114 and 115:
———.1999. “Ambient Air Qual
- Page 116 and 117:
Appendix 7.1: World Health Organiza
- Page 118 and 119:
Table 8.1: Criteria for Urban Statu
- Page 120 and 121:
accommodate the rapidly increasing
- Page 122 and 123:
managing solid waste. They are part
- Page 124 and 125:
In most municipalities, hazardous w
- Page 126 and 127:
in worsening public health conditio
- Page 128 and 129:
objects of archaeological, historic
- Page 130 and 131:
Min BajracharyaB. PradhanVehicles a
- Page 132 and 133:
Department of Health Services (DOHS
- Page 134 and 135:
Table 9.1 describes the major highl
- Page 136 and 137:
the period to up 2017. The document
- Page 138 and 139:
earthquakes; and awareness raising
- Page 140 and 141:
Sub-regional LinkagesOther developi
- Page 142 and 143:
Figure 9.1: The Key Environmental I
- Page 144 and 145:
(iv)(v)(vi)plants, and other non-ti
- Page 146 and 147:
environmental governance can be bet
- Page 148 and 149:
can vary considerably. Both sides h
- Page 150 and 151: Dhungel, D.N., and A.B. Rajbhandari
- Page 152 and 153: Table A9.1.2: Industry-Specific Tol
- Page 154 and 155: . Cultural Heritage8. Convention fo
- Page 156 and 157: Appendix 9.3: Some Prominent Enviro
- Page 158 and 159: Some funding arrangements made by t
- Page 160 and 161: (NARDF 2004) for a period of 1 to 3
- Page 162 and 163: Table 10.2: Annual Income and Expen
- Page 164 and 165: Table 10.4: Users’ Share in Benef
- Page 166 and 167: From Hands Around Everest bookFrom
- Page 168 and 169: Table 10.8: Subsidy Rate for Biogas
- Page 170 and 171: microorganism communities and the n
- Page 172 and 173: subsidies (Mason 1996). All these a
- Page 174 and 175: addressed only part of the problem.
- Page 176 and 177: historical practice of community-ma
- Page 178 and 179: moved or relocated. The fact that s
- Page 180 and 181: Kathmandu Valley and receives a lar
- Page 182 and 183: cooperative ventures provided neith
- Page 184 and 185: further poaching has not been repor
- Page 186 and 187: http://www.pugwash.org/reports/pac/
- Page 188 and 189: United Nations. 2003. World Populat
- Page 190 and 191: how other countries with substantia
- Page 192 and 193: (i) Broad-based and sustainable eco
- Page 194 and 195: Although progress is encouraging, m
- Page 196 and 197: Nepal’s Changing Pattern of Trade
- Page 198 and 199: Table 12.2: Trade/ GDP RatiosFY1981
- Page 202 and 203: well as other provisions in specifi
- Page 204 and 205: Future Implications for NepalIncrea
- Page 206 and 207: International Trade Forum (ITN). 20
- Page 208 and 209: - Gross domestic product per unit e
- Page 210 and 211: Time Series InformationGenerally tw
- Page 212 and 213: Table 13.1a: Different Datasets Col
- Page 214 and 215: elevant due to its multidisciplinar
- Page 216 and 217: Figure 13.6: Examples of Applicatio
- Page 218 and 219: Judith DobmannThere are many source
- Page 220 and 221: ———.2003. Mapping Nepal Censu
- Page 222 and 223: sustainable livelihoods requires an
- Page 224 and 225: and haphazard. Population pressures
- Page 226 and 227: issue. These deficiencies stem from
- Page 228 and 229: population must be assessed. MOEST
- Page 230 and 231: Appendix 14.1: List of Key Environm
- Page 232 and 233: (vii) The EIA report approving agen
- Page 234 and 235: Goal 1: Eradicate extreme poverty a
- Page 236 and 237: Nepal’s Progress Towards the MDGs
- Page 238 and 239: Goal 4: Reduce child mortalityReduc