accommodate the rapidly increasing populationpressure (newspaper articles, personal communicationand observation, and Joshi 2000).Only Kathmandu has reached a population of500,000 inhabitants or more, and at present only fiveurban areas—Biratnagar, Birganj, Kathmandu,Lalitpur, and Pokhara—have populations exceeding100,000. Except for Kathmandu, all have populationsless than 175,000. Nepal’s population size and urbanbasedeconomy are small and would not beconducive to larger cities. Migration is likely to begreatest to those urban areas where land for housingis comparatively cheap, where there areemployment and livelihood opportunities, andwhere there are reasonable urban facilities such aseducation, health, and communications. This logic,and the past trend, suggests that urban areas withcurrent populations in the range of 50,000 to 100,000are likely to be the preferred destinations formigration. The trend in the last three decades alsosupports this argument: between 1971 and 2001,population in urban areas of 50,000 to 99,000 grewfrom 13% to 24% of the total urban population,whereas the percentage declined among all othersizes. The typical population of Nepalese towns inthe next decade or so is likely to be 100,000 to200,000. Most of Nepal’s urban centers are unlikely tohave populations exceeding 300,000 in the next 10 to15 years.Most urban areas are not very denselypopulated in terms of persons per unit area (Table8.2). The urban areas of Kathmandu Valley are themost densely populated in Nepal. Urban densities insome of the municipalities, particularly in theHill/Mountain region, are only slightly higher than thatof rural areas. For example, the density of Triyuga andAmargadi municipalities is 172.8 and 132.5 personsper square kilometer, respectively, which iscomparable with the rural density (Sharma 2003).Population densities may be higher in smaller oremerging towns that are not yet classified as urbanareas. Several municipalities exhibit a more ruralthan urban character because of expansion ofboundaries of the existing towns in the process ofgaining municipal status to include population on thefringes that was hitherto classified as rural. Somemunicipalities are not even linked with the rest of thecountry by road, and the outskirts of manymunicipalities can be reached only by a walk of 3–4hours.Emerging ProblemsMost urban areas of Nepal have cultural and heritagesites of varied nature including historical settlements,monuments, religious sites (temples, monasteries,and others) and ponds and public taps. These are oflocal, national, and international significance; someare listed as World Heritage Sites by the UnitedNations Educational, Scientific and CulturalOrganization (UNESCO) (including the Pashupatinathtemple, Boudhanath, Swayambhunath, palaceareas of Hanuman Dhoka, Patan, and Bhaktapur,Changu Narayan temple, and Lumbini). However,according to IUCN (1999) “the physical state of thecultural and heritage sites and the monuments inKathmandu Valley is fast deteriorating”. The culturaland heritage sites along rivers are the worst affected.Emergence of urban slums and squattersettlements in Nepal’s cities is relatively new and stillsmall in size compared with other cities in SouthAsia. There are no adequate data on slum dwellers inNepal nor is there a definition of “slums”. However,the number of squatter settlements in major urbanareas has been increasing in the last few years; it ismost conspicuous in Kathmandu Valley. In 1985 thenumber of squatter settlements in the Valley was 17with an estimated 3,000 inhabitants; this grew to 33with an estimated population of 15,000 in 1990(Pradhan 2004); and to 44 in 2002 (Baniya 2002).Pathibhara is the largest recorded squattersettlement with <strong>18</strong>7 households and 2000 familymembers. All these squatter localities and some ofthe core areas of Kathmandu are said to be slumsdue to lack of basic sanitation and utility facilities.The emergence and expansion of the squattersettlements has been encroaching upon riverbanks,public lands, lands belonging to temples or otherreligious/cultural sites, agricultural land, and forestareas.Urban InfrastructureRoads and TrafficIn 2000, the total road length in the urban areas ofNepal was 2,051 km, of which blacktopped, graveled,and earthen road lengths were 930 km, 600 km, and521 km, respectively (CBS 2002). There isconsiderable variation in the length and status ofurban roads in municipalities depending on their sizeand location. For example, Waling has only 8 km ofroad within its territory whereas Kathmandu has 800km (SWMRMC 2004). Some municipalities arecompletely devoid of blacktopped roads, and someare not even linked with the national road network.Urban traffic in Nepal is typically a mix of traffictypes including automobiles, cycle rickshaws(manual three-wheeler), bicycles, and even animaldrawncarts. The numbers and composition of trafficvary from municipality to municipality. Rickshawsand bicycles are most conspicuous in the Teraitowns, whereas cars and motorcycles make up over106 Environment Assessment of Nepal : Emerging Issues and Challenges
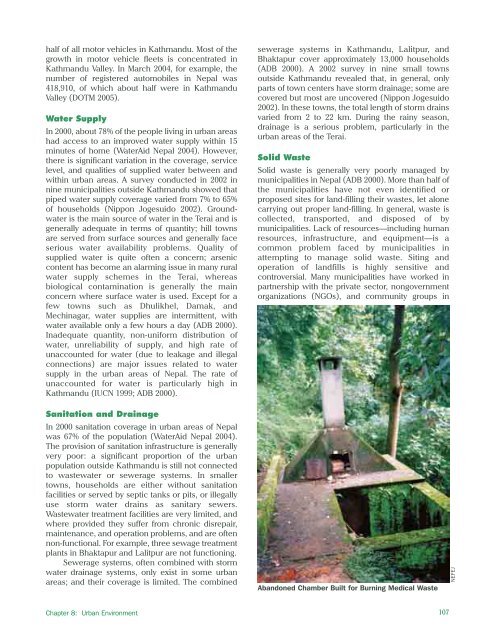
half of all motor vehicles in Kathmandu. Most of thegrowth in motor vehicle fleets is concentrated inKathmandu Valley. In March 2004, for example, thenumber of registered automobiles in Nepal was4<strong>18</strong>,910, of which about half were in KathmanduValley (DOTM 2005).Water SupplyIn 2000, about 78% of the people living in urban areashad access to an improved water supply within 15minutes of home (WaterAid Nepal 2004). However,there is significant variation in the coverage, servicelevel, and qualities of supplied water between andwithin urban areas. A survey conducted in 2002 innine municipalities outside Kathmandu showed thatpiped water supply coverage varied from 7% to 65%of households (Nippon Jogesuido 2002). Groundwateris the main source of water in the Terai and isgenerally adequate in terms of quantity; hill townsare served from surface sources and generally faceserious water availability problems. Quality ofsupplied water is quite often a concern; arseniccontent has become an alarming issue in many ruralwater supply schemes in the Terai, whereasbiological contamination is generally the mainconcern where surface water is used. Except for afew towns such as Dhulikhel, Damak, andMechinagar, water supplies are intermittent, withwater available only a few hours a day (<strong>ADB</strong> 2000).Inadequate quantity, non-uniform distribution ofwater, unreliability of supply, and high rate ofunaccounted for water (due to leakage and illegalconnections) are major issues related to watersupply in the urban areas of Nepal. The rate ofunaccounted for water is particularly high inKathmandu (IUCN 1999; <strong>ADB</strong> 2000).sewerage systems in Kathmandu, Lalitpur, andBhaktapur cover approximately 13,000 households(<strong>ADB</strong> 2000). A 2002 survey in nine small townsoutside Kathmandu revealed that, in general, onlyparts of town centers have storm drainage; some arecovered but most are uncovered (Nippon Jogesuido2002). In these towns, the total length of storm drainsvaried from 2 to 22 km. During the rainy season,drainage is a serious problem, particularly in theurban areas of the Terai.Solid WasteSolid waste is generally very poorly managed bymunicipalities in Nepal (<strong>ADB</strong> 2000). More than half ofthe municipalities have not even identified orproposed sites for land-filling their wastes, let alonecarrying out proper land-filling. In general, waste iscollected, transported, and disposed of bymunicipalities. Lack of resources—including humanresources, infrastructure, and equipment—is acommon problem faced by municipalities inattempting to manage solid waste. Siting andoperation of landfills is highly sensitive andcontroversial. Many municipalities have worked inpartnership with the private sector, nongovernmentorganizations (NGOs), and community groups inSanitation and DrainageIn 2000 sanitation coverage in urban areas of Nepalwas 67% of the population (WaterAid Nepal 2004).The provision of sanitation infrastructure is generallyvery poor: a significant proportion of the urbanpopulation outside Kathmandu is still not connectedto wastewater or sewerage systems. In smallertowns, households are either without sanitationfacilities or served by septic tanks or pits, or illegallyuse storm water drains as sanitary sewers.Wastewater treatment facilities are very limited, andwhere provided they suffer from chronic disrepair,maintenance, and operation problems, and are oftennon-functional. For example, three sewage treatmentplants in Bhaktapur and Lalitpur are not functioning.Sewerage systems, often combined with stormwater drainage systems, only exist in some urbanareas; and their coverage is limited. The combinedAbandoned Chamber Built for Burning Medical WasteNEFEJChapter 8: Urban Environment107
- Page 2 and 3:
About the OrganisationsAsian Develo
- Page 4 and 5:
© 2006 International Centre for In
- Page 6 and 7:
AcknowledgementsWe would like to ex
- Page 8 and 9:
PM2.5PAHRSSAARCSACEPSEASO 2TSPUKUND
- Page 10 and 11:
Chapter 6: Energy Resources 65Intro
- Page 12 and 13:
List of FiguresFigure 2.1: People a
- Page 14 and 15:
Table 6.1: Energy Consumption and P
- Page 16 and 17:
forests are also used for infrastru
- Page 18 and 19:
as data gathered by different agenc
- Page 20 and 21:
Table 2.1: Population Growth Rates
- Page 22 and 23:
mortality rates for rural and urban
- Page 24 and 25:
Agglomeration village in the centra
- Page 26 and 27:
soil erosion, and depletion of wate
- Page 30 and 31:
provision remains inadequate becaus
- Page 32 and 33:
Malnutrition remains a serious obst
- Page 34 and 35:
Table 2.24: Existing and Projected
- Page 36 and 37:
Table 2.28: Income Poverty Indicato
- Page 38 and 39:
Table 2.31: Change in Employment St
- Page 40 and 41:
In 2004, the average annual househo
- Page 42 and 43:
Mountain areas have the most food i
- Page 44 and 45:
Schaffner, U. 1987. “Road Constru
- Page 46 and 47:
Table 3.1: Agricultural Economic De
- Page 48 and 49:
Table 3.4: Estimated Soil Erosion R
- Page 50 and 51:
B. PradhanImpacts of land degradati
- Page 52 and 53:
Carson, B. 1985. “Erosion and Sed
- Page 54 and 55:
The trend of forest coverage in the
- Page 56 and 57:
BiodiversityState of BiodiversityNe
- Page 58 and 59:
The Government has given legal prot
- Page 60 and 61:
Different ways of maintaining biodi
- Page 62 and 63:
———.2004. State of the Enviro
- Page 64 and 65:
Appendix 4.1: Table continuedMajor
- Page 66 and 67:
Appendix 4.2: Protected Plant and W
- Page 68 and 69:
Table A4.2.3: Nepal's Share in Plan
- Page 70 and 71: to intense weathering, and percolat
- Page 72 and 73: Table 5.5: Water Supply and Water T
- Page 74 and 75: Table 5.9: Water Quality of Shallow
- Page 76 and 77: species are reported to be endanger
- Page 78 and 79: Ministry of Water Resources (MOWR).
- Page 80 and 81: Definition, Forms, and UnitsEnergy
- Page 82 and 83: Table 6.5: Hydropower PotentialRive
- Page 84 and 85: Chilime Hydroelectric Project: An E
- Page 86 and 87: load occurs from 6 pm to 9 pm with
- Page 88 and 89: assessment of wind energy and lack
- Page 90 and 91: Review of Dams and Development by t
- Page 92 and 93: IUCNElizabeth Khaka, UNEP-NairobiRu
- Page 94 and 95: therefore reflect the three guiding
- Page 96 and 97: is a seasonal dust storm. Anthropog
- Page 98 and 99: Figure 7.3: Average Air Quality, Ja
- Page 100 and 101: matter, hydrocarbons, and NO x (Nae
- Page 102 and 103: Figure: 7.9: Vehicle Registered in
- Page 104 and 105: Brick Kilnchlorofluorocarbons (HCFC
- Page 106 and 107: Climate ChangeA region’s climate
- Page 108 and 109: Figure 7.14: Mean Annual Precipitat
- Page 110 and 111: Table 7.3: National Ambient Air Qua
- Page 112 and 113: India. Available: http://www.cleana
- Page 114 and 115: ———.1999. “Ambient Air Qual
- Page 116 and 117: Appendix 7.1: World Health Organiza
- Page 118 and 119: Table 8.1: Criteria for Urban Statu
- Page 122 and 123: managing solid waste. They are part
- Page 124 and 125: In most municipalities, hazardous w
- Page 126 and 127: in worsening public health conditio
- Page 128 and 129: objects of archaeological, historic
- Page 130 and 131: Min BajracharyaB. PradhanVehicles a
- Page 132 and 133: Department of Health Services (DOHS
- Page 134 and 135: Table 9.1 describes the major highl
- Page 136 and 137: the period to up 2017. The document
- Page 138 and 139: earthquakes; and awareness raising
- Page 140 and 141: Sub-regional LinkagesOther developi
- Page 142 and 143: Figure 9.1: The Key Environmental I
- Page 144 and 145: (iv)(v)(vi)plants, and other non-ti
- Page 146 and 147: environmental governance can be bet
- Page 148 and 149: can vary considerably. Both sides h
- Page 150 and 151: Dhungel, D.N., and A.B. Rajbhandari
- Page 152 and 153: Table A9.1.2: Industry-Specific Tol
- Page 154 and 155: . Cultural Heritage8. Convention fo
- Page 156 and 157: Appendix 9.3: Some Prominent Enviro
- Page 158 and 159: Some funding arrangements made by t
- Page 160 and 161: (NARDF 2004) for a period of 1 to 3
- Page 162 and 163: Table 10.2: Annual Income and Expen
- Page 164 and 165: Table 10.4: Users’ Share in Benef
- Page 166 and 167: From Hands Around Everest bookFrom
- Page 168 and 169: Table 10.8: Subsidy Rate for Biogas
- Page 170 and 171:
microorganism communities and the n
- Page 172 and 173:
subsidies (Mason 1996). All these a
- Page 174 and 175:
addressed only part of the problem.
- Page 176 and 177:
historical practice of community-ma
- Page 178 and 179:
moved or relocated. The fact that s
- Page 180 and 181:
Kathmandu Valley and receives a lar
- Page 182 and 183:
cooperative ventures provided neith
- Page 184 and 185:
further poaching has not been repor
- Page 186 and 187:
http://www.pugwash.org/reports/pac/
- Page 188 and 189:
United Nations. 2003. World Populat
- Page 190 and 191:
how other countries with substantia
- Page 192 and 193:
(i) Broad-based and sustainable eco
- Page 194 and 195:
Although progress is encouraging, m
- Page 196 and 197:
Nepal’s Changing Pattern of Trade
- Page 198 and 199:
Table 12.2: Trade/ GDP RatiosFY1981
- Page 200 and 201:
Table 12.5: Percentage Share of Maj
- Page 202 and 203:
well as other provisions in specifi
- Page 204 and 205:
Future Implications for NepalIncrea
- Page 206 and 207:
International Trade Forum (ITN). 20
- Page 208 and 209:
- Gross domestic product per unit e
- Page 210 and 211:
Time Series InformationGenerally tw
- Page 212 and 213:
Table 13.1a: Different Datasets Col
- Page 214 and 215:
elevant due to its multidisciplinar
- Page 216 and 217:
Figure 13.6: Examples of Applicatio
- Page 218 and 219:
Judith DobmannThere are many source
- Page 220 and 221:
———.2003. Mapping Nepal Censu
- Page 222 and 223:
sustainable livelihoods requires an
- Page 224 and 225:
and haphazard. Population pressures
- Page 226 and 227:
issue. These deficiencies stem from
- Page 228 and 229:
population must be assessed. MOEST
- Page 230 and 231:
Appendix 14.1: List of Key Environm
- Page 232 and 233:
(vii) The EIA report approving agen
- Page 234 and 235:
Goal 1: Eradicate extreme poverty a
- Page 236 and 237:
Nepal’s Progress Towards the MDGs
- Page 238 and 239:
Goal 4: Reduce child mortalityReduc