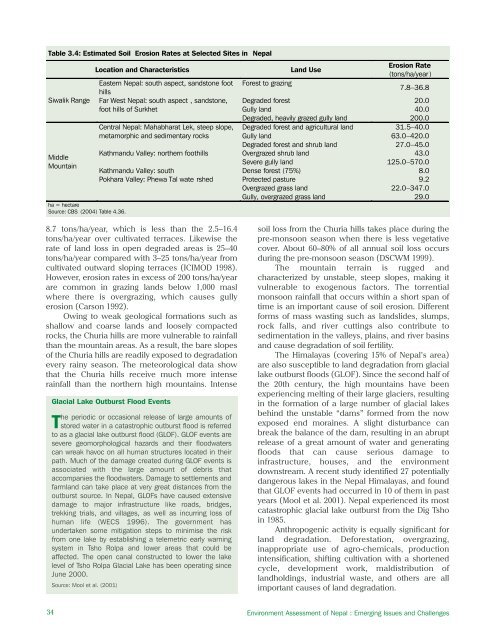
Table 3.4: Estimated Soil Erosion Rates at Selected Sites in NepalSiwalik RangeMiddleMountainha = hectareSource: CBS (2004) Table 4.36.Location and CharacteristicsLand UseErosion Rate(tons/ha/year )Eastern Nepal: south aspect, sandstone foot Forest to grazinghills7.8–36.8Far West Nepal: south aspect , sandstone, Degraded forest 20.0foot hills of SurkhetGully land 40.0Degraded, heavily grazed gully land 200.0Central Nepal: Mahabharat Lek, steep slope, Degraded forest and agricultural land 31.5–40.0metamorphic and sedimentary rocks Gully land 63.0–420.0Degraded forest and shrub land 27.0–45.0Kathmandu Valley: northern foothills Overgrazed shrub land 43.0Severe gully land 125.0–570.0Kathmandu Valley: south Dense forest (75%) 8.0Pokhara Valley: Phewa Tal wate rshed Protected pasture 9.2Overgrazed grass land 22.0–347.0Gully, overgrazed grass land 29.08.7 tons/ha/year, which is less than the 2.5–16.4tons/ha/year over cultivated terraces. Likewise therate of land loss in open degraded areas is 25–40tons/ha/year compared with 3–25 tons/ha/year fromcultivated outward sloping terraces (ICIMOD 1998).However, erosion rates in excess of 200 tons/ha/yearare common in grazing lands below 1,000 maslwhere there is overgrazing, which causes gullyerosion (Carson 1992).Owing to weak geological formations such asshallow and coarse lands and loosely compactedrocks, the Churia hills are more vulnerable to rainfallthan the mountain areas. As a result, the bare slopesof the Churia hills are readily exposed to degradationevery rainy season. The meteorological data showthat the Churia hills receive much more intenserainfall than the northern high mountains. IntenseGlacial Lake Outburst Flood EventsThe periodic or occasional release of large amounts ofstored water in a catastrophic outburst flood is referredto as a glacial lake outburst flood (GLOF). GLOF events aresevere geomorphological hazards and their floodwaterscan wreak havoc on all human structures located in theirpath. Much of the damage created during GLOF events isassociated with the large amount of debris thataccompanies the floodwaters. Damage to settlements andfarmland can take place at very great distances from theoutburst source. In Nepal, GLOFs have caused extensivedamage to major infrastructure like roads, bridges,trekking trials, and villages, as well as incurring loss ofhuman life (WECS 1996). The government hasundertaken some mitigation steps to minimise the riskfrom one lake by establishing a telemetric early warningsystem in Tsho Rolpa and lower areas that could beaffected. The open canal constructed to lower the lakelevel of Tsho Rolpa Glacial Lake has been operating sinceJune 2000.Source: Mool et al. (2001)soil loss from the Churia hills takes place during thepre-monsoon season when there is less vegetativecover. About 60–80% of all annual soil loss occursduring the pre-monsoon season (DSCWM 1999).The mountain terrain is rugged andcharacterized by unstable, steep slopes, making itvulnerable to exogenous factors. The torrentialmonsoon rainfall that occurs within a short span oftime is an important cause of soil erosion. Differentforms of mass wasting such as landslides, slumps,rock falls, and river cuttings also contribute tosedimentation in the valleys, plains, and river basinsand cause degradation of soil fertility.The Himalayas (covering 15% of Nepal’s area)are also susceptible to land degradation from glaciallake outburst floods (GLOF). Since the second half ofthe 20th century, the high mountains have beenexperiencing melting of their large glaciers, resultingin the formation of a large number of glacial lakesbehind the unstable “dams” formed from the nowexposed end moraines. A slight disturbance canbreak the balance of the dam, resulting in an abruptrelease of a great amount of water and generatingfloods that can cause serious damage toinfrastructure, houses, and the environmentdownstream. A recent study identified 27 potentiallydangerous lakes in the Nepal Himalayas, and foundthat GLOF events had occurred in 10 of them in pastyears (Mool et al. 2001). Nepal experienced its mostcatastrophic glacial lake outburst from the Dig Tshoin 1985.Anthropogenic activity is equally significant forland degradation. Deforestation, overgrazing,inappropriate use of agro-chemicals, productionintensification, shifting cultivation with a shortenedcycle, development work, maldistribution oflandholdings, industrial waste, and others are allimportant causes of land degradation.34 Environment Assessment of Nepal : Emerging Issues and Challenges
Clearing forests for cultivation to meet the foodrequirements of the growing population, particularlyover the sloping areas of the middle Hills, hasresulted in accelerated soil erosion, decliningproductivity, and sedimentation in downstreamareas and the Terai plains (Zimsky 1999). Forestresources have also been pressured by increasingnumbers of livestock, from 14.9 million head(equivalent to 9,790 thousand livestock units (LU) in1984 to 17.6 million head (11,226 thousand LU) in1998. The increasing livestock population hasincreased the demand for fodder and leaf litter fromthe forest, causing land erosion especially in the midHill region.Land degradation due to desertification hasbeen seen over about 10,000 ha of dry and cold landin the western <strong>Himalayan</strong> districts such as Dolpa andMustang. This is mainly due to scanty vegetation onmarginal land grazed by an excessive number oflivestock.Agricultural land is subject to ever-greaterintensification of use through double and multiplecropping to produce more food for the increasingpopulation. Soil micronutrients are depleting due tooveruse, inadequate supplements, and imbalancedapplication of fertilizers. For instance, the most recentdata available (DOA 2000) show low or mediumnitrogen content in 48% and 40% of of 9,827 farmlandsamples analyzed; 64% of 7,520 farmland samples hadlow organic matter and high to medium potassiumcontent and 35% had low phosphorous content andoverall deficiency in micronutrients such as zinc,manganese, molybdenum, copper, iron, and boron.These results indicate the highly nutrientdeficient status of farmland. As a result, productivityof crops has declined. The impact appears to bemuch more serious among poor farmers who mostlycultivate marginal lands on steeper slopes. The yieldsof maize and millet declined by more than 4% perannum between 1977 and 1997, while those of paddyand wheat increased by 16–37% per annum, duemainly to increased use of agro-chemicals (MOA1999). The use of high yielding seeds has increasedthe yield of crops per unit of land, but has resulted inless production of crop residues and greater uptakeof soil nutrients. This has forced farmers to dependmore on fertilizers than on manure, as well as to usedifferent types of insecticides and pesticides.Consumption of fertilizers (nitrogen, phosphate, andpotassium) increased from 7 kg/ha per year in 1980to 25 kg/ha per year in 1993.Average use of fertilizer by district ranges fromless than 10 kg/ha to more than 100 kg/ha. Thefertilizer use by Nepalese farmers is lowest amongthe South Asian countries. The use of pesticides is onthe increase. In 1998, the most recent year for whichreliable data are available, about 250 types ofpesticide, 40 types of herbicide, and various differentfungicides were used to minimize the loss ofagricultural production to pests and insects (MOF1999). However, despite the use of pesticides, cropyields have not increased significantly even thoughthe land ecology has been degraded. In commercialfarming, the national average consumption rate ofpesticides was estimated at 650 g/ha. In 1997, thePesticides Registration Office at the Department ofAgriculture estimated that about 60 tons of differentpesticides were imported into Nepal.Land ownership patterns are another cause ofland degradation. The agricultural statistics (CBS2004) indicate that the marginalized and smallfarmers with landholdings below one hectareaccount for 69% of all farmers, but these farms coveronly 31% of the total landholding area. As describedearlier, there has been an increase in the number offarmland holdings, while the average holding sizehas decreased.The land system in and around major urbanareas is affected by solid waste disposal. Productionof municipal waste increased from 0.144 million tonsin 1984 to 0.330 million tons in 1997 (CBS 1998; morerecent statistics are not available). Production oftoxic and hazardous waste increased from 270 to 512tons over the same time interval (Tuladhar 1999).This waste is disposed on land surrounding towns orin water bodies without any treatment.Land degradation is often seen as a side-effectof development work such as construction of roadsand irrigation canals along hill slopes, which havecontributed to landslides and land erosion. Laban(1979) estimated that 5% of all landslides in Nepalare associated with roads and trails. Theconstruction of roads is on the rise, and after roadsare built they are usually ravaged by recurrentlandslides and rock falls during the monsoon season.Stone quarrying can also lead to landslides andsoil erosion; however, no hard data are available.Impacts of Land DegradationOne of the direct impacts of land degradation is theloss of topsoil, which together with organic matterand plant nutrients influences soil fertility. Loss of soilat the rate of 5 tons/ha is equivalent to a loss of 75kg/ha of organic matter, 3.8 kg/ha of nitrogen, 10kg/ha of potassium, and 5 kg/ha of phosphorous inthe middle hills of Nepal (Carson 1992). Thecountry’s major rivers carry away thousands of tonsof sediment annually, but a large part of this occursnaturally and a significant part is composed ofriverbed load, embankment erosion, and similarcomponents.Chapter 3: Land Resources and Land Degradation35
- Page 2 and 3: About the OrganisationsAsian Develo
- Page 4 and 5: © 2006 International Centre for In
- Page 6 and 7: AcknowledgementsWe would like to ex
- Page 8 and 9: PM2.5PAHRSSAARCSACEPSEASO 2TSPUKUND
- Page 10 and 11: Chapter 6: Energy Resources 65Intro
- Page 12 and 13: List of FiguresFigure 2.1: People a
- Page 14 and 15: Table 6.1: Energy Consumption and P
- Page 16 and 17: forests are also used for infrastru
- Page 18 and 19: as data gathered by different agenc
- Page 20 and 21: Table 2.1: Population Growth Rates
- Page 22 and 23: mortality rates for rural and urban
- Page 24 and 25: Agglomeration village in the centra
- Page 26 and 27: soil erosion, and depletion of wate
- Page 30 and 31: provision remains inadequate becaus
- Page 32 and 33: Malnutrition remains a serious obst
- Page 34 and 35: Table 2.24: Existing and Projected
- Page 36 and 37: Table 2.28: Income Poverty Indicato
- Page 38 and 39: Table 2.31: Change in Employment St
- Page 40 and 41: In 2004, the average annual househo
- Page 42 and 43: Mountain areas have the most food i
- Page 44 and 45: Schaffner, U. 1987. “Road Constru
- Page 46 and 47: Table 3.1: Agricultural Economic De
- Page 50 and 51: B. PradhanImpacts of land degradati
- Page 52 and 53: Carson, B. 1985. “Erosion and Sed
- Page 54 and 55: The trend of forest coverage in the
- Page 56 and 57: BiodiversityState of BiodiversityNe
- Page 58 and 59: The Government has given legal prot
- Page 60 and 61: Different ways of maintaining biodi
- Page 62 and 63: ———.2004. State of the Enviro
- Page 64 and 65: Appendix 4.1: Table continuedMajor
- Page 66 and 67: Appendix 4.2: Protected Plant and W
- Page 68 and 69: Table A4.2.3: Nepal's Share in Plan
- Page 70 and 71: to intense weathering, and percolat
- Page 72 and 73: Table 5.5: Water Supply and Water T
- Page 74 and 75: Table 5.9: Water Quality of Shallow
- Page 76 and 77: species are reported to be endanger
- Page 78 and 79: Ministry of Water Resources (MOWR).
- Page 80 and 81: Definition, Forms, and UnitsEnergy
- Page 82 and 83: Table 6.5: Hydropower PotentialRive
- Page 84 and 85: Chilime Hydroelectric Project: An E
- Page 86 and 87: load occurs from 6 pm to 9 pm with
- Page 88 and 89: assessment of wind energy and lack
- Page 90 and 91: Review of Dams and Development by t
- Page 92 and 93: IUCNElizabeth Khaka, UNEP-NairobiRu
- Page 94 and 95: therefore reflect the three guiding
- Page 96 and 97: is a seasonal dust storm. Anthropog
- Page 98 and 99:
Figure 7.3: Average Air Quality, Ja
- Page 100 and 101:
matter, hydrocarbons, and NO x (Nae
- Page 102 and 103:
Figure: 7.9: Vehicle Registered in
- Page 104 and 105:
Brick Kilnchlorofluorocarbons (HCFC
- Page 106 and 107:
Climate ChangeA region’s climate
- Page 108 and 109:
Figure 7.14: Mean Annual Precipitat
- Page 110 and 111:
Table 7.3: National Ambient Air Qua
- Page 112 and 113:
India. Available: http://www.cleana
- Page 114 and 115:
———.1999. “Ambient Air Qual
- Page 116 and 117:
Appendix 7.1: World Health Organiza
- Page 118 and 119:
Table 8.1: Criteria for Urban Statu
- Page 120 and 121:
accommodate the rapidly increasing
- Page 122 and 123:
managing solid waste. They are part
- Page 124 and 125:
In most municipalities, hazardous w
- Page 126 and 127:
in worsening public health conditio
- Page 128 and 129:
objects of archaeological, historic
- Page 130 and 131:
Min BajracharyaB. PradhanVehicles a
- Page 132 and 133:
Department of Health Services (DOHS
- Page 134 and 135:
Table 9.1 describes the major highl
- Page 136 and 137:
the period to up 2017. The document
- Page 138 and 139:
earthquakes; and awareness raising
- Page 140 and 141:
Sub-regional LinkagesOther developi
- Page 142 and 143:
Figure 9.1: The Key Environmental I
- Page 144 and 145:
(iv)(v)(vi)plants, and other non-ti
- Page 146 and 147:
environmental governance can be bet
- Page 148 and 149:
can vary considerably. Both sides h
- Page 150 and 151:
Dhungel, D.N., and A.B. Rajbhandari
- Page 152 and 153:
Table A9.1.2: Industry-Specific Tol
- Page 154 and 155:
. Cultural Heritage8. Convention fo
- Page 156 and 157:
Appendix 9.3: Some Prominent Enviro
- Page 158 and 159:
Some funding arrangements made by t
- Page 160 and 161:
(NARDF 2004) for a period of 1 to 3
- Page 162 and 163:
Table 10.2: Annual Income and Expen
- Page 164 and 165:
Table 10.4: Users’ Share in Benef
- Page 166 and 167:
From Hands Around Everest bookFrom
- Page 168 and 169:
Table 10.8: Subsidy Rate for Biogas
- Page 170 and 171:
microorganism communities and the n
- Page 172 and 173:
subsidies (Mason 1996). All these a
- Page 174 and 175:
addressed only part of the problem.
- Page 176 and 177:
historical practice of community-ma
- Page 178 and 179:
moved or relocated. The fact that s
- Page 180 and 181:
Kathmandu Valley and receives a lar
- Page 182 and 183:
cooperative ventures provided neith
- Page 184 and 185:
further poaching has not been repor
- Page 186 and 187:
http://www.pugwash.org/reports/pac/
- Page 188 and 189:
United Nations. 2003. World Populat
- Page 190 and 191:
how other countries with substantia
- Page 192 and 193:
(i) Broad-based and sustainable eco
- Page 194 and 195:
Although progress is encouraging, m
- Page 196 and 197:
Nepal’s Changing Pattern of Trade
- Page 198 and 199:
Table 12.2: Trade/ GDP RatiosFY1981
- Page 200 and 201:
Table 12.5: Percentage Share of Maj
- Page 202 and 203:
well as other provisions in specifi
- Page 204 and 205:
Future Implications for NepalIncrea
- Page 206 and 207:
International Trade Forum (ITN). 20
- Page 208 and 209:
- Gross domestic product per unit e
- Page 210 and 211:
Time Series InformationGenerally tw
- Page 212 and 213:
Table 13.1a: Different Datasets Col
- Page 214 and 215:
elevant due to its multidisciplinar
- Page 216 and 217:
Figure 13.6: Examples of Applicatio
- Page 218 and 219:
Judith DobmannThere are many source
- Page 220 and 221:
———.2003. Mapping Nepal Censu
- Page 222 and 223:
sustainable livelihoods requires an
- Page 224 and 225:
and haphazard. Population pressures
- Page 226 and 227:
issue. These deficiencies stem from
- Page 228 and 229:
population must be assessed. MOEST
- Page 230 and 231:
Appendix 14.1: List of Key Environm
- Page 232 and 233:
(vii) The EIA report approving agen
- Page 234 and 235:
Goal 1: Eradicate extreme poverty a
- Page 236 and 237:
Nepal’s Progress Towards the MDGs
- Page 238 and 239:
Goal 4: Reduce child mortalityReduc