ADB_book_18 April.qxp - Himalayan Document Centre - icimod
ADB_book_18 April.qxp - Himalayan Document Centre - icimod
ADB_book_18 April.qxp - Himalayan Document Centre - icimod
- No tags were found...
Create successful ePaper yourself
Turn your PDF publications into a flip-book with our unique Google optimized e-Paper software.
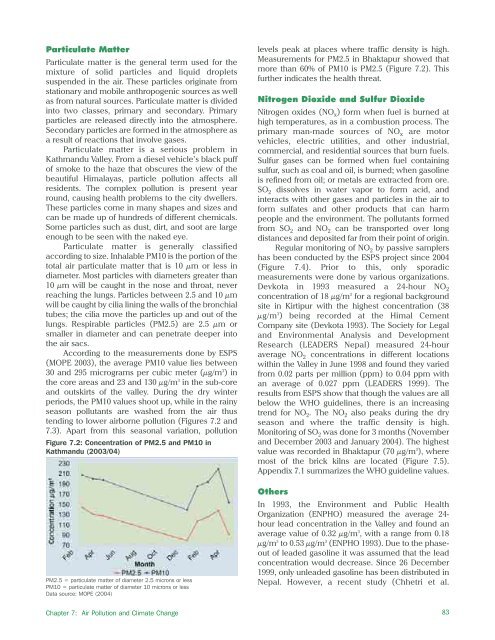
Particulate MatterParticulate matter is the general term used for themixture of solid particles and liquid dropletssuspended in the air. These particles originate fromstationary and mobile anthropogenic sources as wellas from natural sources. Particulate matter is dividedinto two classes, primary and secondary. Primaryparticles are released directly into the atmosphere.Secondary particles are formed in the atmosphere asa result of reactions that involve gases.Particulate matter is a serious problem inKathmandu Valley. From a diesel vehicle’s black puffof smoke to the haze that obscures the view of thebeautiful Himalayas, particle pollution affects allresidents. The complex pollution is present yearround, causing health problems to the city dwellers.These particles come in many shapes and sizes andcan be made up of hundreds of different chemicals.Some particles such as dust, dirt, and soot are largeenough to be seen with the naked eye.Particulate matter is generally classifiedaccording to size. Inhalable PM10 is the portion of thetotal air particulate matter that is 10 μm or less indiameter. Most particles with diameters greater than10 μm will be caught in the nose and throat, neverreaching the lungs. Particles between 2.5 and 10 μmwill be caught by cilia lining the walls of the bronchialtubes; the cilia move the particles up and out of thelungs. Respirable particles (PM2.5) are 2.5 μm orsmaller in diameter and can penetrate deeper intothe air sacs.According to the measurements done by ESPS(MOPE 2003), the average PM10 value lies between30 and 295 micrograms per cubic meter (μg/m 3 ) inthe core areas and 23 and 130 μg/m 3 in the sub-coreand outskirts of the valley. During the dry winterperiods, the PM10 values shoot up, while in the rainyseason pollutants are washed from the air thustending to lower airborne pollution (Figures 7.2 and7.3). Apart from this seasonal variation, pollutionFigure 7.2: Concentration of PM2.5 and PM10 inKathmandu (2003/04)PM2.5 = particulate matter of diameter 2.5 microns or lessPM10 = particulate matter of diameter 10 microns or lessData source: MOPE (2004)Chapter 7: Air Pollution and Climate Changelevels peak at places where traffic density is high.Measurements for PM2.5 in Bhaktapur showed thatmore than 60% of PM10 is PM2.5 (Figure 7.2). Thisfurther indicates the health threat.Nitrogen Dioxide and Sulfur DioxideNitrogen oxides (NO x ) form when fuel is burned athigh temperatures, as in a combustion process. Theprimary man-made sources of NO x are motorvehicles, electric utilities, and other industrial,commercial, and residential sources that burn fuels.Sulfur gases can be formed when fuel containingsulfur, such as coal and oil, is burned; when gasolineis refined from oil; or metals are extracted from ore.SO 2 dissolves in water vapor to form acid, andinteracts with other gases and particles in the air toform sulfates and other products that can harmpeople and the environment. The pollutants formedfrom SO 2 and NO 2 can be transported over longdistances and deposited far from their point of origin.Regular monitoring of NO 2 by passive samplershas been conducted by the ESPS project since 2004(Figure 7.4). Prior to this, only sporadicmeasurements were done by various organizations.Devkota in 1993 measured a 24-hour NO 2concentration of <strong>18</strong> μg/m 3 for a regional backgroundsite in Kirtipur with the highest concentration (38μg/m 3 ) being recorded at the Himal CementCompany site (Devkota 1993). The Society for Legaland Environmental Analysis and DevelopmentResearch (LEADERS Nepal) measured 24-houraverage NO 2 concentrations in different locationswithin the Valley in June 1998 and found they variedfrom 0.02 parts per million (ppm) to 0.04 ppm withan average of 0.027 ppm (LEADERS 1999). Theresults from ESPS show that though the values are allbelow the WHO guidelines, there is an increasingtrend for NO 2 . The NO 2 also peaks during the dryseason and where the traffic density is high.Monitoring of SO 2 was done for 3 months (Novemberand December 2003 and January 2004). The highestvalue was recorded in Bhaktapur (70 μg/m 3 ), wheremost of the brick kilns are located (Figure 7.5).Appendix 7.1 summarizes the WHO guideline values.OthersIn 1993, the Environment and Public HealthOrganization (ENPHO) measured the average 24-hour lead concentration in the Valley and found anaverage value of 0.32 μg/m 3 , with a range from 0.<strong>18</strong>μg/m 3 to 0.53 μg/m 3 (ENPHO 1993). Due to the phaseoutof leaded gasoline it was assumed that the leadconcentration would decrease. Since 26 December1999, only unleaded gasoline has been distributed inNepal. However, a recent study (Chhetri et al.83


