

ADB_book_18 April.qxp - Himalayan Document Centre - icimod
ADB_book_18 April.qxp - Himalayan Document Centre - icimod
ADB_book_18 April.qxp - Himalayan Document Centre - icimod
- No tags were found...

You also want an ePaper? Increase the reach of your titles
YUMPU automatically turns print PDFs into web optimized ePapers that Google loves.
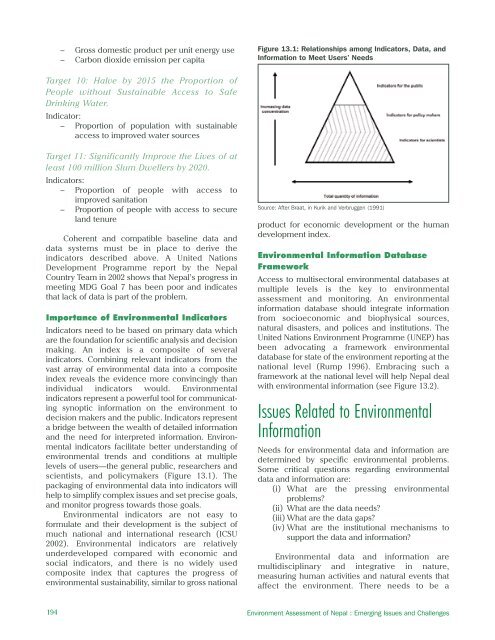
– Gross domestic product per unit energy use– Carbon dioxide emission per capitaFigure 13.1: Relationships among Indicators, Data, andInformation to Meet Users’ NeedsTarget 10: Halve by 2015 the Proportion ofPeople without Sustainable Access to SafeDrinking Water.Indicator:– Proportion of population with sustainableaccess to improved water sourcesTarget 11: Significantly Improve the Lives of atleast 100 million Slum Dwellers by 2020.Indicators:– Proportion of people with access toimproved sanitation– Proportion of people with access to secureland tenureCoherent and compatible baseline data anddata systems must be in place to derive theindicators described above. A United NationsDevelopment Programme report by the NepalCountry Team in 2002 shows that Nepal’s progress inmeeting MDG Goal 7 has been poor and indicatesthat lack of data is part of the problem.Importance of Environmental IndicatorsIndicators need to be based on primary data whichare the foundation for scientific analysis and decisionmaking. An index is a composite of severalindicators. Combining relevant indicators from thevast array of environmental data into a compositeindex reveals the evidence more convincingly thanindividual indicators would. Environmentalindicators represent a powerful tool for communicatingsynoptic information on the environment todecision makers and the public. Indicators representa bridge between the wealth of detailed informationand the need for interpreted information. Environmentalindicators facilitate better understanding ofenvironmental trends and conditions at multiplelevels of users—the general public, researchers andscientists, and policymakers (Figure 13.1). Thepackaging of environmental data into indicators willhelp to simplify complex issues and set precise goals,and monitor progress towards those goals.Environmental indicators are not easy toformulate and their development is the subject ofmuch national and international research (ICSU2002). Environmental indicators are relativelyunderdeveloped compared with economic andsocial indicators, and there is no widely usedcomposite index that captures the progress ofenvironmental sustainability, similar to gross nationalSource: After Braat, in Kurik and Verbruggen (1991)product for economic development or the humandevelopment index.Environmental Information DatabaseFrameworkAccess to multisectoral environmental databases atmultiple levels is the key to environmentalassessment and monitoring. An environmentalinformation database should integrate informationfrom socioeconomic and biophysical sources,natural disasters, and polices and institutions. TheUnited Nations Environment Programme (UNEP) hasbeen advocating a framework environmentaldatabase for state of the environment reporting at thenational level (Rump 1996). Embracing such aframework at the national level will help Nepal dealwith environmental information (see Figure 13.2).Issues Related to EnvironmentalInformationNeeds for environmental data and information aredetermined by specific environmental problems.Some critical questions regarding environmentaldata and information are:(i) What are the pressing environmentalproblems?(ii) What are the data needs?(iii) What are the data gaps?(iv) What are the institutional mechanisms tosupport the data and information?Environmental data and information aremultidisciplinary and integrative in nature,measuring human activities and natural events thataffect the environment. There needs to be a194 Environment Assessment of Nepal : Emerging Issues and Challenges


