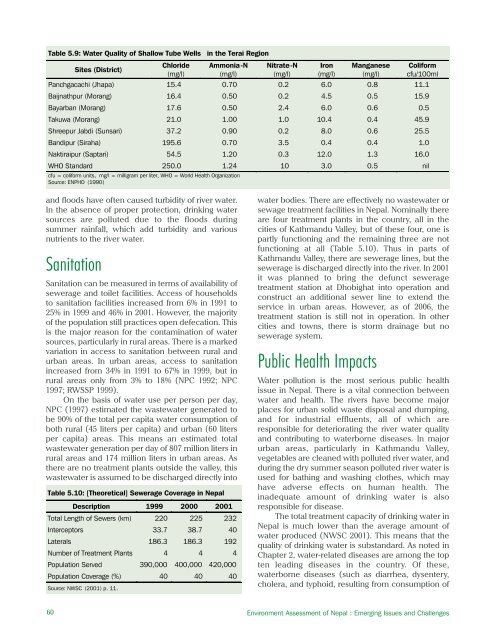
Table 5.9: Water Quality of Shallow Tube Wells in the Terai RegionSites (District)Chloride(mg/l)Ammonia-N(mg/l)Nitrate-N(mg/l)Iron(mg/l)Manganese(mg/l)Coliformcfu/100mlPanchgacachi (Jhapa) 15.4 0.70 0.2 6.0 0.8 11.1Baijnathpur (Morang) 16.4 0.50 0.2 4.5 0.5 15.9Bayarban (Morang) 17.6 0.50 2.4 6.0 0.6 0.5Takuwa (Morang) 21.0 1.00 1.0 10.4 0.4 45.9Shreepur Jabdi (Sunsari) 37.2 0.90 0.2 8.0 0.6 25.5Bandipur (Siraha) 195.6 0.70 3.5 0.4 0.4 1.0Naktiraipur (Saptari) 54.5 1.20 0.3 12.0 1.3 16.0WHO Standard 250.0 1.24 10 3.0 0.5 nilcfu = coliform units, mg/l = milligram per liter, WHO = World Health OrganizationSource: ENPHO (1990)and floods have often caused turbidity of river water.In the absence of proper protection, drinking watersources are polluted due to the floods duringsummer rainfall, which add turbidity and variousnutrients to the river water.SanitationSanitation can be measured in terms of availability ofsewerage and toilet facilities. Access of householdsto sanitation facilities increased from 6% in 1991 to25% in 1999 and 46% in 2001. However, the majorityof the population still practices open defecation. Thisis the major reason for the contamination of watersources, particularly in rural areas. There is a markedvariation in access to sanitation between rural andurban areas. In urban areas, access to sanitationincreased from 34% in 1991 to 67% in 1999, but inrural areas only from 3% to <strong>18</strong>% (NPC 1992; NPC1997; RWSSP 1999).On the basis of water use per person per day,NPC (1997) estimated the wastewater generated tobe 90% of the total per capita water consumption ofboth rural (45 liters per capita) and urban (60 litersper capita) areas. This means an estimated totalwastewater generation per day of 807 million liters inrural areas and 174 million liters in urban areas. Asthere are no treatment plants outside the valley, thiswastewater is assumed to be discharged directly intoTable 5.10: [Theoretical] Sewerage Coverage in NepalDescription 1999 2000 2001Total Length of Sewers (km) 220 225 232Interceptors 33.7 38.7 40Laterals <strong>18</strong>6.3 <strong>18</strong>6.3 192Number of Treatment Plants 4 4 4Population Served 390,000 400,000 420,000Population Coverage (%) 40 40 40Source: NWSC (2001) p. 11.water bodies. There are effectively no wastewater orsewage treatment facilities in Nepal. Nominally thereare four treatment plants in the country, all in thecities of Kathmandu Valley, but of these four, one ispartly functioning and the remaining three are notfunctioning at all (Table 5.10). Thus in parts ofKathmandu Valley, there are sewerage lines, but thesewerage is discharged directly into the river. In 2001it was planned to bring the defunct seweragetreatment station at Dhobighat into operation andconstruct an additional sewer line to extend theservice in urban areas. However, as of 2006, thetreatment station is still not in operation. In othercities and towns, there is storm drainage but nosewerage system.Public Health ImpactsWater pollution is the most serious public healthissue in Nepal. There is a vital connection betweenwater and health. The rivers have become majorplaces for urban solid waste disposal and dumping,and for industrial effluents, all of which areresponsible for deteriorating the river water qualityand contributing to waterborne diseases. In majorurban areas, particularly in Kathmandu Valley,vegetables are cleaned with polluted river water, andduring the dry summer season polluted river water isused for bathing and washing clothes, which mayhave adverse effects on human health. Theinadequate amount of drinking water is alsoresponsible for disease.The total treatment capacity of drinking water inNepal is much lower than the average amount ofwater produced (NWSC 2001). This means that thequality of drinking water is substandard. As noted inChapter 2, water-related diseases are among the topten leading diseases in the country. Of these,waterborne diseases (such as diarrhea, dysentery,cholera, and typhoid, resulting from consumption of60 Environment Assessment of Nepal : Emerging Issues and Challenges
contaminated water) and water-washed diseases(due to poor sanitation such as worm infestation andskin diseases) account for <strong>18</strong>% and 27% of the totaloutpatient department (OPD) visits in the countryrespectively (DOHS 2005). The proportion of OPDvisits related to waterborne diseases ranges from ashigh as 24% in Dailekh and Arghakhanchi (hilldistricts) to 14% (Bhaktapur, Lalitpur, Jhapa, Parsaand Rupandehi). The proportion of visits related towater-washed diseases was highest in Parsa (Teraidistrict) at 40%, and lowest in Dadeldhura (hilldistrict) at 12%. These water-related diseases aregenerally caused by poor sanitation and poor waterquality (DOHS 2005). Recent data from theDepartment of Health Services (2005) show that theincidence of diarrhea among children under fiveyears of age is 222 per 1,000, up from 131 per 1,000 in1996 (DOHS 1996). The reported mortality rate due todiarrhea was 0.34 per 1,000 children under five yearsof age in 1996, but has been reduced to 0.05 (DOHS2005). This indicates a greater focus on curativeaspects of the health services than on improvementsin the quality of the water supply. The hospitalrecords for Sukraraj Tropical Infectious DiseaseHospital in Kathmandu show about 16% of all deathsas due to waterborne diseases (STIDH 2004).Figure 5.2 shows the incidence of waterborneand water-washed diseases among outpatient visitsto hospitals (DOHS 2003). Waterborne diseases referto diseases due to consumption of contaminatedwater such as diarrhea, dysentery, and cholera;whereas water-washed diseases are due to poorsanitation conditions. The state of these two types ofwater-related diseases is usually used to describe thesanitation and health of any area. Among the regions,the proportion of water-related diseases is highest inthe Terai.The combined effects of land, soil, water, andair degradation on public health are significant,Figure. 5.2: Proportion of Water-related Diseases toTotal Outpatient Department Visits, NepalOPD = Outpatient DepartmentSource: DOHS (2003)particularly for the rural poor. These effects have agreat impact on their livelihood activities, becausethe poor already suffer from poor health as a result ofinadequate diets, low income, and degraded livingareas.WetlandsNepal’s wetlands provide habitat for a number ofendemic and threatened biological species, as wellas for humans. Many ethnic groups rely on wetlandresources for their livelihood. Wetlands are thereforevaluable for the overall socioeconomic developmentof the country. Unfortunately, most of the wetlandsand their rich biological resources, especially thosein the Terai, are facing several threats due to thegrowing demand of the population for land and avariety of products and services. The threats includesiltation, eutrophication, overexploitation of wetlandresources, over fishing, hunting and poaching,overgrazing, illegal harvesting of wetland resources,encroachment, water pollution, developmentalactivities in adjoining areas, drainage, introduction ofinvasive species, and floods. Due to conflicts amongthe local people in claiming the resources in andaround wetlands, and the absence of an effectivemechanism to ensure the efficient localmanagement of these valuable resources, valuablebiological species are gradually becoming extinct.Wetlands also provide habitat for thousands ofwater birds every year flying over an arduous 2,500-mile migratory journey from Siberia. Unfortunately, acrucial wetland resting point for these migratingflocks is drying up. The Koshi flood plain is flowingbelow its original capacity, at a level that is barelyable to support the local birdlife population, let alonethe 50,000 waterfowl that make up a spectacularmigratory showcase in the Koshi River during thewinter months each year (IUCN 1997).The conservation of Nepal’s wetlands shouldalso call for promoting collaborative efforts such ascommunity forestry programs and buffer zonemanagement programs that have been successful inmanaging natural resources in the country.Aquatic BiodiversityNepal is rich in aquatic floral and faunal biodiversity.Aquatic fauna species include fish, amphibians, andreptiles. Among aquatic fauna species, 34 arethreatened and 61 are insufficiently known (Shrestha1997). In Ilam in the eastern hills, katle(Neolissocheilus hexagonolepis) and silver mahseer(Tor tor) are reported to be endangered andthreatened, respectively (MOFSC 2002). Three fishChapter 5: Water Resources61
- Page 2 and 3:
About the OrganisationsAsian Develo
- Page 4 and 5:
© 2006 International Centre for In
- Page 6 and 7:
AcknowledgementsWe would like to ex
- Page 8 and 9:
PM2.5PAHRSSAARCSACEPSEASO 2TSPUKUND
- Page 10 and 11:
Chapter 6: Energy Resources 65Intro
- Page 12 and 13:
List of FiguresFigure 2.1: People a
- Page 14 and 15:
Table 6.1: Energy Consumption and P
- Page 16 and 17:
forests are also used for infrastru
- Page 18 and 19:
as data gathered by different agenc
- Page 20 and 21:
Table 2.1: Population Growth Rates
- Page 22 and 23:
mortality rates for rural and urban
- Page 24 and 25: Agglomeration village in the centra
- Page 26 and 27: soil erosion, and depletion of wate
- Page 30 and 31: provision remains inadequate becaus
- Page 32 and 33: Malnutrition remains a serious obst
- Page 34 and 35: Table 2.24: Existing and Projected
- Page 36 and 37: Table 2.28: Income Poverty Indicato
- Page 38 and 39: Table 2.31: Change in Employment St
- Page 40 and 41: In 2004, the average annual househo
- Page 42 and 43: Mountain areas have the most food i
- Page 44 and 45: Schaffner, U. 1987. “Road Constru
- Page 46 and 47: Table 3.1: Agricultural Economic De
- Page 48 and 49: Table 3.4: Estimated Soil Erosion R
- Page 50 and 51: B. PradhanImpacts of land degradati
- Page 52 and 53: Carson, B. 1985. “Erosion and Sed
- Page 54 and 55: The trend of forest coverage in the
- Page 56 and 57: BiodiversityState of BiodiversityNe
- Page 58 and 59: The Government has given legal prot
- Page 60 and 61: Different ways of maintaining biodi
- Page 62 and 63: ———.2004. State of the Enviro
- Page 64 and 65: Appendix 4.1: Table continuedMajor
- Page 66 and 67: Appendix 4.2: Protected Plant and W
- Page 68 and 69: Table A4.2.3: Nepal's Share in Plan
- Page 70 and 71: to intense weathering, and percolat
- Page 72 and 73: Table 5.5: Water Supply and Water T
- Page 76 and 77: species are reported to be endanger
- Page 78 and 79: Ministry of Water Resources (MOWR).
- Page 80 and 81: Definition, Forms, and UnitsEnergy
- Page 82 and 83: Table 6.5: Hydropower PotentialRive
- Page 84 and 85: Chilime Hydroelectric Project: An E
- Page 86 and 87: load occurs from 6 pm to 9 pm with
- Page 88 and 89: assessment of wind energy and lack
- Page 90 and 91: Review of Dams and Development by t
- Page 92 and 93: IUCNElizabeth Khaka, UNEP-NairobiRu
- Page 94 and 95: therefore reflect the three guiding
- Page 96 and 97: is a seasonal dust storm. Anthropog
- Page 98 and 99: Figure 7.3: Average Air Quality, Ja
- Page 100 and 101: matter, hydrocarbons, and NO x (Nae
- Page 102 and 103: Figure: 7.9: Vehicle Registered in
- Page 104 and 105: Brick Kilnchlorofluorocarbons (HCFC
- Page 106 and 107: Climate ChangeA region’s climate
- Page 108 and 109: Figure 7.14: Mean Annual Precipitat
- Page 110 and 111: Table 7.3: National Ambient Air Qua
- Page 112 and 113: India. Available: http://www.cleana
- Page 114 and 115: ———.1999. “Ambient Air Qual
- Page 116 and 117: Appendix 7.1: World Health Organiza
- Page 118 and 119: Table 8.1: Criteria for Urban Statu
- Page 120 and 121: accommodate the rapidly increasing
- Page 122 and 123: managing solid waste. They are part
- Page 124 and 125:
In most municipalities, hazardous w
- Page 126 and 127:
in worsening public health conditio
- Page 128 and 129:
objects of archaeological, historic
- Page 130 and 131:
Min BajracharyaB. PradhanVehicles a
- Page 132 and 133:
Department of Health Services (DOHS
- Page 134 and 135:
Table 9.1 describes the major highl
- Page 136 and 137:
the period to up 2017. The document
- Page 138 and 139:
earthquakes; and awareness raising
- Page 140 and 141:
Sub-regional LinkagesOther developi
- Page 142 and 143:
Figure 9.1: The Key Environmental I
- Page 144 and 145:
(iv)(v)(vi)plants, and other non-ti
- Page 146 and 147:
environmental governance can be bet
- Page 148 and 149:
can vary considerably. Both sides h
- Page 150 and 151:
Dhungel, D.N., and A.B. Rajbhandari
- Page 152 and 153:
Table A9.1.2: Industry-Specific Tol
- Page 154 and 155:
. Cultural Heritage8. Convention fo
- Page 156 and 157:
Appendix 9.3: Some Prominent Enviro
- Page 158 and 159:
Some funding arrangements made by t
- Page 160 and 161:
(NARDF 2004) for a period of 1 to 3
- Page 162 and 163:
Table 10.2: Annual Income and Expen
- Page 164 and 165:
Table 10.4: Users’ Share in Benef
- Page 166 and 167:
From Hands Around Everest bookFrom
- Page 168 and 169:
Table 10.8: Subsidy Rate for Biogas
- Page 170 and 171:
microorganism communities and the n
- Page 172 and 173:
subsidies (Mason 1996). All these a
- Page 174 and 175:
addressed only part of the problem.
- Page 176 and 177:
historical practice of community-ma
- Page 178 and 179:
moved or relocated. The fact that s
- Page 180 and 181:
Kathmandu Valley and receives a lar
- Page 182 and 183:
cooperative ventures provided neith
- Page 184 and 185:
further poaching has not been repor
- Page 186 and 187:
http://www.pugwash.org/reports/pac/
- Page 188 and 189:
United Nations. 2003. World Populat
- Page 190 and 191:
how other countries with substantia
- Page 192 and 193:
(i) Broad-based and sustainable eco
- Page 194 and 195:
Although progress is encouraging, m
- Page 196 and 197:
Nepal’s Changing Pattern of Trade
- Page 198 and 199:
Table 12.2: Trade/ GDP RatiosFY1981
- Page 200 and 201:
Table 12.5: Percentage Share of Maj
- Page 202 and 203:
well as other provisions in specifi
- Page 204 and 205:
Future Implications for NepalIncrea
- Page 206 and 207:
International Trade Forum (ITN). 20
- Page 208 and 209:
- Gross domestic product per unit e
- Page 210 and 211:
Time Series InformationGenerally tw
- Page 212 and 213:
Table 13.1a: Different Datasets Col
- Page 214 and 215:
elevant due to its multidisciplinar
- Page 216 and 217:
Figure 13.6: Examples of Applicatio
- Page 218 and 219:
Judith DobmannThere are many source
- Page 220 and 221:
———.2003. Mapping Nepal Censu
- Page 222 and 223:
sustainable livelihoods requires an
- Page 224 and 225:
and haphazard. Population pressures
- Page 226 and 227:
issue. These deficiencies stem from
- Page 228 and 229:
population must be assessed. MOEST
- Page 230 and 231:
Appendix 14.1: List of Key Environm
- Page 232 and 233:
(vii) The EIA report approving agen
- Page 234 and 235:
Goal 1: Eradicate extreme poverty a
- Page 236 and 237:
Nepal’s Progress Towards the MDGs
- Page 238 and 239:
Goal 4: Reduce child mortalityReduc