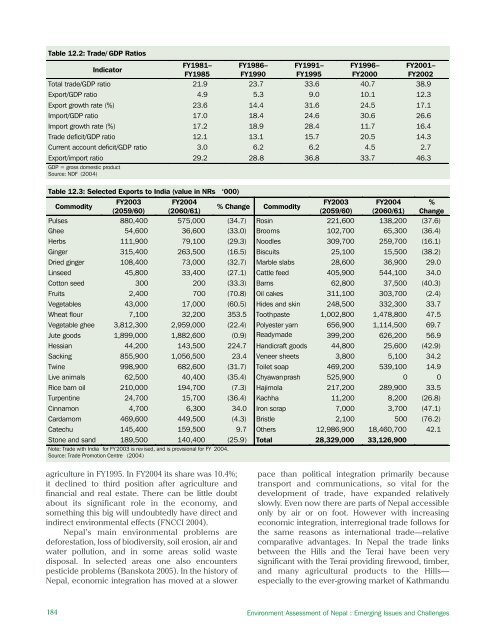
Table 12.2: Trade/ GDP RatiosFY1981– FY1986– FY1991– FY1996– FY2001–IndicatorFY1985 FY1990 FY1995 FY2000 FY2002Total trade/GDP ratio 21.9 23.7 33.6 40.7 38.9Export/GDP ratio 4.9 5.3 9.0 10.1 12.3Export growth rate (%) 23.6 14.4 31.6 24.5 17.1Import/GDP ratio 17.0 <strong>18</strong>.4 24.6 30.6 26.6Import growth rate (%) 17.2 <strong>18</strong>.9 28.4 11.7 16.4Trade deficit/GDP ratio 12.1 13.1 15.7 20.5 14.3Current account deficit/GDP ratio 3.0 6.2 6.2 4.5 2.7Export/import ratio 29.2 28.8 36.8 33.7 46.3GDP = gross domestic productSource: NDF (2004)Table 12.3: Selected Exports to India (value in NRs ‘000)CommodityFY2003 FY2004FY2003 FY2004 %% Change Commodity(2059/60) (2060/61)(2059/60) (2060/61) ChangePulses 880,400 575,000 (34.7) Rosin 221,600 138,200 (37.6)Ghee 54,600 36,600 (33.0) Brooms 102,700 65,300 (36.4)Herbs 111,900 79,100 (29.3) Noodles 309,700 259,700 (16.1)Ginger 315,400 263,500 (16.5) Biscuits 25,100 15,500 (38.2)Dried ginger 108,400 73,000 (32.7) Marble slabs 28,600 36,900 29.0Linseed 45,800 33,400 (27.1) Cattle feed 405,900 544,100 34.0Cotton seed 300 200 (33.3) Barns 62,800 37,500 (40.3)Fruits 2,400 700 (70.8) Oil cakes 311,100 303,700 (2.4)Vegetables 43,000 17,000 (60.5) Hides and skin 248,500 332,300 33.7Wheat flour 7,100 32,200 353.5 Toothpaste 1,002,800 1,478,800 47.5Vegetable ghee 3,812,300 2,959,000 (22.4) Polyester yarn 656,900 1,114,500 69.7Jute goods 1,899,000 1,882,600 (0.9) Readymade 399,200 626,200 56.9Hessian 44,200 143,500 224.7 Handicraft goods 44,800 25,600 (42.9)Sacking 855,900 1,056,500 23.4 Veneer sheets 3,800 5,100 34.2Twine 998,900 682,600 (31.7) Toilet soap 469,200 539,100 14.9Live animals 62,500 40,400 (35.4) Chyawanprash 525,900 0 0Rice barn oil 210,000 194,700 (7.3) Hajimola 217,200 289,900 33.5Turpentine 24,700 15,700 (36.4) Kachha 11,200 8,200 (26.8)Cinnamon 4,700 6,300 34.0 Iron scrap 7,000 3,700 (47.1)Cardamom 469,600 449,500 (4.3) Bristle 2,100 500 (76.2)Catechu 145,400 159,500 9.7 Others 12,986,900 <strong>18</strong>,460,700 42.1Stone and sand <strong>18</strong>9,500 140,400 (25.9) Total 28,329,000 33,126,900Note: Trade with India for FY2003 is rev ised, and is provisional for FY 2004.Source: Trade Promotion <strong>Centre</strong> (2004)agriculture in FY1995. In FY2004 its share was 10.4%;it declined to third position after agriculture andfinancial and real estate. There can be little doubtabout its significant role in the economy, andsomething this big will undoubtedly have direct andindirect environmental effects (FNCCI 2004).Nepal’s main environmental problems aredeforestation, loss of biodiversity, soil erosion, air andwater pollution, and in some areas solid wastedisposal. In selected areas one also encounterspesticide problems (Banskota 2005). In the history ofNepal, economic integration has moved at a slowerpace than political integration primarily becausetransport and communications, so vital for thedevelopment of trade, have expanded relativelyslowly. Even now there are parts of Nepal accessibleonly by air or on foot. However with increasingeconomic integration, interregional trade follows forthe same reasons as international trade—relativecomparative advantages. In Nepal the trade linksbetween the Hills and the Terai have been verysignificant with the Terai providing firewood, timber,and many agricultural products to the Hills—especially to the ever-growing market of Kathmandu<strong>18</strong>4 Environment Assessment of Nepal : Emerging Issues and Challenges
Table 12.4: Selected Imports from India (Value in NRs ‘ 000)CommodityFY2003(2059/60)FY 2004(2060/61)% ChangeLive animals 404,000 204,800 (49.3)Textiles 4,<strong>18</strong>6,100 3,176,900 (24.1)Readymade garments 444,700 410,900 (7.6)Raw cotton 91,400 89,300 (2.3)Thread 1,105,800 985,500 (10.9)Fruits 284,500 241,500 (15.1)Vegetables 772,800 638,700 (17.4)Milk products 508,800 427,100 (16.1)Tea 39,500 36,000 (8.9)Coffee 37,000 40,500 9.5Cumin seed and pepper 199,300 197,800 (0.8)Salt 713,300 607,300 (14.9)Sugar 119,500 12,600 (89.5)Rice 744,900 515,900 (30.7)Pulses 539,300 598,500 11.0Wheat 216,500 269,700 24.6Tobacco 534,300 563,200 5.4Chemicals 1,906,600 2,526,200 32.5Enamel and other paints 111,200 121,500 9.3Cement 2,934,700 2,1<strong>18</strong>,700 (27.8)Pipe and pipe fittings 128,400 123,100 (4.1)Sanitary wares 126,700 121,700 (3.9)Bitumen 54,300 168,900 211.0Electrical equipment 997,500 1,065,500 6.8Medicines 3,225,700 3,329,600 0.2Writing and pr inting paper 431,200 404,400 (6.2)Books and magazines 304,500 327,200 7.5Cosmetic goods 409,700 406,000 (0.9)Chemical fertilizers <strong>18</strong>3,500 562,700 206.6Insecticides 145,800 136,100 (6.7)Hand tools 67,900 57,900 (14.7)Agri-equipment and parts 689,900 477,400 (30.8)Vehicles and spare parts 3,857,800 4,923,900 27.6Tires, tubes and flaps 252,200 242,800 (3.7)Coal 695,400 775,300 11.5Machinery and parts 2,571,800 3,262,600 26.9Glass sheets and glassware 439,800 444,900 1.2Radios, televisions, decks & parts 128,600 87,900 (31.6)Shoes and sandals 87,700 67,600 (22.9)Wire products 162,700 99,200 (39.0)Others 21,257,300 30,617,300 44.0Total without petroleum products 52,112,600 61,484,600 <strong>18</strong>.0Petroleum products <strong>18</strong>,811,600 20,167,300 7.2Total 70,924,200 81,651,900 15.1Note: Trade with India for FY 2003 is revised, and is provisional for FY2004.Source: Trade Promotion <strong>Centre</strong> (2004)Chapter 12: Environment and Trade<strong>18</strong>5
- Page 2 and 3:
About the OrganisationsAsian Develo
- Page 4 and 5:
© 2006 International Centre for In
- Page 6 and 7:
AcknowledgementsWe would like to ex
- Page 8 and 9:
PM2.5PAHRSSAARCSACEPSEASO 2TSPUKUND
- Page 10 and 11:
Chapter 6: Energy Resources 65Intro
- Page 12 and 13:
List of FiguresFigure 2.1: People a
- Page 14 and 15:
Table 6.1: Energy Consumption and P
- Page 16 and 17:
forests are also used for infrastru
- Page 18 and 19:
as data gathered by different agenc
- Page 20 and 21:
Table 2.1: Population Growth Rates
- Page 22 and 23:
mortality rates for rural and urban
- Page 24 and 25:
Agglomeration village in the centra
- Page 26 and 27:
soil erosion, and depletion of wate
- Page 30 and 31:
provision remains inadequate becaus
- Page 32 and 33:
Malnutrition remains a serious obst
- Page 34 and 35:
Table 2.24: Existing and Projected
- Page 36 and 37:
Table 2.28: Income Poverty Indicato
- Page 38 and 39:
Table 2.31: Change in Employment St
- Page 40 and 41:
In 2004, the average annual househo
- Page 42 and 43:
Mountain areas have the most food i
- Page 44 and 45:
Schaffner, U. 1987. “Road Constru
- Page 46 and 47:
Table 3.1: Agricultural Economic De
- Page 48 and 49:
Table 3.4: Estimated Soil Erosion R
- Page 50 and 51:
B. PradhanImpacts of land degradati
- Page 52 and 53:
Carson, B. 1985. “Erosion and Sed
- Page 54 and 55:
The trend of forest coverage in the
- Page 56 and 57:
BiodiversityState of BiodiversityNe
- Page 58 and 59:
The Government has given legal prot
- Page 60 and 61:
Different ways of maintaining biodi
- Page 62 and 63:
———.2004. State of the Enviro
- Page 64 and 65:
Appendix 4.1: Table continuedMajor
- Page 66 and 67:
Appendix 4.2: Protected Plant and W
- Page 68 and 69:
Table A4.2.3: Nepal's Share in Plan
- Page 70 and 71:
to intense weathering, and percolat
- Page 72 and 73:
Table 5.5: Water Supply and Water T
- Page 74 and 75:
Table 5.9: Water Quality of Shallow
- Page 76 and 77:
species are reported to be endanger
- Page 78 and 79:
Ministry of Water Resources (MOWR).
- Page 80 and 81:
Definition, Forms, and UnitsEnergy
- Page 82 and 83:
Table 6.5: Hydropower PotentialRive
- Page 84 and 85:
Chilime Hydroelectric Project: An E
- Page 86 and 87:
load occurs from 6 pm to 9 pm with
- Page 88 and 89:
assessment of wind energy and lack
- Page 90 and 91:
Review of Dams and Development by t
- Page 92 and 93:
IUCNElizabeth Khaka, UNEP-NairobiRu
- Page 94 and 95:
therefore reflect the three guiding
- Page 96 and 97:
is a seasonal dust storm. Anthropog
- Page 98 and 99:
Figure 7.3: Average Air Quality, Ja
- Page 100 and 101:
matter, hydrocarbons, and NO x (Nae
- Page 102 and 103:
Figure: 7.9: Vehicle Registered in
- Page 104 and 105:
Brick Kilnchlorofluorocarbons (HCFC
- Page 106 and 107:
Climate ChangeA region’s climate
- Page 108 and 109:
Figure 7.14: Mean Annual Precipitat
- Page 110 and 111:
Table 7.3: National Ambient Air Qua
- Page 112 and 113:
India. Available: http://www.cleana
- Page 114 and 115:
———.1999. “Ambient Air Qual
- Page 116 and 117:
Appendix 7.1: World Health Organiza
- Page 118 and 119:
Table 8.1: Criteria for Urban Statu
- Page 120 and 121:
accommodate the rapidly increasing
- Page 122 and 123:
managing solid waste. They are part
- Page 124 and 125:
In most municipalities, hazardous w
- Page 126 and 127:
in worsening public health conditio
- Page 128 and 129:
objects of archaeological, historic
- Page 130 and 131:
Min BajracharyaB. PradhanVehicles a
- Page 132 and 133:
Department of Health Services (DOHS
- Page 134 and 135:
Table 9.1 describes the major highl
- Page 136 and 137:
the period to up 2017. The document
- Page 138 and 139:
earthquakes; and awareness raising
- Page 140 and 141:
Sub-regional LinkagesOther developi
- Page 142 and 143:
Figure 9.1: The Key Environmental I
- Page 144 and 145:
(iv)(v)(vi)plants, and other non-ti
- Page 146 and 147:
environmental governance can be bet
- Page 148 and 149: can vary considerably. Both sides h
- Page 150 and 151: Dhungel, D.N., and A.B. Rajbhandari
- Page 152 and 153: Table A9.1.2: Industry-Specific Tol
- Page 154 and 155: . Cultural Heritage8. Convention fo
- Page 156 and 157: Appendix 9.3: Some Prominent Enviro
- Page 158 and 159: Some funding arrangements made by t
- Page 160 and 161: (NARDF 2004) for a period of 1 to 3
- Page 162 and 163: Table 10.2: Annual Income and Expen
- Page 164 and 165: Table 10.4: Users’ Share in Benef
- Page 166 and 167: From Hands Around Everest bookFrom
- Page 168 and 169: Table 10.8: Subsidy Rate for Biogas
- Page 170 and 171: microorganism communities and the n
- Page 172 and 173: subsidies (Mason 1996). All these a
- Page 174 and 175: addressed only part of the problem.
- Page 176 and 177: historical practice of community-ma
- Page 178 and 179: moved or relocated. The fact that s
- Page 180 and 181: Kathmandu Valley and receives a lar
- Page 182 and 183: cooperative ventures provided neith
- Page 184 and 185: further poaching has not been repor
- Page 186 and 187: http://www.pugwash.org/reports/pac/
- Page 188 and 189: United Nations. 2003. World Populat
- Page 190 and 191: how other countries with substantia
- Page 192 and 193: (i) Broad-based and sustainable eco
- Page 194 and 195: Although progress is encouraging, m
- Page 196 and 197: Nepal’s Changing Pattern of Trade
- Page 200 and 201: Table 12.5: Percentage Share of Maj
- Page 202 and 203: well as other provisions in specifi
- Page 204 and 205: Future Implications for NepalIncrea
- Page 206 and 207: International Trade Forum (ITN). 20
- Page 208 and 209: - Gross domestic product per unit e
- Page 210 and 211: Time Series InformationGenerally tw
- Page 212 and 213: Table 13.1a: Different Datasets Col
- Page 214 and 215: elevant due to its multidisciplinar
- Page 216 and 217: Figure 13.6: Examples of Applicatio
- Page 218 and 219: Judith DobmannThere are many source
- Page 220 and 221: ———.2003. Mapping Nepal Censu
- Page 222 and 223: sustainable livelihoods requires an
- Page 224 and 225: and haphazard. Population pressures
- Page 226 and 227: issue. These deficiencies stem from
- Page 228 and 229: population must be assessed. MOEST
- Page 230 and 231: Appendix 14.1: List of Key Environm
- Page 232 and 233: (vii) The EIA report approving agen
- Page 234 and 235: Goal 1: Eradicate extreme poverty a
- Page 236 and 237: Nepal’s Progress Towards the MDGs
- Page 238 and 239: Goal 4: Reduce child mortalityReduc