

ADB_book_18 April.qxp - Himalayan Document Centre - icimod
ADB_book_18 April.qxp - Himalayan Document Centre - icimod
ADB_book_18 April.qxp - Himalayan Document Centre - icimod
- No tags were found...

You also want an ePaper? Increase the reach of your titles
YUMPU automatically turns print PDFs into web optimized ePapers that Google loves.
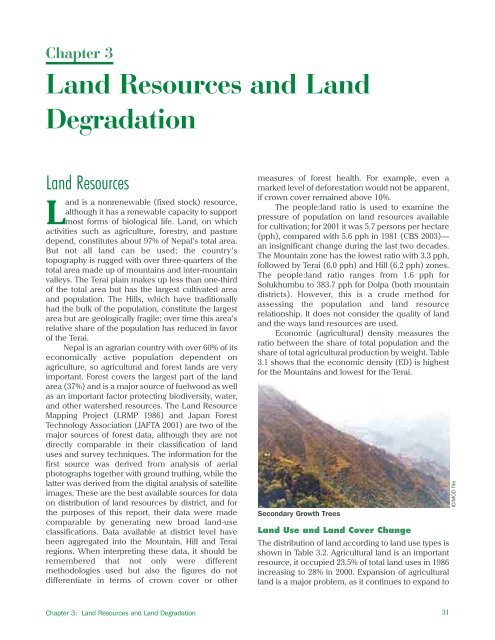
Chapter 3Land Resources and LandDegradationLand ResourcesLand is a nonrenewable (fixed stock) resource,although it has a renewable capacity to supportmost forms of biological life. Land, on whichactivities such as agriculture, forestry, and pasturedepend, constitutes about 97% of Nepal’s total area.But not all land can be used; the country’stopography is rugged with over three-quarters of thetotal area made up of mountains and inter-mountainvalleys. The Terai plain makes up less than one-thirdof the total area but has the largest cultivated areaand population. The Hills, which have traditionallyhad the bulk of the population, constitute the largestarea but are geologically fragile; over time this area’srelative share of the population has reduced in favorof the Terai.Nepal is an agrarian country with over 60% of itseconomically active population dependent onagriculture, so agricultural and forest lands are veryimportant. Forest covers the largest part of the landarea (37%) and is a major source of fuelwood as wellas an important factor protecting biodiversity, water,and other watershed resources. The Land ResourceMapping Project (LRMP 1986) and Japan ForestTechnology Association (JAFTA 2001) are two of themajor sources of forest data, although they are notdirectly comparable in their classification of landuses and survey techniques. The information for thefirst source was derived from analysis of aerialphotographs together with ground truthing, while thelatter was derived from the digital analysis of satelliteimages. These are the best available sources for dataon distribution of land resources by district, and forthe purposes of this report, their data were madecomparable by generating new broad land-useclassifications. Data available at district level havebeen aggregated into the Mountain, Hill and Terairegions. When interpreting these data, it should beremembered that not only were differentmethodologies used but also the figures do notdifferentiate in terms of crown cover or othermeasures of forest health. For example, even amarked level of deforestation would not be apparent,if crown cover remained above 10%.The people:land ratio is used to examine thepressure of population on land resources availablefor cultivation; for 2001 it was 5.7 persons per hectare(pph), compared with 5.6 pph in 1981 (CBS 2003)—an insignificant change during the last two decades.The Mountain zone has the lowest ratio with 3.3 pph,followed by Terai (6.0 pph) and Hill (6.2 pph) zones.The people:land ratio ranges from 1.6 pph forSolukhumbu to 383.7 pph for Dolpa (both mountaindistricts). However, this is a crude method forassessing the population and land resourcerelationship. It does not consider the quality of landand the ways land resources are used.Economic (agricultural) density measures theratio between the share of total population and theshare of total agricultural production by weight. Table3.1 shows that the economic density (ED) is highestfor the Mountains and lowest for the Terai.Secondary Growth TreesLand Use and Land Cover ChangeThe distribution of land according to land use types isshown in Table 3.2. Agricultural land is an importantresource, it occupied 23.5% of total land uses in 1986increasing to 28% in 2000. Expansion of agriculturalland is a major problem, as it continues to expand toICIMOD fileChapter 3: Land Resources and Land Degradation31


