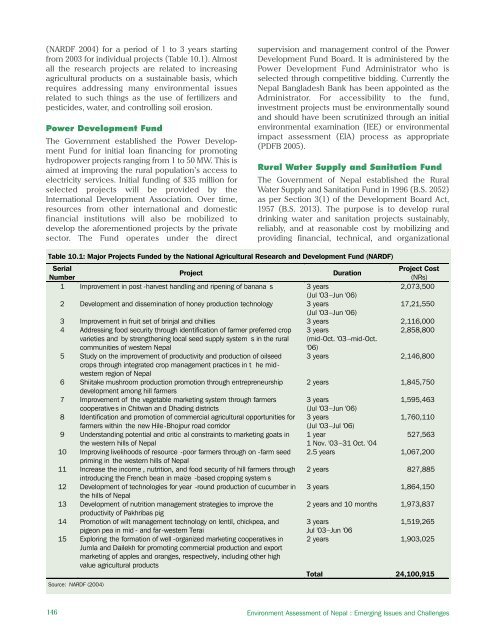
(NARDF 2004) for a period of 1 to 3 years startingfrom 2003 for individual projects (Table 10.1). Almostall the research projects are related to increasingagricultural products on a sustainable basis, whichrequires addressing many environmental issuesrelated to such things as the use of fertilizers andpesticides, water, and controlling soil erosion.Power Development FundThe Government established the Power DevelopmentFund for initial loan financing for promotinghydropower projects ranging from 1 to 50 MW. This isaimed at improving the rural population’s access toelectricity services. Initial funding of $35 million forselected projects will be provided by theInternational Development Association. Over time,resources from other international and domesticfinancial institutions will also be mobilized todevelop the aforementioned projects by the privatesector. The Fund operates under the directsupervision and management control of the PowerDevelopment Fund Board. It is administered by thePower Development Fund Administrator who isselected through competitive bidding. Currently theNepal Bangladesh Bank has been appointed as theAdministrator. For accessibility to the fund,investment projects must be environmentally soundand should have been scrutinized through an initialenvironmental examination (IEE) or environmentalimpact assessment (EIA) process as appropriate(PDFB 2005).Rural Water Supply and Sanitation FundThe Government of Nepal established the RuralWater Supply and Sanitation Fund in 1996 (B.S. 2052)as per Section 3(1) of the Development Board Act,1957 (B.S. 2013). The purpose is to develop ruraldrinking water and sanitation projects sustainably,reliably, and at reasonable cost by mobilizing andproviding financial, technical, and organizationalTable 10.1: Major Projects Funded by the National Agricultural Research and Development Fund (NARDF)SerialProject CostProjectDurationNumber(NRs)1 Improvement in post -harvest handling and ripening of banana s 3 years2,073,500(Jul '03–Jun '06)2 Development and dissemination of honey production technology 3 years17,21,550(Jul '03–Jun '06)3 Improvement in fruit set of brinjal and chillies 3 years 2,116,0004 Addressing food security through identification of farmer preferred crop 3 years2,858,800varieties and by strengthening local seed supply system s in the ruralcommunities of western Nepal(mid-Oct. '03–mid-Oct.'06)5 Study on the improvement of productivity and production of oilseed 3 years 2,146,800crops through integrated crop management practices in t he midwesternregion of Nepal6 Shiitake mushroom production promotion through entrepreneurship 2 years 1,845,750development among hill farmers7 Improvement of the vegetable marketing system through farmers 3 years1,595,463cooperative s in Chitwan an d Dhading districts(Jul '03–Jun '06)8 Identification and promotion of commercial agricultural opportunities for 3 years1,760,110farmers within the new Hile-Bhojpur road corridor(Jul '03–Jul '06)9 Understanding potential and critic al constraints to marketing goats in 1 year527,563the western hills of Nepal1 Nov. '03–31 Oct. '0410 Improving livelihoods of resource -poor farmers through on -farm seed 2.5 years 1,067,200priming in the western hills of Nepal11 Increase the income , nutrition, and food security of hill farmers through 2 years 827,885introducing the French bean in maize -based cropping system s12 Development of technologies for year -round production of cucumber in 3 years 1,864,150the hills of Nepal13 Development of nutrition management strategies to improve the 2 years and 10 months 1,973,837productivity of Pakhribas pig14 Promotion of wilt management technology on lentil, chickpea, and 3 years1,519,265pigeon pea in mid - and far-western Terai15 Exploring the formation of well -organized marketing cooperatives inJumla and Dailekh for promoting commercial production and exportmarketing of apples and oranges, respectively, including other highvalue agricultural productsSource: NARDF (2004)Jul '03–Jun '062 years 1,903,025Total 24,100,915146 Environment Assessment of Nepal : Emerging Issues and Challenges
support to consumer groups and cooperatingagencies. This fund is administered by the RuralWater Supply and Sanitation Fund DevelopmentBoard established on 14 March 1996. It promotessustainable and cost effective demand-led ruralwater supply and sanitation services in partnershipwith NGOs and private organizations, with fullemphasis on community ownership in conformitywith the Government’s Eighth Plan (1992–1997),Ninth Plan (1997–2002), and Tenth Plan (2002–2007)policies.The Ministry of Physical Planning and Works isthe line ministry for the Board. The Board is designedbased on the experience of a field testing pilotproject, JAKPAS (the Nepali acronym of Janata KoKhanepani Ra Sarsafai Karyakram, meaning People’sWater Supply and Sanitation Programme). The Fundis supported by the United Nations DevelopmentProgramme and a grant from the Japanese GrantFacility. The World Bank executed a pilot project forthree years during 1993–1996, financed by twoadditional Japanese Grant Facility grants. The Boardhas completed its First Phase (1996–2003)successfully and entered into the Second Phase(2004–2009) to support rural communities onimplementing water supply and sanitation schemes.The Board is being funded by the World Bank,International Development Association, and DFID.The Board has full operational autonomy and issupervised and managed by seven members.The Board has adopted a demand-ledparticipatory approach for increasing communitycapacity to sustain the project; enhancement of therole of women in all aspects of the project; andintegration of hygiene and sanitation education withtechnically, environmentally, and operationallysustainable water supply.Nepal has gained experience in managing thisfund. It has been operated to supply additionaldrinking water and sanitation facilities to the ruralpoor. This fund also has direct input in improvinghealth and sanitation conditions and reducing theenvironmental health problems that rural peopleface.Funds Generated by Community-basedOrganizationsThere are different types of community-basedorganizations involved in natural resourcemanagement activities. Community forestryprograms were launched by the Government ofNepal as early as 1978. They have been implementedmore vigorously since promulgation of the Forest Actin 1993. Community forest user groups (CFUGs) havebeen involved in the development, conservation, andsustainable use of forest resources. The Forest Act1993 empowers the CFUGs to generate funds fromcommunity forests and utilize them for communitydevelopment. However, the CFUGs have to invest atleast 25% of the total income in forest managementand development. The total income of CFUGsincludes income from the sale of forest products andother sources. About 90% of the total income in theHills is from the sale of forest products (Table 10.2).Most of the income has been spent forcommunity development activities, in particularinfrastructure development (MOFSC 1993). TheCFUGs are spending about 30% on forestry activitiessuch as forest watchers and silvicultural operations.Community forestry has become one of the majorsources of income in rural Nepal, and this incomehas been instrumental in enhancing communitydevelopment activities.Another important source of income for naturalresource management and community developmentis from the protected areas, which cover about <strong>18</strong>%of the total area of the country and have generatedsubstantial revenue through ecotourism activities.The National Parks and Wildlife Conservation Act1973 in its fourth amendment in 1993 provides that 30to 50% of the total revenue generated in the nationalparks and wildlife reserves be used for buffer zonemanagement and community developmentactivities. In accordance with this Act and BufferZone Management Regulations 1996 (MOFSC 1996),the Government has declared buffer zones for 6national parks and 2 wildlife reserves. The bufferzone area totals nearly 4,300 km 2 out of the country’stotal land area of 147,000 km 2 .The Buffer Zone Management Regulations 1996authorizes collection of resources for communitydevelopment, particularly in buffer zone areas. Theprotected areas are divided into national parks, andwildlife reserves and conservation areas. The sourceof revenue is the tourist flow in the protected areas.The national parks are generating more income thanthe wildlife reserves, hunting reserves, andconservation areas (Figure 10.4). Regardingconservation areas, the Government only managesand collects revenue from the KanchenjungaConservation Area, while the Annapurna andManaslu Conservation Areas are managed by theKing Mahendra Trust for Nature Conservation(KMTNC). The amount shown in Figure 10.4 onlyreflects the Government’s revenue.Buffer zone users are using the funds receivedfor a number of community development activities,including community forestry development, conservation,and management; riverbank protection andcompensation to affected families from riverbankcutting; community plantation and conservation;nursery establishment and sapling distribution;Chapter 10: Environmental Financing147
- Page 2 and 3:
About the OrganisationsAsian Develo
- Page 4 and 5:
© 2006 International Centre for In
- Page 6 and 7:
AcknowledgementsWe would like to ex
- Page 8 and 9:
PM2.5PAHRSSAARCSACEPSEASO 2TSPUKUND
- Page 10 and 11:
Chapter 6: Energy Resources 65Intro
- Page 12 and 13:
List of FiguresFigure 2.1: People a
- Page 14 and 15:
Table 6.1: Energy Consumption and P
- Page 16 and 17:
forests are also used for infrastru
- Page 18 and 19:
as data gathered by different agenc
- Page 20 and 21:
Table 2.1: Population Growth Rates
- Page 22 and 23:
mortality rates for rural and urban
- Page 24 and 25:
Agglomeration village in the centra
- Page 26 and 27:
soil erosion, and depletion of wate
- Page 30 and 31:
provision remains inadequate becaus
- Page 32 and 33:
Malnutrition remains a serious obst
- Page 34 and 35:
Table 2.24: Existing and Projected
- Page 36 and 37:
Table 2.28: Income Poverty Indicato
- Page 38 and 39:
Table 2.31: Change in Employment St
- Page 40 and 41:
In 2004, the average annual househo
- Page 42 and 43:
Mountain areas have the most food i
- Page 44 and 45:
Schaffner, U. 1987. “Road Constru
- Page 46 and 47:
Table 3.1: Agricultural Economic De
- Page 48 and 49:
Table 3.4: Estimated Soil Erosion R
- Page 50 and 51:
B. PradhanImpacts of land degradati
- Page 52 and 53:
Carson, B. 1985. “Erosion and Sed
- Page 54 and 55:
The trend of forest coverage in the
- Page 56 and 57:
BiodiversityState of BiodiversityNe
- Page 58 and 59:
The Government has given legal prot
- Page 60 and 61:
Different ways of maintaining biodi
- Page 62 and 63:
———.2004. State of the Enviro
- Page 64 and 65:
Appendix 4.1: Table continuedMajor
- Page 66 and 67:
Appendix 4.2: Protected Plant and W
- Page 68 and 69:
Table A4.2.3: Nepal's Share in Plan
- Page 70 and 71:
to intense weathering, and percolat
- Page 72 and 73:
Table 5.5: Water Supply and Water T
- Page 74 and 75:
Table 5.9: Water Quality of Shallow
- Page 76 and 77:
species are reported to be endanger
- Page 78 and 79:
Ministry of Water Resources (MOWR).
- Page 80 and 81:
Definition, Forms, and UnitsEnergy
- Page 82 and 83:
Table 6.5: Hydropower PotentialRive
- Page 84 and 85:
Chilime Hydroelectric Project: An E
- Page 86 and 87:
load occurs from 6 pm to 9 pm with
- Page 88 and 89:
assessment of wind energy and lack
- Page 90 and 91:
Review of Dams and Development by t
- Page 92 and 93:
IUCNElizabeth Khaka, UNEP-NairobiRu
- Page 94 and 95:
therefore reflect the three guiding
- Page 96 and 97:
is a seasonal dust storm. Anthropog
- Page 98 and 99:
Figure 7.3: Average Air Quality, Ja
- Page 100 and 101:
matter, hydrocarbons, and NO x (Nae
- Page 102 and 103:
Figure: 7.9: Vehicle Registered in
- Page 104 and 105:
Brick Kilnchlorofluorocarbons (HCFC
- Page 106 and 107:
Climate ChangeA region’s climate
- Page 108 and 109:
Figure 7.14: Mean Annual Precipitat
- Page 110 and 111: Table 7.3: National Ambient Air Qua
- Page 112 and 113: India. Available: http://www.cleana
- Page 114 and 115: ———.1999. “Ambient Air Qual
- Page 116 and 117: Appendix 7.1: World Health Organiza
- Page 118 and 119: Table 8.1: Criteria for Urban Statu
- Page 120 and 121: accommodate the rapidly increasing
- Page 122 and 123: managing solid waste. They are part
- Page 124 and 125: In most municipalities, hazardous w
- Page 126 and 127: in worsening public health conditio
- Page 128 and 129: objects of archaeological, historic
- Page 130 and 131: Min BajracharyaB. PradhanVehicles a
- Page 132 and 133: Department of Health Services (DOHS
- Page 134 and 135: Table 9.1 describes the major highl
- Page 136 and 137: the period to up 2017. The document
- Page 138 and 139: earthquakes; and awareness raising
- Page 140 and 141: Sub-regional LinkagesOther developi
- Page 142 and 143: Figure 9.1: The Key Environmental I
- Page 144 and 145: (iv)(v)(vi)plants, and other non-ti
- Page 146 and 147: environmental governance can be bet
- Page 148 and 149: can vary considerably. Both sides h
- Page 150 and 151: Dhungel, D.N., and A.B. Rajbhandari
- Page 152 and 153: Table A9.1.2: Industry-Specific Tol
- Page 154 and 155: . Cultural Heritage8. Convention fo
- Page 156 and 157: Appendix 9.3: Some Prominent Enviro
- Page 158 and 159: Some funding arrangements made by t
- Page 162 and 163: Table 10.2: Annual Income and Expen
- Page 164 and 165: Table 10.4: Users’ Share in Benef
- Page 166 and 167: From Hands Around Everest bookFrom
- Page 168 and 169: Table 10.8: Subsidy Rate for Biogas
- Page 170 and 171: microorganism communities and the n
- Page 172 and 173: subsidies (Mason 1996). All these a
- Page 174 and 175: addressed only part of the problem.
- Page 176 and 177: historical practice of community-ma
- Page 178 and 179: moved or relocated. The fact that s
- Page 180 and 181: Kathmandu Valley and receives a lar
- Page 182 and 183: cooperative ventures provided neith
- Page 184 and 185: further poaching has not been repor
- Page 186 and 187: http://www.pugwash.org/reports/pac/
- Page 188 and 189: United Nations. 2003. World Populat
- Page 190 and 191: how other countries with substantia
- Page 192 and 193: (i) Broad-based and sustainable eco
- Page 194 and 195: Although progress is encouraging, m
- Page 196 and 197: Nepal’s Changing Pattern of Trade
- Page 198 and 199: Table 12.2: Trade/ GDP RatiosFY1981
- Page 200 and 201: Table 12.5: Percentage Share of Maj
- Page 202 and 203: well as other provisions in specifi
- Page 204 and 205: Future Implications for NepalIncrea
- Page 206 and 207: International Trade Forum (ITN). 20
- Page 208 and 209: - Gross domestic product per unit e
- Page 210 and 211:
Time Series InformationGenerally tw
- Page 212 and 213:
Table 13.1a: Different Datasets Col
- Page 214 and 215:
elevant due to its multidisciplinar
- Page 216 and 217:
Figure 13.6: Examples of Applicatio
- Page 218 and 219:
Judith DobmannThere are many source
- Page 220 and 221:
———.2003. Mapping Nepal Censu
- Page 222 and 223:
sustainable livelihoods requires an
- Page 224 and 225:
and haphazard. Population pressures
- Page 226 and 227:
issue. These deficiencies stem from
- Page 228 and 229:
population must be assessed. MOEST
- Page 230 and 231:
Appendix 14.1: List of Key Environm
- Page 232 and 233:
(vii) The EIA report approving agen
- Page 234 and 235:
Goal 1: Eradicate extreme poverty a
- Page 236 and 237:
Nepal’s Progress Towards the MDGs
- Page 238 and 239:
Goal 4: Reduce child mortalityReduc