Table 6.5: Hydropower PotentialRiver BasinTheoreticalPotentialEconomicallyFeasibleGW % GW %Sapta Koshi 22.35 27 10.86 26Sapta Gandaki(Narayani)20.65 25 5.27 13Karnali and Mahakali 36.<strong>18</strong> 43 25.10 60Southern Rivers 4.11 5 0.88 2Total 83.29 100 42.13 100GW = giga wattSource: WECS (1995); USAID -SARI (2002)Table 6.6: Summary of Hydroelectric DevelopmentOpportunitiesCategoryNumber ofProjectsIdentifiedTotalCapacity(MW)TotalGenerationPotential(GWh/y)10–100 MW(medium)157 6,200 38,000100–300 MW(medium)47 7,815 42,056300–1,000MW (large)20 9,437 45,723> 1,000 MW(large)5 19,463 50,985Total 229 42,915 176,764GWh/y = gigawatt -hour per year , MW = megawattSource: WECS (2002)contribution of hydroelectricity to the overall energyproduction has so far been very small—only about1% of the total energy need is met by hydropower.Power produced by the hydroelectric plantsconnected to the national grid mainly supplyelectricity to urban areas and their peripheries. At theend of the Ninth Plan (1997–2002), the national gridsupplied electricity to an estimated 33% of Nepal’spopulation, and an additional 7% had access toelectricity generated from alternative energy sourceslike micro-hydro and solar (NPC 2002). A large part ofthe rural population is deprived of electricity.Some of the factors contributing to the low levelof hydropower development are lack ofinfrastructure and capital, high cost of technology,political instability, lower load factor due to lowproductive end-use of electricity, and high technicaland non-technical losses. Despite its huge potentialand acknowledged importance in nationaldevelopment, hydropower development has beenlacking. The main concerns related to hydropowerdevelopment in Nepal include the following.High TariffNepal’s electricity tariff is comparatively high. In2004, the average tariff in Nepal was NRs 6.7 perkilowatt-hour (kWh) ($0.091 per kWh), among thehighest in the developing countries of Asia. Themarginal rate for domestic energy consumptionabove 250 kWh/month is NRs 9.9 per kWh (US$0.134cents per kWh), which is equivalent to or higher thanthe tariff in many developed countries (NEA 2005).The reasons for the high tariff include highproduction costs, high transmission and distributionlosses due to technical losses and theft, inefficiencyin management, and non-payment (or payment inarrears) from public sector customers. Further, theNepal Electricity Authority (NEA) has beenpurchasing power from independent powerproducers at rates higher than its own currentaverage cost of production. Power purchaseagreements between independent power producersand NEA are on a ‘’take or pay” basis that requiresNEA to pay for all energy produced in all seasonswhether it is utilized or not, and the power purchaseagreements are based on US dollar rates. The tariff ischarged based on cost of production and with theintention of recovering costs, although Nepalreceived significant foreign finance as soft loans andgrants. All of these factors result in high tariffs.The cost of hydropower development in Nepalis high (typically NRs 5 per KWh for run-of-riverplants), which is generally attributed to the fragile,unstable geology of hydropower sites (as well asremoteness of the sites which require building costlyroads and infrastructure for access as part of theproject cost), limited manufacturing capabilityrelated to hydropower plants (or grant or loanconditions tied to purchasing equipment from thecountry providing the grant), extensive employmentof high-cost international contractors andconsultants, and heavy reliance on bilateral andmultilateral financing(WECS 2002, WECS 2004,USAID-SARI, 2002).Slow DevelopmentAlthough the first hydroelectric power plant in thecountry was established in 1911 at Pharping, by 2003Nepal’s total installed capacity had reached only 546MW (about 1.3% of the feasible potential), whichincludes 144 MW hydropower produced by the eightindependent power producers. In addition tohydropower, six thermal power plants owned by theNEA produce 57 MW. Thus total installed capacity inthe country available in the integrated nationalpower system is 603 MW.NEA’s monopoly until 1992 is cited as a reasonfor the slow development of hydropower in Nepal.Recent policies adopted following restoration of themultiparty system allow private sector developmentof hydropower, and since then several projects havebeen constructed by domestic and international68 Environment Assessment of Nepal : Emerging Issues and Challenges
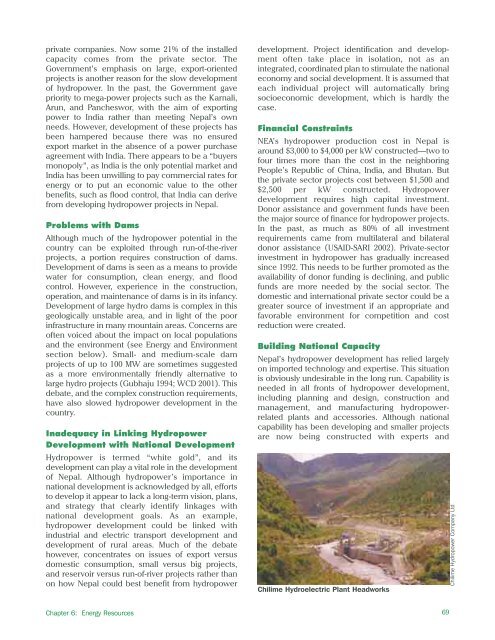
private companies. Now some 21% of the installedcapacity comes from the private sector. TheGovernment’s emphasis on large, export-orientedprojects is another reason for the slow developmentof hydropower. In the past, the Government gavepriority to mega-power projects such as the Karnali,Arun, and Pancheswor, with the aim of exportingpower to India rather than meeting Nepal’s ownneeds. However, development of these projects hasbeen hampered because there was no ensuredexport market in the absence of a power purchaseagreement with India. There appears to be a “buyersmonopoly”, as India is the only potential market andIndia has been unwilling to pay commercial rates forenergy or to put an economic value to the otherbenefits, such as flood control, that India can derivefrom developing hydropower projects in Nepal.Problems with DamsAlthough much of the hydropower potential in thecountry can be exploited through run-of-the-riverprojects, a portion requires construction of dams.Development of dams is seen as a means to providewater for consumption, clean energy, and floodcontrol. However, experience in the construction,operation, and maintenance of dams is in its infancy.Development of large hydro dams is complex in thisgeologically unstable area, and in light of the poorinfrastructure in many mountain areas. Concerns areoften voiced about the impact on local populationsand the environment (see Energy and Environmentsection below). Small- and medium-scale damprojects of up to 100 MW are sometimes suggestedas a more environmentally friendly alternative tolarge hydro projects (Gubhaju 1994; WCD 2001). Thisdebate, and the complex construction requirements,have also slowed hydropower development in thecountry.Inadequacy in Linking HydropowerDevelopment with National DevelopmentHydropower is termed “white gold”, and itsdevelopment can play a vital role in the developmentof Nepal. Although hydropower’s importance innational development is acknowledged by all, effortsto develop it appear to lack a long-term vision, plans,and strategy that clearly identify linkages withnational development goals. As an example,hydropower development could be linked withindustrial and electric transport development anddevelopment of rural areas. Much of the debatehowever, concentrates on issues of export versusdomestic consumption, small versus big projects,and reservoir versus run-of-river projects rather thanon how Nepal could best benefit from hydropowerdevelopment. Project identification and developmentoften take place in isolation, not as anintegrated, coordinated plan to stimulate the nationaleconomy and social development. It is assumed thateach individual project will automatically bringsocioeconomic development, which is hardly thecase.Financial ConstraintsNEA’s hydropower production cost in Nepal isaround $3,000 to $4,000 per kW constructed—two tofour times more than the cost in the neighboringPeople’s Republic of China, India, and Bhutan. Butthe private sector projects cost between $1,500 and$2,500 per kW constructed. Hydropowerdevelopment requires high capital investment.Donor assistance and government funds have beenthe major source of finance for hydropower projects.In the past, as much as 80% of all investmentrequirements came from multilateral and bilateraldonor assistance (USAID-SARI 2002). Private-sectorinvestment in hydropower has gradually increasedsince 1992. This needs to be further promoted as theavailability of donor funding is declining, and publicfunds are more needed by the social sector. Thedomestic and international private sector could be agreater source of investment if an appropriate andfavorable environment for competition and costreduction were created.Building National CapacityNepal’s hydropower development has relied largelyon imported technology and expertise. This situationis obviously undesirable in the long run. Capability isneeded in all fronts of hydropower development,including planning and design, construction andmanagement, and manufacturing hydropowerrelatedplants and accessories. Although nationalcapability has been developing and smaller projectsare now being constructed with experts andChilime Hydroelectric Plant HeadworksChilime Hydropower Company LtdChapter 6: Energy Resources69
- Page 2 and 3:
About the OrganisationsAsian Develo
- Page 4 and 5:
© 2006 International Centre for In
- Page 6 and 7:
AcknowledgementsWe would like to ex
- Page 8 and 9:
PM2.5PAHRSSAARCSACEPSEASO 2TSPUKUND
- Page 10 and 11:
Chapter 6: Energy Resources 65Intro
- Page 12 and 13:
List of FiguresFigure 2.1: People a
- Page 14 and 15:
Table 6.1: Energy Consumption and P
- Page 16 and 17:
forests are also used for infrastru
- Page 18 and 19:
as data gathered by different agenc
- Page 20 and 21:
Table 2.1: Population Growth Rates
- Page 22 and 23:
mortality rates for rural and urban
- Page 24 and 25:
Agglomeration village in the centra
- Page 26 and 27:
soil erosion, and depletion of wate
- Page 30 and 31:
provision remains inadequate becaus
- Page 32 and 33: Malnutrition remains a serious obst
- Page 34 and 35: Table 2.24: Existing and Projected
- Page 36 and 37: Table 2.28: Income Poverty Indicato
- Page 38 and 39: Table 2.31: Change in Employment St
- Page 40 and 41: In 2004, the average annual househo
- Page 42 and 43: Mountain areas have the most food i
- Page 44 and 45: Schaffner, U. 1987. “Road Constru
- Page 46 and 47: Table 3.1: Agricultural Economic De
- Page 48 and 49: Table 3.4: Estimated Soil Erosion R
- Page 50 and 51: B. PradhanImpacts of land degradati
- Page 52 and 53: Carson, B. 1985. “Erosion and Sed
- Page 54 and 55: The trend of forest coverage in the
- Page 56 and 57: BiodiversityState of BiodiversityNe
- Page 58 and 59: The Government has given legal prot
- Page 60 and 61: Different ways of maintaining biodi
- Page 62 and 63: ———.2004. State of the Enviro
- Page 64 and 65: Appendix 4.1: Table continuedMajor
- Page 66 and 67: Appendix 4.2: Protected Plant and W
- Page 68 and 69: Table A4.2.3: Nepal's Share in Plan
- Page 70 and 71: to intense weathering, and percolat
- Page 72 and 73: Table 5.5: Water Supply and Water T
- Page 74 and 75: Table 5.9: Water Quality of Shallow
- Page 76 and 77: species are reported to be endanger
- Page 78 and 79: Ministry of Water Resources (MOWR).
- Page 80 and 81: Definition, Forms, and UnitsEnergy
- Page 84 and 85: Chilime Hydroelectric Project: An E
- Page 86 and 87: load occurs from 6 pm to 9 pm with
- Page 88 and 89: assessment of wind energy and lack
- Page 90 and 91: Review of Dams and Development by t
- Page 92 and 93: IUCNElizabeth Khaka, UNEP-NairobiRu
- Page 94 and 95: therefore reflect the three guiding
- Page 96 and 97: is a seasonal dust storm. Anthropog
- Page 98 and 99: Figure 7.3: Average Air Quality, Ja
- Page 100 and 101: matter, hydrocarbons, and NO x (Nae
- Page 102 and 103: Figure: 7.9: Vehicle Registered in
- Page 104 and 105: Brick Kilnchlorofluorocarbons (HCFC
- Page 106 and 107: Climate ChangeA region’s climate
- Page 108 and 109: Figure 7.14: Mean Annual Precipitat
- Page 110 and 111: Table 7.3: National Ambient Air Qua
- Page 112 and 113: India. Available: http://www.cleana
- Page 114 and 115: ———.1999. “Ambient Air Qual
- Page 116 and 117: Appendix 7.1: World Health Organiza
- Page 118 and 119: Table 8.1: Criteria for Urban Statu
- Page 120 and 121: accommodate the rapidly increasing
- Page 122 and 123: managing solid waste. They are part
- Page 124 and 125: In most municipalities, hazardous w
- Page 126 and 127: in worsening public health conditio
- Page 128 and 129: objects of archaeological, historic
- Page 130 and 131: Min BajracharyaB. PradhanVehicles a
- Page 132 and 133:
Department of Health Services (DOHS
- Page 134 and 135:
Table 9.1 describes the major highl
- Page 136 and 137:
the period to up 2017. The document
- Page 138 and 139:
earthquakes; and awareness raising
- Page 140 and 141:
Sub-regional LinkagesOther developi
- Page 142 and 143:
Figure 9.1: The Key Environmental I
- Page 144 and 145:
(iv)(v)(vi)plants, and other non-ti
- Page 146 and 147:
environmental governance can be bet
- Page 148 and 149:
can vary considerably. Both sides h
- Page 150 and 151:
Dhungel, D.N., and A.B. Rajbhandari
- Page 152 and 153:
Table A9.1.2: Industry-Specific Tol
- Page 154 and 155:
. Cultural Heritage8. Convention fo
- Page 156 and 157:
Appendix 9.3: Some Prominent Enviro
- Page 158 and 159:
Some funding arrangements made by t
- Page 160 and 161:
(NARDF 2004) for a period of 1 to 3
- Page 162 and 163:
Table 10.2: Annual Income and Expen
- Page 164 and 165:
Table 10.4: Users’ Share in Benef
- Page 166 and 167:
From Hands Around Everest bookFrom
- Page 168 and 169:
Table 10.8: Subsidy Rate for Biogas
- Page 170 and 171:
microorganism communities and the n
- Page 172 and 173:
subsidies (Mason 1996). All these a
- Page 174 and 175:
addressed only part of the problem.
- Page 176 and 177:
historical practice of community-ma
- Page 178 and 179:
moved or relocated. The fact that s
- Page 180 and 181:
Kathmandu Valley and receives a lar
- Page 182 and 183:
cooperative ventures provided neith
- Page 184 and 185:
further poaching has not been repor
- Page 186 and 187:
http://www.pugwash.org/reports/pac/
- Page 188 and 189:
United Nations. 2003. World Populat
- Page 190 and 191:
how other countries with substantia
- Page 192 and 193:
(i) Broad-based and sustainable eco
- Page 194 and 195:
Although progress is encouraging, m
- Page 196 and 197:
Nepal’s Changing Pattern of Trade
- Page 198 and 199:
Table 12.2: Trade/ GDP RatiosFY1981
- Page 200 and 201:
Table 12.5: Percentage Share of Maj
- Page 202 and 203:
well as other provisions in specifi
- Page 204 and 205:
Future Implications for NepalIncrea
- Page 206 and 207:
International Trade Forum (ITN). 20
- Page 208 and 209:
- Gross domestic product per unit e
- Page 210 and 211:
Time Series InformationGenerally tw
- Page 212 and 213:
Table 13.1a: Different Datasets Col
- Page 214 and 215:
elevant due to its multidisciplinar
- Page 216 and 217:
Figure 13.6: Examples of Applicatio
- Page 218 and 219:
Judith DobmannThere are many source
- Page 220 and 221:
———.2003. Mapping Nepal Censu
- Page 222 and 223:
sustainable livelihoods requires an
- Page 224 and 225:
and haphazard. Population pressures
- Page 226 and 227:
issue. These deficiencies stem from
- Page 228 and 229:
population must be assessed. MOEST
- Page 230 and 231:
Appendix 14.1: List of Key Environm
- Page 232 and 233:
(vii) The EIA report approving agen
- Page 234 and 235:
Goal 1: Eradicate extreme poverty a
- Page 236 and 237:
Nepal’s Progress Towards the MDGs
- Page 238 and 239:
Goal 4: Reduce child mortalityReduc