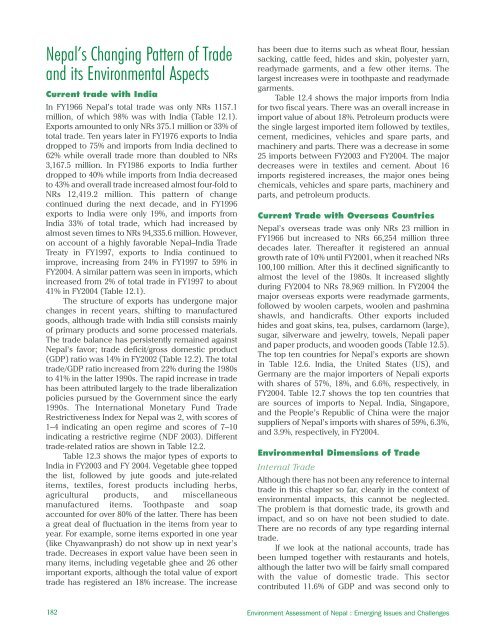
Nepal’s Changing Pattern of Tradeand its Environmental AspectsCurrent trade with IndiaIn FY1966 Nepal’s total trade was only NRs 1157.1million, of which 98% was with India (Table 12.1).Exports amounted to only NRs 375.1 million or 33% oftotal trade. Ten years later in FY1976 exports to Indiadropped to 75% and imports from India declined to62% while overall trade more than doubled to NRs3,167.5 million. In FY1986 exports to India furtherdropped to 40% while imports from India decreasedto 43% and overall trade increased almost four-fold toNRs 12,419.2 million. This pattern of changecontinued during the next decade, and in FY1996exports to India were only 19%, and imports fromIndia 33% of total trade, which had increased byalmost seven times to NRs 94,335.6 million. However,on account of a highly favorable Nepal–India TradeTreaty in FY1997, exports to India continued toimprove, increasing from 24% in FY1997 to 59% inFY2004. A similar pattern was seen in imports, whichincreased from 2% of total trade in FY1997 to about41% in FY2004 (Table 12.1).The structure of exports has undergone majorchanges in recent years, shifting to manufacturedgoods, although trade with India still consists mainlyof primary products and some processed materials.The trade balance has persistently remained againstNepal’s favor; trade deficit/gross domestic product(GDP) ratio was 14% in FY2002 (Table 12.2). The totaltrade/GDP ratio increased from 22% during the 1980sto 41% in the latter 1990s. The rapid increase in tradehas been attributed largely to the trade liberalizationpolicies pursued by the Government since the early1990s. The International Monetary Fund TradeRestrictiveness Index for Nepal was 2, with scores of1–4 indicating an open regime and scores of 7–10indicating a restrictive regime (NDF 2003). Differenttrade-related ratios are shown in Table 12.2.Table 12.3 shows the major types of exports toIndia in FY2003 and FY 2004. Vegetable ghee toppedthe list, followed by jute goods and jute-relateditems, textiles, forest products including herbs,agricultural products, and miscellaneousmanufactured items. Toothpaste and soapaccounted for over 80% of the latter. There has beena great deal of fluctuation in the items from year toyear. For example, some items exported in one year(like Chyawanprash) do not show up in next year’strade. Decreases in export value have been seen inmany items, including vegetable ghee and 26 otherimportant exports, although the total value of exporttrade has registered an <strong>18</strong>% increase. The increasehas been due to items such as wheat flour, hessiansacking, cattle feed, hides and skin, polyester yarn,readymade garments, and a few other items. Thelargest increases were in toothpaste and readymadegarments.Table 12.4 shows the major imports from Indiafor two fiscal years. There was an overall increase inimport value of about <strong>18</strong>%. Petroleum products werethe single largest imported item followed by textiles,cement, medicines, vehicles and spare parts, andmachinery and parts. There was a decrease in some25 imports between FY2003 and FY2004. The majordecreases were in textiles and cement. About 16imports registered increases, the major ones beingchemicals, vehicles and spare parts, machinery andparts, and petroleum products.Current Trade with Overseas CountriesNepal’s overseas trade was only NRs 23 million inFY1966 but increased to NRs 66,254 million threedecades later. Thereafter it registered an annualgrowth rate of 10% until FY2001, when it reached NRs100,100 million. After this it declined significantly toalmost the level of the 1980s. It increased slightlyduring FY2004 to NRs 78,969 million. In FY2004 themajor overseas exports were readymade garments,followed by woolen carpets, woolen and pashminashawls, and handicrafts. Other exports includedhides and goat skins, tea, pulses, cardamom (large),sugar, silverware and jewelry, towels, Nepali paperand paper products, and wooden goods (Table 12.5).The top ten countries for Nepal’s exports are shownin Table 12.6. India, the United States (US), andGermany are the major importers of Nepali exportswith shares of 57%, <strong>18</strong>%, and 6.6%, respectively, inFY2004. Table 12.7 shows the top ten countries thatare sources of imports to Nepal. India, Singapore,and the People’s Republic of China were the majorsuppliers of Nepal’s imports with shares of 59%, 6.3%,and 3.9%, respectively, in FY2004.Environmental Dimensions of TradeInternal TradeAlthough there has not been any reference to internaltrade in this chapter so far, clearly in the context ofenvironmental impacts, this cannot be neglected.The problem is that domestic trade, its growth andimpact, and so on have not been studied to date.There are no records of any type regarding internaltrade.If we look at the national accounts, trade hasbeen lumped together with restaurants and hotels,although the latter two will be fairly small comparedwith the value of domestic trade. This sectorcontributed 11.6% of GDP and was second only to<strong>18</strong>2 Environment Assessment of Nepal : Emerging Issues and Challenges
Table 12.1: Direction of Foreign Trade (NRs million)Item FY1966 FY1976 FY1986 FY1996 FY1997 FY1998Export (FoB) 375.1 1,<strong>18</strong>5.8 3,078.0 19,881.1 22,636.5 27,513.5India370.5 893.7 1,241.1 3,682.6 5,226.2 8,794.4(98.8) (75.4) (40.3) (<strong>18</strong>.5)(23.5) (32.0)Other countries4.6 292.1 1,836.9 16,198.5 17,410 <strong>18</strong>,719.1(1.2) (24.6) (59.7) (81.5)(76.9) (68.0)Imports (CIF) 782 1,981.7 9,341.2 74,454.5 93,553.4 89,002.0India763.5 1,227.1 3,970.9 24,398.6 24,853.3 27,331.0Other countries(97.6 )<strong>18</strong>.5(2.4)(61.9 )75.6(38.1)( 42.5)537.03(57.5 )(32.8)50,055.9(67.2)(26.6)68,700.1(69.3)(30.7)61,670(69.3)Trade balance -4,0619 -795.9 -6,263.2 -54,573.4 -7,016.9 -61,488.5India-393 -333.4 -2,729.8 -20,716.0 -19,627.1 -<strong>18</strong>,536.6(96.6) (41.9) (43.6) (38.0)(27.7) (30.1)Other countries-13.9 -462.5 -3,533.4 -33,857.4 -51,289.8 -42,951.9(3.4) (58.1) (56.4) (62.0)(72.3) (69.9)Total volume of trade 1,157.1 3,167.5 12,419.2 94,335.6 116,<strong>18</strong>9.9 116,515.5India1,134.0 2,120.8 5,212.0 28,081.2 30,079.5 36,125.4Other countries(98.0)23.1(2.0)(67.0)1,046.7(33.0)(42.0)7,207.2(58.0)(29.8)6,625.4(70.2)(25.9086,110.4(74.1)(31.0)80,390.1(69.0)Share exports/in total a 32.7 37.4 24.8 21.1 19.5 23.6Share imports/i n total a 67.3 62.6 75.2 78.9 80.5 76.4GDP (at factor cost / current price) 248,913 280,513 300,845Item FY1999 FY2000 FY2001 FY2002 FY2003 FY2004Export (FoB) 35,676.3 49,822.7 55,654.1 46,944.8 49,930.6 52,723.7India12,530.7 21,220.7 26,030.2 27,956.2 26,430.0 31,244.3(35.1) (42.6) (46.8) (59.6)(52.9) (59.3)Other countries23,145.6 28,602.0 29,623.9 <strong>18</strong>,988.6 23,500.6 21,479.4(64.9) (57.4) (53.2) (40.4)(47.1) (40.7)Imports (CIF) 87,523.3 108,504.9 115,687.2 107,389.0 124,352.1 139,142.3India32,119.7 39,660.1 45,211.0 56,622.1 70,924.2 81,651.9Other countries(36.7)55,405.6(63.3)(36.6)68,844.8(63.4 )(39.1)70,476.2(60.9)(52.7)50,766.9(47.3)(57.0)53,427.9(43.0)(58.7)57,490.4(41.3)Trade balance -51,849.0 -58,682.2 -60,033.1 -60,444.2 -74,421.5 -86,4<strong>18</strong>.6India-19,589.4 -<strong>18</strong>,439.4 -19,<strong>18</strong>0 -28,665.9 -44,494.2 -50,407.6(37.8) (31.4) (32) (47.4)(59.8) (58.3)Other countries32,260 -40,242.8 -40,852.3 -31,778.3 -29,927.3 36,011.0(62.2) (68.6) (68) (52.6)(40.2) (41.7)Total volume of trade 123,201.6 158,327.6 171,341.3 154,333.8 174,282.7 191,866India44,650.4 60,880.8 71,241.2 84,578.3 97,354.2 112,896.2Other countries(36.2)78,551.2(63.8)(38.5)97,446.8(61.5)(41.6)100,100.1(58.4)(54.8)69,755.5(45.2)(55.9)76,928.5(44.1)(58.8)78,969.8(41.2)Share exports/in total a 29.0 31.5 32.5 30.4 28.6 27.5Share imports/i n total a 71.0 68.5 67.5 69.6 71.4 72.5GDP (at factor cost / current price) 342,036 379,488 410,789 422,301 454,935 494,882CIF = cost insurance freight, FOB = freigh t on board, GDP = gross domestic productNote: values in brackets indicate percentages; the fiscal year (FY) of the Government of Nepal ends on 15 July. Fiscal Year before a calendar year denotes the yearwhich the fiscal year ends, e.g. FY2002 ends on 15 July 2002.Source: FNCCI (2004)inChapter 12: Environment and Trade<strong>18</strong>3
- Page 2 and 3:
About the OrganisationsAsian Develo
- Page 4 and 5:
© 2006 International Centre for In
- Page 6 and 7:
AcknowledgementsWe would like to ex
- Page 8 and 9:
PM2.5PAHRSSAARCSACEPSEASO 2TSPUKUND
- Page 10 and 11:
Chapter 6: Energy Resources 65Intro
- Page 12 and 13:
List of FiguresFigure 2.1: People a
- Page 14 and 15:
Table 6.1: Energy Consumption and P
- Page 16 and 17:
forests are also used for infrastru
- Page 18 and 19:
as data gathered by different agenc
- Page 20 and 21:
Table 2.1: Population Growth Rates
- Page 22 and 23:
mortality rates for rural and urban
- Page 24 and 25:
Agglomeration village in the centra
- Page 26 and 27:
soil erosion, and depletion of wate
- Page 30 and 31:
provision remains inadequate becaus
- Page 32 and 33:
Malnutrition remains a serious obst
- Page 34 and 35:
Table 2.24: Existing and Projected
- Page 36 and 37:
Table 2.28: Income Poverty Indicato
- Page 38 and 39:
Table 2.31: Change in Employment St
- Page 40 and 41:
In 2004, the average annual househo
- Page 42 and 43:
Mountain areas have the most food i
- Page 44 and 45:
Schaffner, U. 1987. “Road Constru
- Page 46 and 47:
Table 3.1: Agricultural Economic De
- Page 48 and 49:
Table 3.4: Estimated Soil Erosion R
- Page 50 and 51:
B. PradhanImpacts of land degradati
- Page 52 and 53:
Carson, B. 1985. “Erosion and Sed
- Page 54 and 55:
The trend of forest coverage in the
- Page 56 and 57:
BiodiversityState of BiodiversityNe
- Page 58 and 59:
The Government has given legal prot
- Page 60 and 61:
Different ways of maintaining biodi
- Page 62 and 63:
———.2004. State of the Enviro
- Page 64 and 65:
Appendix 4.1: Table continuedMajor
- Page 66 and 67:
Appendix 4.2: Protected Plant and W
- Page 68 and 69:
Table A4.2.3: Nepal's Share in Plan
- Page 70 and 71:
to intense weathering, and percolat
- Page 72 and 73:
Table 5.5: Water Supply and Water T
- Page 74 and 75:
Table 5.9: Water Quality of Shallow
- Page 76 and 77:
species are reported to be endanger
- Page 78 and 79:
Ministry of Water Resources (MOWR).
- Page 80 and 81:
Definition, Forms, and UnitsEnergy
- Page 82 and 83:
Table 6.5: Hydropower PotentialRive
- Page 84 and 85:
Chilime Hydroelectric Project: An E
- Page 86 and 87:
load occurs from 6 pm to 9 pm with
- Page 88 and 89:
assessment of wind energy and lack
- Page 90 and 91:
Review of Dams and Development by t
- Page 92 and 93:
IUCNElizabeth Khaka, UNEP-NairobiRu
- Page 94 and 95:
therefore reflect the three guiding
- Page 96 and 97:
is a seasonal dust storm. Anthropog
- Page 98 and 99:
Figure 7.3: Average Air Quality, Ja
- Page 100 and 101:
matter, hydrocarbons, and NO x (Nae
- Page 102 and 103:
Figure: 7.9: Vehicle Registered in
- Page 104 and 105:
Brick Kilnchlorofluorocarbons (HCFC
- Page 106 and 107:
Climate ChangeA region’s climate
- Page 108 and 109:
Figure 7.14: Mean Annual Precipitat
- Page 110 and 111:
Table 7.3: National Ambient Air Qua
- Page 112 and 113:
India. Available: http://www.cleana
- Page 114 and 115:
———.1999. “Ambient Air Qual
- Page 116 and 117:
Appendix 7.1: World Health Organiza
- Page 118 and 119:
Table 8.1: Criteria for Urban Statu
- Page 120 and 121:
accommodate the rapidly increasing
- Page 122 and 123:
managing solid waste. They are part
- Page 124 and 125:
In most municipalities, hazardous w
- Page 126 and 127:
in worsening public health conditio
- Page 128 and 129:
objects of archaeological, historic
- Page 130 and 131:
Min BajracharyaB. PradhanVehicles a
- Page 132 and 133:
Department of Health Services (DOHS
- Page 134 and 135:
Table 9.1 describes the major highl
- Page 136 and 137:
the period to up 2017. The document
- Page 138 and 139:
earthquakes; and awareness raising
- Page 140 and 141:
Sub-regional LinkagesOther developi
- Page 142 and 143:
Figure 9.1: The Key Environmental I
- Page 144 and 145:
(iv)(v)(vi)plants, and other non-ti
- Page 146 and 147: environmental governance can be bet
- Page 148 and 149: can vary considerably. Both sides h
- Page 150 and 151: Dhungel, D.N., and A.B. Rajbhandari
- Page 152 and 153: Table A9.1.2: Industry-Specific Tol
- Page 154 and 155: . Cultural Heritage8. Convention fo
- Page 156 and 157: Appendix 9.3: Some Prominent Enviro
- Page 158 and 159: Some funding arrangements made by t
- Page 160 and 161: (NARDF 2004) for a period of 1 to 3
- Page 162 and 163: Table 10.2: Annual Income and Expen
- Page 164 and 165: Table 10.4: Users’ Share in Benef
- Page 166 and 167: From Hands Around Everest bookFrom
- Page 168 and 169: Table 10.8: Subsidy Rate for Biogas
- Page 170 and 171: microorganism communities and the n
- Page 172 and 173: subsidies (Mason 1996). All these a
- Page 174 and 175: addressed only part of the problem.
- Page 176 and 177: historical practice of community-ma
- Page 178 and 179: moved or relocated. The fact that s
- Page 180 and 181: Kathmandu Valley and receives a lar
- Page 182 and 183: cooperative ventures provided neith
- Page 184 and 185: further poaching has not been repor
- Page 186 and 187: http://www.pugwash.org/reports/pac/
- Page 188 and 189: United Nations. 2003. World Populat
- Page 190 and 191: how other countries with substantia
- Page 192 and 193: (i) Broad-based and sustainable eco
- Page 194 and 195: Although progress is encouraging, m
- Page 198 and 199: Table 12.2: Trade/ GDP RatiosFY1981
- Page 200 and 201: Table 12.5: Percentage Share of Maj
- Page 202 and 203: well as other provisions in specifi
- Page 204 and 205: Future Implications for NepalIncrea
- Page 206 and 207: International Trade Forum (ITN). 20
- Page 208 and 209: - Gross domestic product per unit e
- Page 210 and 211: Time Series InformationGenerally tw
- Page 212 and 213: Table 13.1a: Different Datasets Col
- Page 214 and 215: elevant due to its multidisciplinar
- Page 216 and 217: Figure 13.6: Examples of Applicatio
- Page 218 and 219: Judith DobmannThere are many source
- Page 220 and 221: ———.2003. Mapping Nepal Censu
- Page 222 and 223: sustainable livelihoods requires an
- Page 224 and 225: and haphazard. Population pressures
- Page 226 and 227: issue. These deficiencies stem from
- Page 228 and 229: population must be assessed. MOEST
- Page 230 and 231: Appendix 14.1: List of Key Environm
- Page 232 and 233: (vii) The EIA report approving agen
- Page 234 and 235: Goal 1: Eradicate extreme poverty a
- Page 236 and 237: Nepal’s Progress Towards the MDGs
- Page 238 and 239: Goal 4: Reduce child mortalityReduc