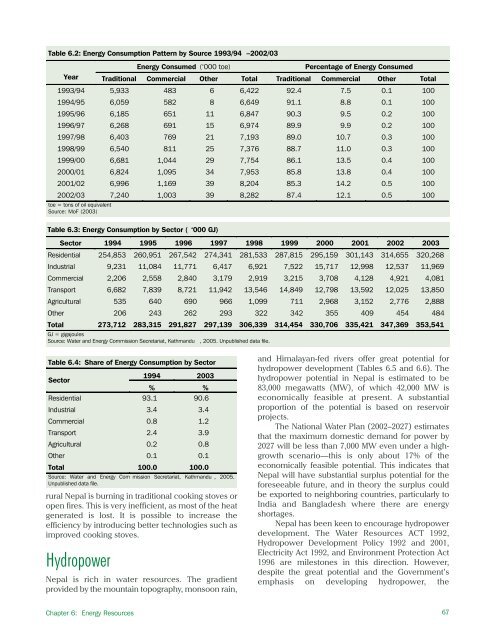
Definition, Forms, and UnitsEnergy is the capacity of matter to do work in relation toforces acting on it. Five forms of energy are oftendistinguished: (i) Mechanical, (ii) Electromagnetic, (iii)Thermal, (iv) Chemical, and (v) Nuclear. Energy conversiontakes place among and within these forms in the process ofhuman production and consumption, as well as in nature;for example burning fuels to produce heat convertschemical energy to thermal energy (i.e., burning woodreleases stored chemical energy, but all is not converted toheat; if heat is the desired form of conversion, conversionto other forms are losses). The efficiency of conversion fromone form to another depends on the extent to whichunwanted dissipation can be avoided. Unwanted dissipationin the process of conversion and use is energy lost.The most common energy sources are biomass, solar,fossil, hydropower, wind, and wave. The sources can beclassified as renewable or nonrenewable depending onwhether they can supply continuously or will be exhausted.The primary source of energy available to us is the sun. Theconcept of renewable and nonrenewable energy is a relativeone—it is basically a distinction about time and spacescale.Energy is measured and expressed in various ways.Joule (J) is the internationally recognized unit for energy.Energy production and use involves conversion of energyfrom one form to another: the rate of conversion (or rate ofdoing work) is defined as power, which is commonlymeasured in watt (W): 1 W is 1 J per second. Electricalappliances have power ratings quoted as W or kW, such asa 40-W electric bulb. Kilogram of oil equivalent issometimes used to bring energy consumption from differentsources to a single, common unit and to express it in aneasily understandable manner.Source: Blunden et al. (1991)Alternative energy. Biogas, micro-hydro, solar,and wind energy come under this heading. Biogas isa more efficient way of utilizing some biomass(animal dung) as energy. Hydropower (includingmicro-hydro), biogas, solar, and wind energy arerenewable; within their re-generation capacity, thesecan supply energy indefinitely.Nepal’s indigenous energy resources includebiomass, hydroelectricity, solar, and wind. Coal andpetroleum products are imported, as the country hasno known economically exploitable fossil fuelreserves. The potential of known indigenous energyresources in Nepal is estimated to be 1,970 milliongigajoule (GJ) annually on a sustainable basis (WECS1996), which would be 15 times the estimated totalconsumption. This indicates that there is sufficientpotential energy supply from indigenous sources. Ofthe total sustainable potential, water resourcesrepresent the largest fraction (75%), with forestscontributing 12%, and the rest coming from othersources.Consumption PatternsIn 2002, Nepal’s total energy demand was 8,883thousand tons of oil equivalent. Energy consumptionincreased at an average rate of 2.5% per annumbetween 1993 and 2002. The annual per capitaenergy consumption is 347 kg of oil equivalent (CBS2004).The energy consumption pattern by sourcebetween 1993/94 and 2002/03 is shown in Table 6.1.Energy consumption is dominated by traditionalsources, which accounted for about 87% of the totalenergy consumption in 2002/03, although itspercentage of total consumption has been slowlydeclining (Table 6.2). Of the traditional sources,fuelwood accounted for 89%, agricultural residuesfor 4%, and animal waste for 6%. Fuelwoodcontributed 75% of the total energy consumed in2002/03. This indicates the pressure on the traditionalsources, primarily on the forests.The share of commercial and alternativesources has been increasing, although at a slowpace. From 1993/94 to 2002/2003, consumption ofcommercial energy increased from 7.5% to 12% ofthe total energy consumed, and the contribution ofalternative energy increased from about 0.1% to0.5%.The energy consumption by sector is shown inTables 6.3 and 6.4. The residential sector consumed90.6% of all energy consumed in 2003, followed bytransport (3.9%), industry (3.4%), commercial (1.2%),agriculture (0.8%), and others (0.1%). Although theamount of energy consumed has increased, theshare of energy consumed by different sectors hasremained more or less unchanged over the lastdecade.The residential sector mainly consumestraditional fuels, whereas the “other” sectorconsumes commercial fuels. Residential consumptionaccounts for around 98% of the traditional fuelsconsumed in the country. Cooking is the mainresidential use of energy in rural areas, where themajority of people live, and fuelwood is the mainsource (household cooking consumes 65% of allrural energy). The residential sector consumes 99%of total fuelwood consumption. In urban areas,kerosene, liquefied petroleum gas (LPG), orelectricity is used for cooking (MOPE 2003). Nepalimports all petroleum products and coal, most ofwhich is consumed by automobiles and industries.Nepal’s energy supply and consumptionpatterns are overwhelmingly dominated bytraditional biomass sources and residential uses,respectively. The principal use of biomass energy in66 Environment Assessment of Nepal : Emerging Issues and Challenges
Table 6.2: Energy Consumption Pattern by Source 1993/94 –2002/03Energy Consumed (‘000 toe)Percentage of Energy ConsumedYear Traditional Commercial Other Total Traditional Commercial Other Total1993/94 5,933 483 6 6,422 92.4 7.5 0.1 1001994/95 6,059 582 8 6,649 91.1 8.8 0.1 1001995/96 6,<strong>18</strong>5 651 11 6,847 90.3 9.5 0.2 1001996/97 6,268 691 15 6,974 89.9 9.9 0.2 1001997/98 6,403 769 21 7,193 89.0 10.7 0.3 1001998/99 6,540 811 25 7,376 88.7 11.0 0.3 1001999/00 6,681 1,044 29 7,754 86.1 13.5 0.4 1002000/01 6,824 1,095 34 7,953 85.8 13.8 0.4 1002001/02 6,996 1,169 39 8,204 85.3 14.2 0.5 1002002/03 7,240 1,003 39 8,282 87.4 12.1 0.5 100toe = tons of oil equivalentSource: MoF (2003)Table 6.3: Energy Consumption by Sector ( ‘000 GJ)Sector 1994 1995 1996 1997 1998 1999 2000 2001 2002 2003Residential 254,853 260,951 267,542 274,341 281,533 287,815 295,159 301,143 314,655 320,268Industrial 9,231 11,084 11,771 6,417 6,921 7,522 15,717 12,998 12,537 11,969Commercial 2,206 2,558 2,840 3,179 2,919 3,215 3,708 4,128 4,921 4,081Transport 6,682 7,839 8,721 11,942 13,546 14,849 12,798 13,592 12,025 13,850Agricultural 535 640 690 966 1,099 711 2,968 3,152 2,776 2,888Other 206 243 262 293 322 342 355 409 454 484Total 273,712 283,315 291,827 297,139 306,339 314,454 330,706 335,421 347,369 353,541GJ = gigajoulesSource: Water and Energy Commission Secretariat, Kathmandu, 2005. Unpublished data file.Table 6.4: Share of Energy Consumption by SectorSector1994 2003% %Residential 93.1 90.6Industrial 3.4 3.4Commercial 0.8 1.2Transport 2.4 3.9Agricultural 0.2 0.8Other 0.1 0.1Total 100.0 100.0Source: Water and Energy Com mission Secretariat, Kathmandu , 2005.Unpublished data file.rural Nepal is burning in traditional cooking stoves oropen fires. This is very inefficient, as most of the heatgenerated is lost. It is possible to increase theefficiency by introducing better technologies such asimproved cooking stoves.HydropowerNepal is rich in water resources. The gradientprovided by the mountain topography, monsoon rain,and <strong>Himalayan</strong>-fed rivers offer great potential forhydropower development (Tables 6.5 and 6.6). Thehydropower potential in Nepal is estimated to be83,000 megawatts (MW), of which 42,000 MW iseconomically feasible at present. A substantialproportion of the potential is based on reservoirprojects.The National Water Plan (2002–2027) estimatesthat the maximum domestic demand for power by2027 will be less than 7,000 MW even under a highgrowthscenario—this is only about 17% of theeconomically feasible potential. This indicates thatNepal will have substantial surplus potential for theforeseeable future, and in theory the surplus couldbe exported to neighboring countries, particularly toIndia and Bangladesh where there are energyshortages.Nepal has been keen to encourage hydropowerdevelopment. The Water Resources ACT 1992,Hydropower Development Policy 1992 and 2001,Electricity Act 1992, and Environment Protection Act1996 are milestones in this direction. However,despite the great potential and the Government’semphasis on developing hydropower, theChapter 6: Energy Resources67
- Page 2 and 3:
About the OrganisationsAsian Develo
- Page 4 and 5:
© 2006 International Centre for In
- Page 6 and 7:
AcknowledgementsWe would like to ex
- Page 8 and 9:
PM2.5PAHRSSAARCSACEPSEASO 2TSPUKUND
- Page 10 and 11:
Chapter 6: Energy Resources 65Intro
- Page 12 and 13:
List of FiguresFigure 2.1: People a
- Page 14 and 15:
Table 6.1: Energy Consumption and P
- Page 16 and 17:
forests are also used for infrastru
- Page 18 and 19:
as data gathered by different agenc
- Page 20 and 21:
Table 2.1: Population Growth Rates
- Page 22 and 23:
mortality rates for rural and urban
- Page 24 and 25:
Agglomeration village in the centra
- Page 26 and 27:
soil erosion, and depletion of wate
- Page 30 and 31: provision remains inadequate becaus
- Page 32 and 33: Malnutrition remains a serious obst
- Page 34 and 35: Table 2.24: Existing and Projected
- Page 36 and 37: Table 2.28: Income Poverty Indicato
- Page 38 and 39: Table 2.31: Change in Employment St
- Page 40 and 41: In 2004, the average annual househo
- Page 42 and 43: Mountain areas have the most food i
- Page 44 and 45: Schaffner, U. 1987. “Road Constru
- Page 46 and 47: Table 3.1: Agricultural Economic De
- Page 48 and 49: Table 3.4: Estimated Soil Erosion R
- Page 50 and 51: B. PradhanImpacts of land degradati
- Page 52 and 53: Carson, B. 1985. “Erosion and Sed
- Page 54 and 55: The trend of forest coverage in the
- Page 56 and 57: BiodiversityState of BiodiversityNe
- Page 58 and 59: The Government has given legal prot
- Page 60 and 61: Different ways of maintaining biodi
- Page 62 and 63: ———.2004. State of the Enviro
- Page 64 and 65: Appendix 4.1: Table continuedMajor
- Page 66 and 67: Appendix 4.2: Protected Plant and W
- Page 68 and 69: Table A4.2.3: Nepal's Share in Plan
- Page 70 and 71: to intense weathering, and percolat
- Page 72 and 73: Table 5.5: Water Supply and Water T
- Page 74 and 75: Table 5.9: Water Quality of Shallow
- Page 76 and 77: species are reported to be endanger
- Page 78 and 79: Ministry of Water Resources (MOWR).
- Page 82 and 83: Table 6.5: Hydropower PotentialRive
- Page 84 and 85: Chilime Hydroelectric Project: An E
- Page 86 and 87: load occurs from 6 pm to 9 pm with
- Page 88 and 89: assessment of wind energy and lack
- Page 90 and 91: Review of Dams and Development by t
- Page 92 and 93: IUCNElizabeth Khaka, UNEP-NairobiRu
- Page 94 and 95: therefore reflect the three guiding
- Page 96 and 97: is a seasonal dust storm. Anthropog
- Page 98 and 99: Figure 7.3: Average Air Quality, Ja
- Page 100 and 101: matter, hydrocarbons, and NO x (Nae
- Page 102 and 103: Figure: 7.9: Vehicle Registered in
- Page 104 and 105: Brick Kilnchlorofluorocarbons (HCFC
- Page 106 and 107: Climate ChangeA region’s climate
- Page 108 and 109: Figure 7.14: Mean Annual Precipitat
- Page 110 and 111: Table 7.3: National Ambient Air Qua
- Page 112 and 113: India. Available: http://www.cleana
- Page 114 and 115: ———.1999. “Ambient Air Qual
- Page 116 and 117: Appendix 7.1: World Health Organiza
- Page 118 and 119: Table 8.1: Criteria for Urban Statu
- Page 120 and 121: accommodate the rapidly increasing
- Page 122 and 123: managing solid waste. They are part
- Page 124 and 125: In most municipalities, hazardous w
- Page 126 and 127: in worsening public health conditio
- Page 128 and 129: objects of archaeological, historic
- Page 130 and 131:
Min BajracharyaB. PradhanVehicles a
- Page 132 and 133:
Department of Health Services (DOHS
- Page 134 and 135:
Table 9.1 describes the major highl
- Page 136 and 137:
the period to up 2017. The document
- Page 138 and 139:
earthquakes; and awareness raising
- Page 140 and 141:
Sub-regional LinkagesOther developi
- Page 142 and 143:
Figure 9.1: The Key Environmental I
- Page 144 and 145:
(iv)(v)(vi)plants, and other non-ti
- Page 146 and 147:
environmental governance can be bet
- Page 148 and 149:
can vary considerably. Both sides h
- Page 150 and 151:
Dhungel, D.N., and A.B. Rajbhandari
- Page 152 and 153:
Table A9.1.2: Industry-Specific Tol
- Page 154 and 155:
. Cultural Heritage8. Convention fo
- Page 156 and 157:
Appendix 9.3: Some Prominent Enviro
- Page 158 and 159:
Some funding arrangements made by t
- Page 160 and 161:
(NARDF 2004) for a period of 1 to 3
- Page 162 and 163:
Table 10.2: Annual Income and Expen
- Page 164 and 165:
Table 10.4: Users’ Share in Benef
- Page 166 and 167:
From Hands Around Everest bookFrom
- Page 168 and 169:
Table 10.8: Subsidy Rate for Biogas
- Page 170 and 171:
microorganism communities and the n
- Page 172 and 173:
subsidies (Mason 1996). All these a
- Page 174 and 175:
addressed only part of the problem.
- Page 176 and 177:
historical practice of community-ma
- Page 178 and 179:
moved or relocated. The fact that s
- Page 180 and 181:
Kathmandu Valley and receives a lar
- Page 182 and 183:
cooperative ventures provided neith
- Page 184 and 185:
further poaching has not been repor
- Page 186 and 187:
http://www.pugwash.org/reports/pac/
- Page 188 and 189:
United Nations. 2003. World Populat
- Page 190 and 191:
how other countries with substantia
- Page 192 and 193:
(i) Broad-based and sustainable eco
- Page 194 and 195:
Although progress is encouraging, m
- Page 196 and 197:
Nepal’s Changing Pattern of Trade
- Page 198 and 199:
Table 12.2: Trade/ GDP RatiosFY1981
- Page 200 and 201:
Table 12.5: Percentage Share of Maj
- Page 202 and 203:
well as other provisions in specifi
- Page 204 and 205:
Future Implications for NepalIncrea
- Page 206 and 207:
International Trade Forum (ITN). 20
- Page 208 and 209:
- Gross domestic product per unit e
- Page 210 and 211:
Time Series InformationGenerally tw
- Page 212 and 213:
Table 13.1a: Different Datasets Col
- Page 214 and 215:
elevant due to its multidisciplinar
- Page 216 and 217:
Figure 13.6: Examples of Applicatio
- Page 218 and 219:
Judith DobmannThere are many source
- Page 220 and 221:
———.2003. Mapping Nepal Censu
- Page 222 and 223:
sustainable livelihoods requires an
- Page 224 and 225:
and haphazard. Population pressures
- Page 226 and 227:
issue. These deficiencies stem from
- Page 228 and 229:
population must be assessed. MOEST
- Page 230 and 231:
Appendix 14.1: List of Key Environm
- Page 232 and 233:
(vii) The EIA report approving agen
- Page 234 and 235:
Goal 1: Eradicate extreme poverty a
- Page 236 and 237:
Nepal’s Progress Towards the MDGs
- Page 238 and 239:
Goal 4: Reduce child mortalityReduc