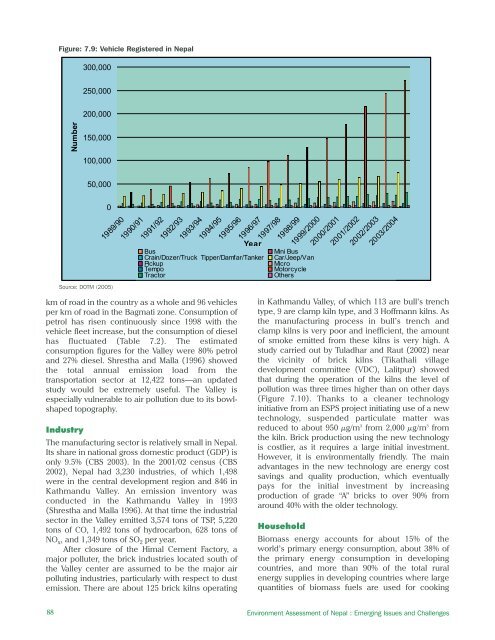
Figure: 7.9: Vehicle Registered in Nepal300,000250,000200,000Number150,000100,00050,0000Source: DOTM (2005)1989/901990/911991/921992/931993/941994/951995/961996/97YearBusCrain/Dozer/Truck Tipper/Damfar/TankerPickupTempoTractor1997/981998/991999/2000Mini BusCar/Jeep/VanMicroMotorcycleOthers2000/20012001/20022002/20032003/2004km of road in the country as a whole and 96 vehiclesper km of road in the Bagmati zone. Consumption ofpetrol has risen continuously since 1998 with thevehicle fleet increase, but the consumption of dieselhas fluctuated (Table 7.2). The estimatedconsumption figures for the Valley were 80% petroland 27% diesel. Shrestha and Malla (1996) showedthe total annual emission load from thetransportation sector at 12,422 tons—an updatedstudy would be extremely useful. The Valley isespecially vulnerable to air pollution due to its bowlshapedtopography.IndustryThe manufacturing sector is relatively small in Nepal.Its share in national gross domestic product (GDP) isonly 9.5% (CBS 2003). In the 2001/02 census (CBS2002), Nepal had 3,230 industries, of which 1,498were in the central development region and 846 inKathmandu Valley. An emission inventory wasconducted in the Kathmandu Valley in 1993(Shrestha and Malla 1996). At that time the industrialsector in the Valley emitted 3,574 tons of TSP, 5,220tons of CO, 1,492 tons of hydrocarbon, 628 tons ofNO x , and 1,349 tons of SO 2 per year.After closure of the Himal Cement Factory, amajor polluter, the brick industries located south ofthe Valley center are assumed to be the major airpolluting industries, particularly with respect to dustemission. There are about 125 brick kilns operatingin Kathmandu Valley, of which 113 are bull’s trenchtype, 9 are clamp kiln type, and 3 Hoffmann kilns. Asthe manufacturing process in bull’s trench andclamp kilns is very poor and inefficient, the amountof smoke emitted from these kilns is very high. Astudy carried out by Tuladhar and Raut (2002) nearthe vicinity of brick kilns (Tikathali villagedevelopment committee (VDC), Lalitpur) showedthat during the operation of the kilns the level ofpollution was three times higher than on other days(Figure 7.10). Thanks to a cleaner technologyinitiative from an ESPS project initiating use of a newtechnology, suspended particulate matter wasreduced to about 950 μg/m 3 from 2,000 μg/m 3 fromthe kiln. Brick production using the new technologyis costlier, as it requires a large initial investment.However, it is environmentally friendly. The mainadvantages in the new technology are energy costsavings and quality production, which eventuallypays for the initial investment by increasingproduction of grade “A” bricks to over 90% fromaround 40% with the older technology.HouseholdBiomass energy accounts for about 15% of theworld’s primary energy consumption, about 38% ofthe primary energy consumption in developingcountries, and more than 90% of the total ruralenergy supplies in developing countries where largequantities of biomass fuels are used for cooking88 Environment Assessment of Nepal : Emerging Issues and Challenges
Table 7.2: Consumption of Petroleum ProductsMain Item ofPetroleumUnit 1988/89 1989/90 1990/91 1991/91 1992/93 1993/94 1994/95 1995/96Petrol '000 liters 17,340 14,708 17,241 26,780 29,910 31,056 34,942 41,191Diesel '000 liters 75,356 103,273 106,438 166,552 179,900 196,047 227,226 250,504Kerosene '000 liters 63,246 92,672 75,939 122,458 149,237 162,077 <strong>18</strong>0,536 208,720Light Diesel Oil '000 liters 9,327 16,541 2,542 1,530 – 4,191 4,375Furnace Oil '000 liters – – – 11,062 20,222 27,319 31,567 <strong>18</strong>,449Air Fuel '000 liters – – – 24,836 29,210 30,250 37,536 40,621LPG million tons – – – – – – – <strong>18</strong>,400Main Item ofPetroleumUnit 1996/97 1997/98 1998/99 1999/00 2000/01 2001/02 2002/03 2003/04 aPetrol '000 liters 44,889 46,939 49,994 55,589 59,245 63,578 68,482 46,058Diesel '000 liters 257,235 300,604 315,780 310,561 326,060 287,657 301,672 <strong>18</strong>1,8<strong>18</strong>Kerosene '000 liters 243,005 282,026 294,982 331,120 316,381 390,113 351,696 208,033Light Diesel Oil '000 liters 2,017 967 547 4,005 3,4<strong>18</strong> 2,413 610 556Furnace Oil '000 liters 16,858 27,776 33,860 26,876 20,999 <strong>18</strong>,255 14,502 6,405Air Fuel '000 liters 47,688 51,412 55,549 56,849 63,130 47,274 53,546 44,653LPG million tons 21,824 22,361 25,019 30,627 40,102 48,757 56,079 43,871– = not available, LPG = liqu efied petroleum gasa First 9 m onths of the Nepali year, approximately <strong>April</strong> –December 2003 .Source: MOF (2004)Figure 7.10: Pollutants Monitored at TikathaliFigure: 7.11: Total Energy Consumption by ResidentialSectorSource: WECS (1999)μg/m 3 = microgram per cubic meterSource: Tuladhar and Raut (2002)(Bhattacharya undated). Deforestation anddesertification are the most serious consequences ofreliance on biomass fuels. Use of crop and animalresidues for fuel deprives the soil of recyclednutrients and reduces crop yields along with theland’s capacity to support livestock. Biomass fuelsare the most common fuels used in rural areas of theTerai and the Hills. Use of coal and kerosene in ruralareas is limited to relatively well-to-do families. Incities, liquefied petroleum gas is also usedextensively. Figure 7.11 shows the amount of energyconsumption by the residential sector by fuel type.There are no estimates of emissions fromdomestic fuel use available for the entire country,although a few research studies have beenconducted in Kathmandu Valley. Shrestha and Malla(1996) estimated that in 1993 14,246 tons of airpollutants were emitted each year from domesticsector energy use in Kathmandu Valley.Household equipment is also a source of aparticular group of “ozone depleting substances,”chemicals that enter the air, travel to the upperatmosphere, and are instrumental in destroying theupper level ozone layer that shields the earth fromharmful radiation. The people living in Nepal’s urbanareas are more used to modern amenities than thosein rural areas. More and more urban inhabitants areable to enjoy a comfortable life with modernamenities such as refrigerators and air conditioning.A survey carried out by the Nepal Bureau ofStandards and Metrology (NBSM 1999) identifiedchlorofluorocarbons (CFC-12) and hydro-Chapter 7: Air Pollution and Climate Change89
- Page 2 and 3:
About the OrganisationsAsian Develo
- Page 4 and 5:
© 2006 International Centre for In
- Page 6 and 7:
AcknowledgementsWe would like to ex
- Page 8 and 9:
PM2.5PAHRSSAARCSACEPSEASO 2TSPUKUND
- Page 10 and 11:
Chapter 6: Energy Resources 65Intro
- Page 12 and 13:
List of FiguresFigure 2.1: People a
- Page 14 and 15:
Table 6.1: Energy Consumption and P
- Page 16 and 17:
forests are also used for infrastru
- Page 18 and 19:
as data gathered by different agenc
- Page 20 and 21:
Table 2.1: Population Growth Rates
- Page 22 and 23:
mortality rates for rural and urban
- Page 24 and 25:
Agglomeration village in the centra
- Page 26 and 27:
soil erosion, and depletion of wate
- Page 30 and 31:
provision remains inadequate becaus
- Page 32 and 33:
Malnutrition remains a serious obst
- Page 34 and 35:
Table 2.24: Existing and Projected
- Page 36 and 37:
Table 2.28: Income Poverty Indicato
- Page 38 and 39:
Table 2.31: Change in Employment St
- Page 40 and 41:
In 2004, the average annual househo
- Page 42 and 43:
Mountain areas have the most food i
- Page 44 and 45:
Schaffner, U. 1987. “Road Constru
- Page 46 and 47:
Table 3.1: Agricultural Economic De
- Page 48 and 49:
Table 3.4: Estimated Soil Erosion R
- Page 50 and 51:
B. PradhanImpacts of land degradati
- Page 52 and 53: Carson, B. 1985. “Erosion and Sed
- Page 54 and 55: The trend of forest coverage in the
- Page 56 and 57: BiodiversityState of BiodiversityNe
- Page 58 and 59: The Government has given legal prot
- Page 60 and 61: Different ways of maintaining biodi
- Page 62 and 63: ———.2004. State of the Enviro
- Page 64 and 65: Appendix 4.1: Table continuedMajor
- Page 66 and 67: Appendix 4.2: Protected Plant and W
- Page 68 and 69: Table A4.2.3: Nepal's Share in Plan
- Page 70 and 71: to intense weathering, and percolat
- Page 72 and 73: Table 5.5: Water Supply and Water T
- Page 74 and 75: Table 5.9: Water Quality of Shallow
- Page 76 and 77: species are reported to be endanger
- Page 78 and 79: Ministry of Water Resources (MOWR).
- Page 80 and 81: Definition, Forms, and UnitsEnergy
- Page 82 and 83: Table 6.5: Hydropower PotentialRive
- Page 84 and 85: Chilime Hydroelectric Project: An E
- Page 86 and 87: load occurs from 6 pm to 9 pm with
- Page 88 and 89: assessment of wind energy and lack
- Page 90 and 91: Review of Dams and Development by t
- Page 92 and 93: IUCNElizabeth Khaka, UNEP-NairobiRu
- Page 94 and 95: therefore reflect the three guiding
- Page 96 and 97: is a seasonal dust storm. Anthropog
- Page 98 and 99: Figure 7.3: Average Air Quality, Ja
- Page 100 and 101: matter, hydrocarbons, and NO x (Nae
- Page 104 and 105: Brick Kilnchlorofluorocarbons (HCFC
- Page 106 and 107: Climate ChangeA region’s climate
- Page 108 and 109: Figure 7.14: Mean Annual Precipitat
- Page 110 and 111: Table 7.3: National Ambient Air Qua
- Page 112 and 113: India. Available: http://www.cleana
- Page 114 and 115: ———.1999. “Ambient Air Qual
- Page 116 and 117: Appendix 7.1: World Health Organiza
- Page 118 and 119: Table 8.1: Criteria for Urban Statu
- Page 120 and 121: accommodate the rapidly increasing
- Page 122 and 123: managing solid waste. They are part
- Page 124 and 125: In most municipalities, hazardous w
- Page 126 and 127: in worsening public health conditio
- Page 128 and 129: objects of archaeological, historic
- Page 130 and 131: Min BajracharyaB. PradhanVehicles a
- Page 132 and 133: Department of Health Services (DOHS
- Page 134 and 135: Table 9.1 describes the major highl
- Page 136 and 137: the period to up 2017. The document
- Page 138 and 139: earthquakes; and awareness raising
- Page 140 and 141: Sub-regional LinkagesOther developi
- Page 142 and 143: Figure 9.1: The Key Environmental I
- Page 144 and 145: (iv)(v)(vi)plants, and other non-ti
- Page 146 and 147: environmental governance can be bet
- Page 148 and 149: can vary considerably. Both sides h
- Page 150 and 151: Dhungel, D.N., and A.B. Rajbhandari
- Page 152 and 153:
Table A9.1.2: Industry-Specific Tol
- Page 154 and 155:
. Cultural Heritage8. Convention fo
- Page 156 and 157:
Appendix 9.3: Some Prominent Enviro
- Page 158 and 159:
Some funding arrangements made by t
- Page 160 and 161:
(NARDF 2004) for a period of 1 to 3
- Page 162 and 163:
Table 10.2: Annual Income and Expen
- Page 164 and 165:
Table 10.4: Users’ Share in Benef
- Page 166 and 167:
From Hands Around Everest bookFrom
- Page 168 and 169:
Table 10.8: Subsidy Rate for Biogas
- Page 170 and 171:
microorganism communities and the n
- Page 172 and 173:
subsidies (Mason 1996). All these a
- Page 174 and 175:
addressed only part of the problem.
- Page 176 and 177:
historical practice of community-ma
- Page 178 and 179:
moved or relocated. The fact that s
- Page 180 and 181:
Kathmandu Valley and receives a lar
- Page 182 and 183:
cooperative ventures provided neith
- Page 184 and 185:
further poaching has not been repor
- Page 186 and 187:
http://www.pugwash.org/reports/pac/
- Page 188 and 189:
United Nations. 2003. World Populat
- Page 190 and 191:
how other countries with substantia
- Page 192 and 193:
(i) Broad-based and sustainable eco
- Page 194 and 195:
Although progress is encouraging, m
- Page 196 and 197:
Nepal’s Changing Pattern of Trade
- Page 198 and 199:
Table 12.2: Trade/ GDP RatiosFY1981
- Page 200 and 201:
Table 12.5: Percentage Share of Maj
- Page 202 and 203:
well as other provisions in specifi
- Page 204 and 205:
Future Implications for NepalIncrea
- Page 206 and 207:
International Trade Forum (ITN). 20
- Page 208 and 209:
- Gross domestic product per unit e
- Page 210 and 211:
Time Series InformationGenerally tw
- Page 212 and 213:
Table 13.1a: Different Datasets Col
- Page 214 and 215:
elevant due to its multidisciplinar
- Page 216 and 217:
Figure 13.6: Examples of Applicatio
- Page 218 and 219:
Judith DobmannThere are many source
- Page 220 and 221:
———.2003. Mapping Nepal Censu
- Page 222 and 223:
sustainable livelihoods requires an
- Page 224 and 225:
and haphazard. Population pressures
- Page 226 and 227:
issue. These deficiencies stem from
- Page 228 and 229:
population must be assessed. MOEST
- Page 230 and 231:
Appendix 14.1: List of Key Environm
- Page 232 and 233:
(vii) The EIA report approving agen
- Page 234 and 235:
Goal 1: Eradicate extreme poverty a
- Page 236 and 237:
Nepal’s Progress Towards the MDGs
- Page 238 and 239:
Goal 4: Reduce child mortalityReduc