ADB_book_18 April.qxp - Himalayan Document Centre - icimod
ADB_book_18 April.qxp - Himalayan Document Centre - icimod
ADB_book_18 April.qxp - Himalayan Document Centre - icimod
- No tags were found...
Create successful ePaper yourself
Turn your PDF publications into a flip-book with our unique Google optimized e-Paper software.
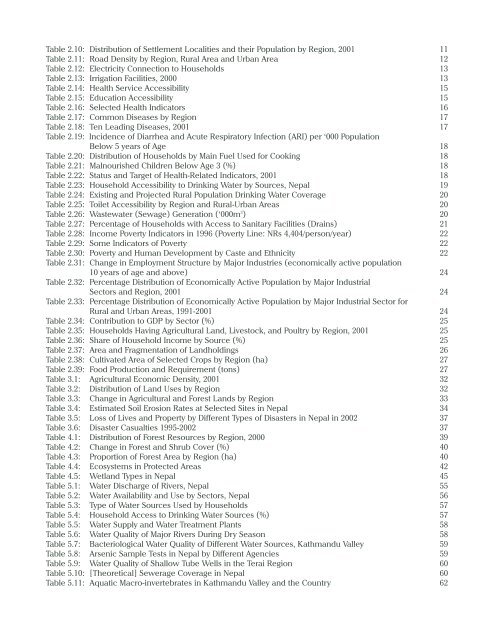
Table 2.10: Distribution of Settlement Localities and their Population by Region, 2001 11Table 2.11: Road Density by Region, Rural Area and Urban Area 12Table 2.12: Electricity Connection to Households 13Table 2.13: Irrigation Facilities, 2000 13Table 2.14: Health Service Accessibility 15Table 2.15: Education Accessibility 15Table 2.16: Selected Health Indicators 16Table 2.17: Common Diseases by Region 17Table 2.<strong>18</strong>: Ten Leading Diseases, 2001 17Table 2.19: Incidence of Diarrhea and Acute Respiratory Infection (ARI) per ‘000 PopulationBelow 5 years of Age <strong>18</strong>Table 2.20: Distribution of Households by Main Fuel Used for Cooking <strong>18</strong>Table 2.21: Malnourished Children Below Age 3 (%) <strong>18</strong>Table 2.22: Status and Target of Health-Related Indicators, 2001 <strong>18</strong>Table 2.23: Household Accessibility to Drinking Water by Sources, Nepal 19Table 2.24: Existing and Projected Rural Population Drinking Water Coverage 20Table 2.25: Toilet Accessibility by Region and Rural-Urban Areas 20Table 2.26: Wastewater (Sewage) Generation (‘000m 3 ) 20Table 2.27: Percentage of Households with Access to Sanitary Facilities (Drains) 21Table 2.28: Income Poverty Indicators in 1996 (Poverty Line: NRs 4,404/person/year) 22Table 2.29: Some Indicators of Poverty 22Table 2.30: Poverty and Human Development by Caste and Ethnicity 22Table 2.31: Change in Employment Structure by Major Industries (economically active population10 years of age and above) 24Table 2.32: Percentage Distribution of Economically Active Population by Major IndustrialSectors and Region, 2001 24Table 2.33: Percentage Distribution of Economically Active Population by Major Industrial Sector forRural and Urban Areas, 1991-2001 24Table 2.34: Contribution to GDP by Sector (%) 25Table 2.35: Households Having Agricultural Land, Livestock, and Poultry by Region, 2001 25Table 2.36: Share of Household Income by Source (%) 25Table 2.37: Area and Fragmentation of Landholdings 26Table 2.38: Cultivated Area of Selected Crops by Region (ha) 27Table 2.39: Food Production and Requirement (tons) 27Table 3.1: Agricultural Economic Density, 2001 32Table 3.2: Distribution of Land Uses by Region 32Table 3.3: Change in Agricultural and Forest Lands by Region 33Table 3.4: Estimated Soil Erosion Rates at Selected Sites in Nepal 34Table 3.5: Loss of Lives and Property by Different Types of Disasters in Nepal in 2002 37Table 3.6: Disaster Casualties 1995-2002 37Table 4.1: Distribution of Forest Resources by Region, 2000 39Table 4.2: Change in Forest and Shrub Cover (%) 40Table 4.3: Proportion of Forest Area by Region (ha) 40Table 4.4: Ecosystems in Protected Areas 42Table 4.5: Wetland Types in Nepal 45Table 5.1: Water Discharge of Rivers, Nepal 55Table 5.2: Water Availability and Use by Sectors, Nepal 56Table 5.3: Type of Water Sources Used by Households 57Table 5.4: Household Access to Drinking Water Sources (%) 57Table 5.5: Water Supply and Water Treatment Plants 58Table 5.6: Water Quality of Major Rivers During Dry Season 58Table 5.7: Bacteriological Water Quality of Different Water Sources, Kathmandu Valley 59Table 5.8: Arsenic Sample Tests in Nepal by Different Agencies 59Table 5.9: Water Quality of Shallow Tube Wells in the Terai Region 60Table 5.10: [Theoretical] Sewerage Coverage in Nepal 60Table 5.11: Aquatic Macro-invertebrates in Kathmandu Valley and the Country 62


