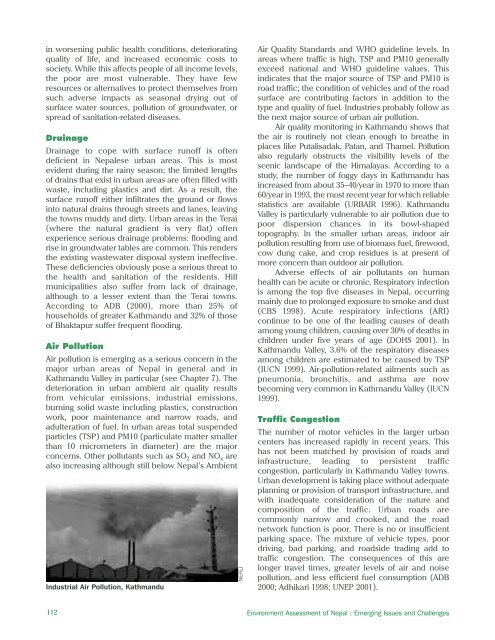
in worsening public health conditions, deterioratingquality of life, and increased economic costs tosociety. While this affects people of all income levels,the poor are most vulnerable. They have fewresources or alternatives to protect themselves fromsuch adverse impacts as seasonal drying out ofsurface water sources, pollution of groundwater, orspread of sanitation-related diseases.DrainageDrainage to cope with surface runoff is oftendeficient in Nepalese urban areas. This is mostevident during the rainy season; the limited lengthsof drains that exist in urban areas are often filled withwaste, including plastics and dirt. As a result, thesurface runoff either infiltrates the ground or flowsinto natural drains through streets and lanes, leavingthe towns muddy and dirty. Urban areas in the Terai(where the natural gradient is very flat) oftenexperience serious drainage problems: flooding andrise in groundwater tables are common. This rendersthe existing wastewater disposal system ineffective.These deficiencies obviously pose a serious threat tothe health and sanitation of the residents. Hillmunicipalities also suffer from lack of drainage,although to a lesser extent than the Terai towns.According to <strong>ADB</strong> (2000), more than 25% ofhouseholds of greater Kathmandu and 32% of thoseof Bhaktapur suffer frequent flooding.Air PollutionAir pollution is emerging as a serious concern in themajor urban areas of Nepal in general and inKathmandu Valley in particular (see Chapter 7). Thedeterioration in urban ambient air quality resultsfrom vehicular emissions, industrial emissions,burning solid waste including plastics, constructionwork, poor maintenance and narrow roads, andadulteration of fuel. In urban areas total suspendedparticles (TSP) and PM10 (particulate matter smallerthan 10 micrometers in diameter) are the majorconcerns. Other pollutants such as SO 2 and NO x arealso increasing although still below Nepal’s AmbientIndustrial Air Pollution, KathmanduNEFEJAir Quality Standards and WHO guideline levels. Inareas where traffic is high, TSP and PM10 generallyexceed national and WHO guideline values. Thisindicates that the major source of TSP and PM10 isroad traffic; the condition of vehicles and of the roadsurface are contributing factors in addition to thetype and quality of fuel. Industries probably follow asthe next major source of urban air pollution.Air quality monitoring in Kathmandu shows thatthe air is routinely not clean enough to breathe inplaces like Putalisadak, Patan, and Thamel. Pollutionalso regularly obstructs the visibility levels of thescenic landscape of the Himalayas. According to astudy, the number of foggy days in Kathmandu hasincreased from about 35–40/year in 1970 to more than60/year in 1993, the most recent year for which reliablestatistics are available (URBAIR 1996). KathmanduValley is particularly vulnerable to air pollution due topoor dispersion chances in its bowl-shapedtopography. In the smaller urban areas, indoor airpollution resulting from use of biomass fuel, firewood,cow dung cake, and crop residues is at present ofmore concern than outdoor air pollution.Adverse effects of air pollutants on humanhealth can be acute or chronic. Respiratory infectionis among the top five diseases in Nepal, occurringmainly due to prolonged exposure to smoke and dust(CBS 1998). Acute respiratory infections (ARI)continue to be one of the leading causes of deathamong young children, causing over 30% of deaths inchildren under five years of age (DOHS 2001). InKathmandu Valley, 3.6% of the respiratory diseasesamong children are estimated to be caused by TSP(IUCN 1999). Air-pollution-related ailments such aspneumonia, bronchitis, and asthma are nowbecoming very common in Kathmandu Valley (IUCN1999).Traffic CongestionThe number of motor vehicles in the larger urbancenters has increased rapidly in recent years. Thishas not been matched by provision of roads andinfrastructure, leading to persistent trafficcongestion, particularly in Kathmandu Valley towns.Urban development is taking place without adequateplanning or provision of transport infrastructure, andwith inadequate consideration of the nature andcomposition of the traffic. Urban roads arecommonly narrow and crooked, and the roadnetwork function is poor. There is no or insufficientparking space. The mixture of vehicle types, poordriving, bad parking, and roadside trading add totraffic congestion. The consequences of this arelonger travel times, greater levels of air and noisepollution, and less efficient fuel consumption (<strong>ADB</strong>2000; Adhikari 1998; UNEP 2001).112 Environment Assessment of Nepal : Emerging Issues and Challenges
Noise PollutionNoise is becoming a significant form of pollution inurban areas. It is a public nuisance and affectspeople’s health physically and psychologically (byincreasing irritation, tension, nervousness, andanxiety). Transport noise, industrial noise, and communityor neighborhood noise represent the leadingforms of noise pollution in Nepal (IUCN 1991).Prolonged exposure to high noise levels may causepermanent hearing loss. Industrial noise is also asignificant occupational hazard. Many noise-sensitivesites such as colleges and hospitals are also subjectto much higher levels of noise than acceptable.Like air pollution, noise is on the increase inmunicipal and industrial areas. Sources of significantnoise include traffic, industries, use of heavymachines and tools in construction and commercialactivities, and use of loudspeakers for prayer in theearly morning hours. Conflicting land use in urbanareas has contributed to noise pollution whereresidential use is mixed with noise-causing industries(<strong>ADB</strong> 2000). Transportation is one of thepredominant sources of noise pollution. Powertillers, buses, heavy trucks, and three-wheelers aresignificant contributors to noise pollution inmunicipal areas (UNEP 2001). Road traffic noiselevels in Kathmandu range from 70 to 100 decibels(dBA). The noise level in industries such as textile,metal works, cement, and flour mills is very high,with noise levels exceeding 90 dBA (IUCN 1999).People living around airports are subject to highlevels of noise produced by aircraft.Impacts on Heritage Sites, Open Spaces,and Agricultural LandIn the urban areas of Nepal, open spaces traditionallyexist in the form of public/community spaces aroundcultural and heritage sites as well as in religiousforested clumps and pond areas. In many smallertowns, open space also provides fortnightly, weekly,or bi-weekly market sites. Provision of public parks,playgrounds, and green open space, although foundin a few urban centers, is not common in Nepal’surban planning and development.Traditional open spaces are treated as “noman’s land”. Heritage sites and open spaces areunder increasing pressure as haphazard urbanizationcontinues. The historical and cultural sites aredeteriorating due to pollution, emerging building hasdefaced historical and cultural monuments, andencroachment of the open space and premises ofthese sites is common (HMG/UNDP 1994; Adhikari1998; IUCN 1999).Urbanization invariably brings about land-usechange. Loss or degradation of fertile agriculturalland as a result of unguided urban development is along-term concern. Urban areas of Kathmandu Valleyhave expanded at the cost of agricultural land.According to Karki (1998), between 1984 and 1994,the urban area in the valley increased from 3096 hato 8378 ha and 5282 ha of fertile agricultural land waslost in the process of unplanned urbanization. If thistrend continues, by the year 2020, all the primeagricultural land in Kathmandu valley will beurbanized. The loss of agricultural land inKathmandu Valley is an important indication of whatmay happen in other urban areas as they growhaphazardly.Policies and InitiativesPolicyThere is no specific policy for the urban sector inNepal, although the significance of the urban sectorrises consistently. Urban development ismultisectoral and the urban policy thrust can bederived from the sectoral policies. The sectoralpolicies, plans, and related legislation andregulations provide a basic framework for urbandevelopment and environmental safeguards in urbanareas. Some relevant legislation and policies includethe following:(i) Local Self-governance Act 1999: empowersmunicipalities to administer and managelocal resources, and to prepare andimplement programs. The Act is intended todevelop municipalities as self-governingautonomous urban local bodies playing aneffective role in overall urban development.(ii) Town Development Fund Act 1997: facilitatesfinancing of urban infrastructure projects inmunicipalities or urbanizing villages.(iii) Solid Waste Management and ResourceMobilisation Act 1987: regulates collection,recycling, and disposal of solid waste inmunicipal areas.(iv) Industrial Enterprises Act 1992: controls theestablishment of industries and regulateslicenses for establishment, expansion, andmodernization of industrial enterprises.(v) Environment Protection Act 1996: requiresenvironmental assessment of proposedprojects, empowers the Government toprovide incentives to any activity that haspositive impacts on the environment, andhas provisions for polluters to compensatepersons suffering from polluting activities.(vi) Ancient Monument Protection Act 1956:protects ancient monuments and otherChapter 8: Urban Environment113
- Page 2 and 3:
About the OrganisationsAsian Develo
- Page 4 and 5:
© 2006 International Centre for In
- Page 6 and 7:
AcknowledgementsWe would like to ex
- Page 8 and 9:
PM2.5PAHRSSAARCSACEPSEASO 2TSPUKUND
- Page 10 and 11:
Chapter 6: Energy Resources 65Intro
- Page 12 and 13:
List of FiguresFigure 2.1: People a
- Page 14 and 15:
Table 6.1: Energy Consumption and P
- Page 16 and 17:
forests are also used for infrastru
- Page 18 and 19:
as data gathered by different agenc
- Page 20 and 21:
Table 2.1: Population Growth Rates
- Page 22 and 23:
mortality rates for rural and urban
- Page 24 and 25:
Agglomeration village in the centra
- Page 26 and 27:
soil erosion, and depletion of wate
- Page 30 and 31:
provision remains inadequate becaus
- Page 32 and 33:
Malnutrition remains a serious obst
- Page 34 and 35:
Table 2.24: Existing and Projected
- Page 36 and 37:
Table 2.28: Income Poverty Indicato
- Page 38 and 39:
Table 2.31: Change in Employment St
- Page 40 and 41:
In 2004, the average annual househo
- Page 42 and 43:
Mountain areas have the most food i
- Page 44 and 45:
Schaffner, U. 1987. “Road Constru
- Page 46 and 47:
Table 3.1: Agricultural Economic De
- Page 48 and 49:
Table 3.4: Estimated Soil Erosion R
- Page 50 and 51:
B. PradhanImpacts of land degradati
- Page 52 and 53:
Carson, B. 1985. “Erosion and Sed
- Page 54 and 55:
The trend of forest coverage in the
- Page 56 and 57:
BiodiversityState of BiodiversityNe
- Page 58 and 59:
The Government has given legal prot
- Page 60 and 61:
Different ways of maintaining biodi
- Page 62 and 63:
———.2004. State of the Enviro
- Page 64 and 65:
Appendix 4.1: Table continuedMajor
- Page 66 and 67:
Appendix 4.2: Protected Plant and W
- Page 68 and 69:
Table A4.2.3: Nepal's Share in Plan
- Page 70 and 71:
to intense weathering, and percolat
- Page 72 and 73:
Table 5.5: Water Supply and Water T
- Page 74 and 75:
Table 5.9: Water Quality of Shallow
- Page 76 and 77: species are reported to be endanger
- Page 78 and 79: Ministry of Water Resources (MOWR).
- Page 80 and 81: Definition, Forms, and UnitsEnergy
- Page 82 and 83: Table 6.5: Hydropower PotentialRive
- Page 84 and 85: Chilime Hydroelectric Project: An E
- Page 86 and 87: load occurs from 6 pm to 9 pm with
- Page 88 and 89: assessment of wind energy and lack
- Page 90 and 91: Review of Dams and Development by t
- Page 92 and 93: IUCNElizabeth Khaka, UNEP-NairobiRu
- Page 94 and 95: therefore reflect the three guiding
- Page 96 and 97: is a seasonal dust storm. Anthropog
- Page 98 and 99: Figure 7.3: Average Air Quality, Ja
- Page 100 and 101: matter, hydrocarbons, and NO x (Nae
- Page 102 and 103: Figure: 7.9: Vehicle Registered in
- Page 104 and 105: Brick Kilnchlorofluorocarbons (HCFC
- Page 106 and 107: Climate ChangeA region’s climate
- Page 108 and 109: Figure 7.14: Mean Annual Precipitat
- Page 110 and 111: Table 7.3: National Ambient Air Qua
- Page 112 and 113: India. Available: http://www.cleana
- Page 114 and 115: ———.1999. “Ambient Air Qual
- Page 116 and 117: Appendix 7.1: World Health Organiza
- Page 118 and 119: Table 8.1: Criteria for Urban Statu
- Page 120 and 121: accommodate the rapidly increasing
- Page 122 and 123: managing solid waste. They are part
- Page 124 and 125: In most municipalities, hazardous w
- Page 128 and 129: objects of archaeological, historic
- Page 130 and 131: Min BajracharyaB. PradhanVehicles a
- Page 132 and 133: Department of Health Services (DOHS
- Page 134 and 135: Table 9.1 describes the major highl
- Page 136 and 137: the period to up 2017. The document
- Page 138 and 139: earthquakes; and awareness raising
- Page 140 and 141: Sub-regional LinkagesOther developi
- Page 142 and 143: Figure 9.1: The Key Environmental I
- Page 144 and 145: (iv)(v)(vi)plants, and other non-ti
- Page 146 and 147: environmental governance can be bet
- Page 148 and 149: can vary considerably. Both sides h
- Page 150 and 151: Dhungel, D.N., and A.B. Rajbhandari
- Page 152 and 153: Table A9.1.2: Industry-Specific Tol
- Page 154 and 155: . Cultural Heritage8. Convention fo
- Page 156 and 157: Appendix 9.3: Some Prominent Enviro
- Page 158 and 159: Some funding arrangements made by t
- Page 160 and 161: (NARDF 2004) for a period of 1 to 3
- Page 162 and 163: Table 10.2: Annual Income and Expen
- Page 164 and 165: Table 10.4: Users’ Share in Benef
- Page 166 and 167: From Hands Around Everest bookFrom
- Page 168 and 169: Table 10.8: Subsidy Rate for Biogas
- Page 170 and 171: microorganism communities and the n
- Page 172 and 173: subsidies (Mason 1996). All these a
- Page 174 and 175: addressed only part of the problem.
- Page 176 and 177:
historical practice of community-ma
- Page 178 and 179:
moved or relocated. The fact that s
- Page 180 and 181:
Kathmandu Valley and receives a lar
- Page 182 and 183:
cooperative ventures provided neith
- Page 184 and 185:
further poaching has not been repor
- Page 186 and 187:
http://www.pugwash.org/reports/pac/
- Page 188 and 189:
United Nations. 2003. World Populat
- Page 190 and 191:
how other countries with substantia
- Page 192 and 193:
(i) Broad-based and sustainable eco
- Page 194 and 195:
Although progress is encouraging, m
- Page 196 and 197:
Nepal’s Changing Pattern of Trade
- Page 198 and 199:
Table 12.2: Trade/ GDP RatiosFY1981
- Page 200 and 201:
Table 12.5: Percentage Share of Maj
- Page 202 and 203:
well as other provisions in specifi
- Page 204 and 205:
Future Implications for NepalIncrea
- Page 206 and 207:
International Trade Forum (ITN). 20
- Page 208 and 209:
- Gross domestic product per unit e
- Page 210 and 211:
Time Series InformationGenerally tw
- Page 212 and 213:
Table 13.1a: Different Datasets Col
- Page 214 and 215:
elevant due to its multidisciplinar
- Page 216 and 217:
Figure 13.6: Examples of Applicatio
- Page 218 and 219:
Judith DobmannThere are many source
- Page 220 and 221:
———.2003. Mapping Nepal Censu
- Page 222 and 223:
sustainable livelihoods requires an
- Page 224 and 225:
and haphazard. Population pressures
- Page 226 and 227:
issue. These deficiencies stem from
- Page 228 and 229:
population must be assessed. MOEST
- Page 230 and 231:
Appendix 14.1: List of Key Environm
- Page 232 and 233:
(vii) The EIA report approving agen
- Page 234 and 235:
Goal 1: Eradicate extreme poverty a
- Page 236 and 237:
Nepal’s Progress Towards the MDGs
- Page 238 and 239:
Goal 4: Reduce child mortalityReduc