Agglomeration village in the central hills of NepalDispersed settlement type village in the central hills ofNepalMorphological FeaturesRural settlements are primarily of two forms:scattered and agglomerated. Scattered settlementsare usually small, with large distances betweenbuildings within the locality, as well as between thesettlement localities. Agglomerated settlements, onthe other hand, are usually large because theycontain buildings that are relatively closely spaced orsometimes attached to each other. The density ofbuildings in agglomerated settlements is usuallyB. PradhanB. Pradhanhigh. Market towns in rural areas are usuallycompact, with buildings commonly attached to eachother. The rural settlement study carried out by theCentral Department of Geography (CDG 2004)indicates that dispersed settlements are foundwidely across the Hill region. However, in thewestern Hills some of the settlements inhabited bythe Gurung and Magar ethnic groups are ofagglomerated form. The rural settlements in the Teraiand the Mountain regions are mostly agglomeratedor compact. However, the size of agglomeratedsettlements in the Mountain region is smaller thanthose in the Terai. In some parts of the easternMountain region, rural settlements are mostly in thescattered form.These settlement forms are chiefly related to theamount and type of available resources, ruggednessof the topography, climatic conditions, amount ofinfrastructure services, and so on. Dispersedsettlements in the Hills are chiefly the result oflimited and scattered production resources andhabitable environments in the rugged topography.The compact or agglomerated settlements in theTerai result from the abundant land resources andflat topography, while those of the Mountains are dueto cold climate and social reasons. Because of poorsanitation and drainage, the environment of compactsettlements is mostly unhealthy.Distribution PatternTable 2.8 shows the distribution of settlementlocalities as reported by the 2001 census. Details ofthe number of localities by population size class andregion, and their total population, for 1991 and 2001are shown in Tables 2.9 and 2.10, respectively. Allrural localities lie below the population size class20,000–49,999. However, settlement localities in thepopulation size class 10,000–19,999 also containsome designated urban areas, since in Hill andTable 2.8: Distribution of Settlement Localities , 1991 and 2001Population Size Mountain Hill Terai Country TotalClass 1991 2001 1991 2001 1991 2001 1991 2001Below 1,000 60 55 12 15 0 0 72 701,000–4,999 459 399 1,722 1,477 842 520 3,023 2,3965,000–9,999 25 73 304 433 432 561 761 1,06710,000–19,999 0 27 28 53 137 205 165 28520,000–49,999 0 2 2 <strong>18</strong> 14 35 16 5550,000–99,999 0 0 3 3 5 8 8 11Over 99,999 0 0 2 3 1 2 3 5Total 544 556 2,073 2,002 1,431 1,331 4,048 3,889% Country total 13.4 14.3 51.2 51.5 35.4 34.2 100 100Source: CBS (2002b)10 Environment Assessment of Nepal : Emerging Issues and Challenges
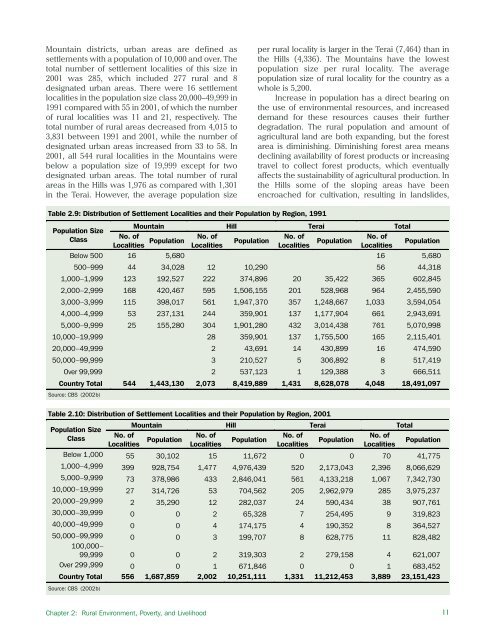
Mountain districts, urban areas are defined assettlements with a population of 10,000 and over. Thetotal number of settlement localities of this size in2001 was 285, which included 277 rural and 8designated urban areas. There were 16 settlementlocalities in the population size class 20,000–49,999 in1991 compared with 55 in 2001, of which the numberof rural localities was 11 and 21, respectively. Thetotal number of rural areas decreased from 4,015 to3,831 between 1991 and 2001, while the number ofdesignated urban areas increased from 33 to 58. In2001, all 544 rural localities in the Mountains werebelow a population size of 19,999 except for twodesignated urban areas. The total number of ruralareas in the Hills was 1,976 as compared with 1,301in the Terai. However, the average population sizeper rural locality is larger in the Terai (7,464) than inthe Hills (4,336). The Mountains have the lowestpopulation size per rural locality. The averagepopulation size of rural locality for the country as awhole is 5,200.Increase in population has a direct bearing onthe use of environmental resources, and increaseddemand for these resources causes their furtherdegradation. The rural population and amount ofagricultural land are both expanding, but the forestarea is diminishing. Diminishing forest area meansdeclining availability of forest products or increasingtravel to collect forest products, which eventuallyaffects the sustainability of agricultural production. Inthe Hills some of the sloping areas have beenencroached for cultivation, resulting in landslides,Table 2.9: Distribution of Settlement Localities and their Population by Region, 1991Population SizeClassMountain Hill Terai TotalNo. ofLocalities Population No. ofNo. ofPopulationLocalitiesLocalities Population No. ofPopulationLocalitiesBelow 500 16 5,680 16 5,680500–999 44 34,028 12 10,290 56 44,3<strong>18</strong>1,000–1,999 123 192,527 222 374,896 20 35,422 365 602,8452,000–2,999 168 420,467 595 1,506,155 201 528,968 964 2,455,5903,000–3,999 115 398,017 561 1,947,370 357 1,248,667 1,033 3,594,0544,000–4,999 53 237,131 244 359,901 137 1,177,904 661 2,943,6915,000–9,999 25 155,280 304 1,901,280 432 3,014,438 761 5,070,99810,000–19,999 28 359,901 137 1,755,500 165 2,115,40120,000–49,999 2 43,691 14 430,899 16 474,59050,000–99,999 3 210,527 5 306,892 8 517,419Over 99,999 2 537,123 1 129,388 3 666,511Country Total 544 1,443,130 2,073 8,419,889 1,431 8,628,078 4,048 <strong>18</strong>,491,097Source: CBS (2002b)Table 2.10: Distribution of Settlement Localities and their Population by Region, 2001Population SizeClassMountain Hill Terai TotalNo. ofLocalities Population No. ofNo. ofNo. ofPopulationPopulationPopulationLocalitiesLocalitiesLocalitiesBelow 1,000 55 30,102 15 11,672 0 0 70 41,7751,000–4,999 399 928,754 1,477 4,976,439 520 2,173,043 2,396 8,066,6295,000–9,999 73 378,986 433 2,846,041 561 4,133,2<strong>18</strong> 1,067 7,342,73010,000–19,999 27 314,726 53 704,562 205 2,962,979 285 3,975,23720,000–29,999 2 35,290 12 282,037 24 590,434 38 907,76130,000–39,999 0 0 2 65,328 7 254,495 9 319,82340,000–49,999 0 0 4 174,175 4 190,352 8 364,52750,000–99,999 0 0 3 199,707 8 628,775 11 828,482100,000–99,999 0 0 2 319,303 2 279,158 4 621,007Over 299,999 0 0 1 671,846 0 0 1 683,452Country Total 556 1,687,859 2,002 10,251,111 1,331 11,212,453 3,889 23,151,423Source: CBS (2002b)Chapter 2: Rural Environment, Poverty, and Livelihood11
- Page 2 and 3: About the OrganisationsAsian Develo
- Page 4 and 5: © 2006 International Centre for In
- Page 6 and 7: AcknowledgementsWe would like to ex
- Page 8 and 9: PM2.5PAHRSSAARCSACEPSEASO 2TSPUKUND
- Page 10 and 11: Chapter 6: Energy Resources 65Intro
- Page 12 and 13: List of FiguresFigure 2.1: People a
- Page 14 and 15: Table 6.1: Energy Consumption and P
- Page 16 and 17: forests are also used for infrastru
- Page 18 and 19: as data gathered by different agenc
- Page 20 and 21: Table 2.1: Population Growth Rates
- Page 22 and 23: mortality rates for rural and urban
- Page 26 and 27: soil erosion, and depletion of wate
- Page 30 and 31: provision remains inadequate becaus
- Page 32 and 33: Malnutrition remains a serious obst
- Page 34 and 35: Table 2.24: Existing and Projected
- Page 36 and 37: Table 2.28: Income Poverty Indicato
- Page 38 and 39: Table 2.31: Change in Employment St
- Page 40 and 41: In 2004, the average annual househo
- Page 42 and 43: Mountain areas have the most food i
- Page 44 and 45: Schaffner, U. 1987. “Road Constru
- Page 46 and 47: Table 3.1: Agricultural Economic De
- Page 48 and 49: Table 3.4: Estimated Soil Erosion R
- Page 50 and 51: B. PradhanImpacts of land degradati
- Page 52 and 53: Carson, B. 1985. “Erosion and Sed
- Page 54 and 55: The trend of forest coverage in the
- Page 56 and 57: BiodiversityState of BiodiversityNe
- Page 58 and 59: The Government has given legal prot
- Page 60 and 61: Different ways of maintaining biodi
- Page 62 and 63: ———.2004. State of the Enviro
- Page 64 and 65: Appendix 4.1: Table continuedMajor
- Page 66 and 67: Appendix 4.2: Protected Plant and W
- Page 68 and 69: Table A4.2.3: Nepal's Share in Plan
- Page 70 and 71: to intense weathering, and percolat
- Page 72 and 73: Table 5.5: Water Supply and Water T
- Page 74 and 75:
Table 5.9: Water Quality of Shallow
- Page 76 and 77:
species are reported to be endanger
- Page 78 and 79:
Ministry of Water Resources (MOWR).
- Page 80 and 81:
Definition, Forms, and UnitsEnergy
- Page 82 and 83:
Table 6.5: Hydropower PotentialRive
- Page 84 and 85:
Chilime Hydroelectric Project: An E
- Page 86 and 87:
load occurs from 6 pm to 9 pm with
- Page 88 and 89:
assessment of wind energy and lack
- Page 90 and 91:
Review of Dams and Development by t
- Page 92 and 93:
IUCNElizabeth Khaka, UNEP-NairobiRu
- Page 94 and 95:
therefore reflect the three guiding
- Page 96 and 97:
is a seasonal dust storm. Anthropog
- Page 98 and 99:
Figure 7.3: Average Air Quality, Ja
- Page 100 and 101:
matter, hydrocarbons, and NO x (Nae
- Page 102 and 103:
Figure: 7.9: Vehicle Registered in
- Page 104 and 105:
Brick Kilnchlorofluorocarbons (HCFC
- Page 106 and 107:
Climate ChangeA region’s climate
- Page 108 and 109:
Figure 7.14: Mean Annual Precipitat
- Page 110 and 111:
Table 7.3: National Ambient Air Qua
- Page 112 and 113:
India. Available: http://www.cleana
- Page 114 and 115:
———.1999. “Ambient Air Qual
- Page 116 and 117:
Appendix 7.1: World Health Organiza
- Page 118 and 119:
Table 8.1: Criteria for Urban Statu
- Page 120 and 121:
accommodate the rapidly increasing
- Page 122 and 123:
managing solid waste. They are part
- Page 124 and 125:
In most municipalities, hazardous w
- Page 126 and 127:
in worsening public health conditio
- Page 128 and 129:
objects of archaeological, historic
- Page 130 and 131:
Min BajracharyaB. PradhanVehicles a
- Page 132 and 133:
Department of Health Services (DOHS
- Page 134 and 135:
Table 9.1 describes the major highl
- Page 136 and 137:
the period to up 2017. The document
- Page 138 and 139:
earthquakes; and awareness raising
- Page 140 and 141:
Sub-regional LinkagesOther developi
- Page 142 and 143:
Figure 9.1: The Key Environmental I
- Page 144 and 145:
(iv)(v)(vi)plants, and other non-ti
- Page 146 and 147:
environmental governance can be bet
- Page 148 and 149:
can vary considerably. Both sides h
- Page 150 and 151:
Dhungel, D.N., and A.B. Rajbhandari
- Page 152 and 153:
Table A9.1.2: Industry-Specific Tol
- Page 154 and 155:
. Cultural Heritage8. Convention fo
- Page 156 and 157:
Appendix 9.3: Some Prominent Enviro
- Page 158 and 159:
Some funding arrangements made by t
- Page 160 and 161:
(NARDF 2004) for a period of 1 to 3
- Page 162 and 163:
Table 10.2: Annual Income and Expen
- Page 164 and 165:
Table 10.4: Users’ Share in Benef
- Page 166 and 167:
From Hands Around Everest bookFrom
- Page 168 and 169:
Table 10.8: Subsidy Rate for Biogas
- Page 170 and 171:
microorganism communities and the n
- Page 172 and 173:
subsidies (Mason 1996). All these a
- Page 174 and 175:
addressed only part of the problem.
- Page 176 and 177:
historical practice of community-ma
- Page 178 and 179:
moved or relocated. The fact that s
- Page 180 and 181:
Kathmandu Valley and receives a lar
- Page 182 and 183:
cooperative ventures provided neith
- Page 184 and 185:
further poaching has not been repor
- Page 186 and 187:
http://www.pugwash.org/reports/pac/
- Page 188 and 189:
United Nations. 2003. World Populat
- Page 190 and 191:
how other countries with substantia
- Page 192 and 193:
(i) Broad-based and sustainable eco
- Page 194 and 195:
Although progress is encouraging, m
- Page 196 and 197:
Nepal’s Changing Pattern of Trade
- Page 198 and 199:
Table 12.2: Trade/ GDP RatiosFY1981
- Page 200 and 201:
Table 12.5: Percentage Share of Maj
- Page 202 and 203:
well as other provisions in specifi
- Page 204 and 205:
Future Implications for NepalIncrea
- Page 206 and 207:
International Trade Forum (ITN). 20
- Page 208 and 209:
- Gross domestic product per unit e
- Page 210 and 211:
Time Series InformationGenerally tw
- Page 212 and 213:
Table 13.1a: Different Datasets Col
- Page 214 and 215:
elevant due to its multidisciplinar
- Page 216 and 217:
Figure 13.6: Examples of Applicatio
- Page 218 and 219:
Judith DobmannThere are many source
- Page 220 and 221:
———.2003. Mapping Nepal Censu
- Page 222 and 223:
sustainable livelihoods requires an
- Page 224 and 225:
and haphazard. Population pressures
- Page 226 and 227:
issue. These deficiencies stem from
- Page 228 and 229:
population must be assessed. MOEST
- Page 230 and 231:
Appendix 14.1: List of Key Environm
- Page 232 and 233:
(vii) The EIA report approving agen
- Page 234 and 235:
Goal 1: Eradicate extreme poverty a
- Page 236 and 237:
Nepal’s Progress Towards the MDGs
- Page 238 and 239:
Goal 4: Reduce child mortalityReduc