SXVF-M25C handbook - Starlight Xpress
SXVF-M25C handbook - Starlight Xpress
SXVF-M25C handbook - Starlight Xpress

Create successful ePaper yourself
Turn your PDF publications into a flip-book with our unique Google optimized e-Paper software.
Handbook for the SXV-<strong>M25C</strong> Issue 1 June 2004<br />
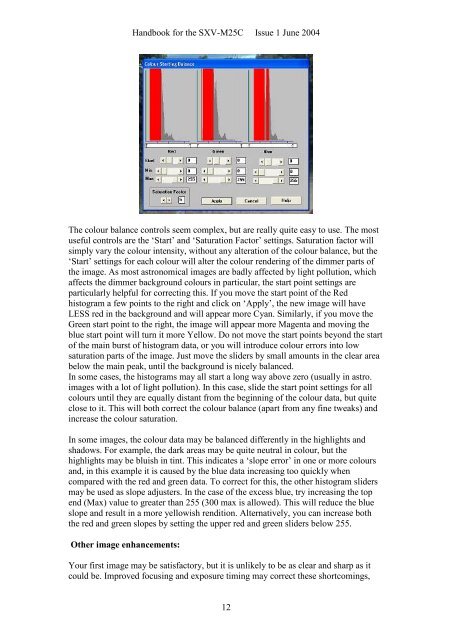
The colour balance controls seem complex, but are really quite easy to use. The most<br />
useful controls are the ‘Start’ and ‘Saturation Factor’ settings. Saturation factor will<br />
simply vary the colour intensity, without any alteration of the colour balance, but the<br />
‘Start’ settings for each colour will alter the colour rendering of the dimmer parts of<br />
the image. As most astronomical images are badly affected by light pollution, which<br />
affects the dimmer background colours in particular, the start point settings are<br />
particularly helpful for correcting this. If you move the start point of the Red<br />
histogram a few points to the right and click on ‘Apply’, the new image will have<br />
LESS red in the background and will appear more Cyan. Similarly, if you move the<br />
Green start point to the right, the image will appear more Magenta and moving the<br />
blue start point will turn it more Yellow. Do not move the start points beyond the start<br />
of the main burst of histogram data, or you will introduce colour errors into low<br />
saturation parts of the image. Just move the sliders by small amounts in the clear area<br />
below the main peak, until the background is nicely balanced.<br />
In some cases, the histograms may all start a long way above zero (usually in astro.<br />
images with a lot of light pollution). In this case, slide the start point settings for all<br />
colours until they are equally distant from the beginning of the colour data, but quite<br />
close to it. This will both correct the colour balance (apart from any fine tweaks) and<br />
increase the colour saturation.<br />
In some images, the colour data may be balanced differently in the highlights and<br />
shadows. For example, the dark areas may be quite neutral in colour, but the<br />
highlights may be bluish in tint. This indicates a ‘slope error’ in one or more colours<br />
and, in this example it is caused by the blue data increasing too quickly when<br />
compared with the red and green data. To correct for this, the other histogram sliders<br />
may be used as slope adjusters. In the case of the excess blue, try increasing the top<br />
end (Max) value to greater than 255 (300 max is allowed). This will reduce the blue<br />
slope and result in a more yellowish rendition. Alternatively, you can increase both<br />
the red and green slopes by setting the upper red and green sliders below 255.<br />
Other image enhancements:<br />
Your first image may be satisfactory, but it is unlikely to be as clear and sharp as it<br />
could be. Improved focusing and exposure timing may correct these shortcomings,<br />
12