2004 TAC Annual Report - Transport Accident Commission
2004 TAC Annual Report - Transport Accident Commission
2004 TAC Annual Report - Transport Accident Commission

You also want an ePaper? Increase the reach of your titles
YUMPU automatically turns print PDFs into web optimized ePapers that Google loves.
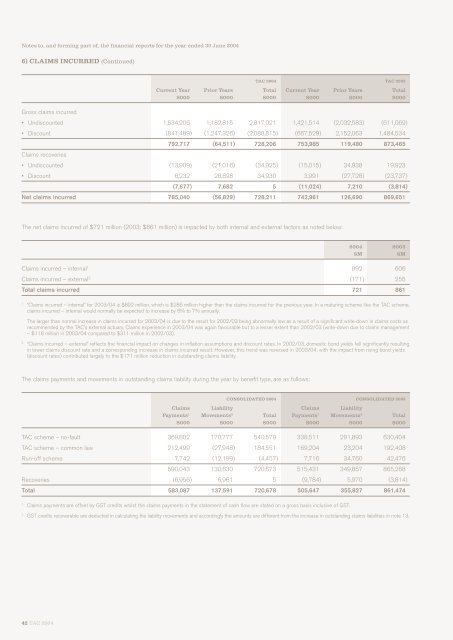
Notes to, and forming part of, the financial reports for the year ended 30 June <strong>2004</strong><br />
6) CLAIMS INCURRED (Continued)<br />
Gross claims incurred<br />
<strong>TAC</strong> <strong>2004</strong> <strong>TAC</strong> 2003<br />
Current Year Prior Years Total Current Year Prior Years Total<br />
$000 $000 $000 $000 $000 $000<br />
• Undiscounted 1,634,206 1,182,815 2,817,021 1,421,514 (2,032,583) (611,069)<br />
• Discount (841,489) (1,247,326) (2,088,815) (667,529) 2,152,063 1,484,534<br />
Claims recoveries<br />
792,717 (64,511) 728,206 753,985 119,480 873,465<br />
• Undiscounted (13,909) (21,016) (34,925) (15,015) 34,938 19,923<br />
• Discount 6,232 28,698 34,930 3,991 (27,728) (23,737)<br />
(7,677) 7,682 5 (11,024) 7,210 (3,814)<br />
Net claims incurred 785,040 (56,829) 728,211 742,961 126,690 869,651<br />
The net claims incurred of $721 million (2003: $861 million) is impacted by both internal and external factors as noted below:<br />
<strong>2004</strong> 2003<br />
$M $M<br />
Claims incurred – internal 1 892 606<br />
Claims incurred – external 2 (171) 255<br />
Total claims incurred 721 861<br />
1<br />
“Claims incurred – internal” for 2003/04 is $892 million, which is $286 million higher than the claims incurred for the previous year. In a maturing scheme like the <strong>TAC</strong> scheme,<br />
claims incurred – internal would normally be expected to increase by 6% to 7% annually.<br />
The larger than normal increase in claims incurred for 2003/04 is due to the result for 2002/03 being abnormally low as a result of a significant write-down in claims costs as<br />
recommended by the <strong>TAC</strong>’s external actuary. Claims experience in 2003/04 was again favourable but to a lesser extent than 2002/03 (write-down due to claims management<br />
– $118 million in 2003/04 compared to $311 million in 2002/03).<br />
2<br />
“Claims incurred – external” reflects the financial impact on changes in inflation assumptions and discount rates. In 2002/03, domestic bond yields fell significantly resulting<br />
in lower claims discount rate and a corresponding increase in claims incurred result. However, this trend was reversed in 2003/04, with the impact from rising bond yields<br />
(discount rates) contributed largely to the $171 million reduction in outstanding claims liability.<br />
The claims payments and movements in outstanding claims liability during the year by benefit type, are as follows:<br />
CONSOLIDATED <strong>2004</strong> CONSOLIDATED 2003<br />
Claims Liability Claims Liability<br />
Payments 1 Movements 2 Total Payments 1 Movements 2 Total<br />
$000 $000 $000 $000 $000 $000<br />
<strong>TAC</strong> scheme – no-fault 369,802 170,777 540,579 338,511 291,893 630,404<br />
<strong>TAC</strong> scheme – common law 212,499 (27,948) 184,551 169,204 23,204 192,408<br />
Run-off scheme 7,742 (12,199) (4,457) 7,716 34,760 42,476<br />
590,043 130,630 720,673 515,431 349,857 865,288<br />
Recoveries (6,956) 6,961 5 (9,784) 5,970 (3,814)<br />
Total 583,087 137,591 720,678 505,647 355,827 861,474<br />
1<br />
Claims payments are offset by GST credits whilst the claims payments in the statement of cash flow are stated on a gross basis inclusive of GST.<br />
2<br />
GST credits recoverable are deducted in calculating the liability movements and accordingly the amounts are different from the increase in outstanding claims liabilities in note 13.<br />
42 <strong>TAC</strong> <strong>2004</strong>