Unit 1 sample multiple choice questions
Unit 1 sample multiple choice questions
Unit 1 sample multiple choice questions

You also want an ePaper? Increase the reach of your titles
YUMPU automatically turns print PDFs into web optimized ePapers that Google loves.
A description of different houses on the market includes the ,b~dowmg three variables.<br />
Which of the variables is quantitative?<br />
A) The square footage of the house C) The monthly electric bill<br />
B) The monthly gas bi!I D) All of the above,<br />
A survey typically records many"ganables of mtarast to the researchers involved. Below<br />
are some of the variables from a survey conducted by the U.S. Postal Service. Which of<br />
the variables is categqrical?<br />
A) County of residence<br />
B) Number of people, both aduks and children, living in the-household<br />
C) Total household income, before taxes, ha 1993<br />
D) Age of respondent<br />
Ira histogram has a bar that is taller than the others then<br />
A) the bar corresponds to the class interval containing the most o.bservations.<br />
B) this is s ggestlve of a skewed distribution.<br />
C) the class intervai for this bar should be shortened for the sake of symmetry.<br />
D) All of the above.<br />
Use the ±bllowing to answer <strong>questions</strong> ~-~<br />
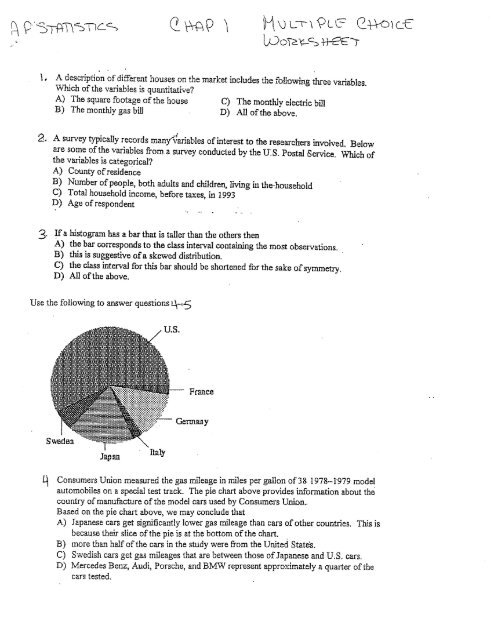
Consumers Union measured the gas mileage in miles per gallon of 38 1978-1979 model<br />
automobiles on a special test track. The pie chart above provides information about th~<br />
country of manufanture of the model cars used by Consumers Uzfi.om<br />
Based on the pie chart above, we may conclude that<br />
A) Japanese cars get significantly lower gas rnileage than cars of other countries. This is<br />
because their slice of the pie is at the bottom of the chart.<br />
B) more than half of the ears ha the study were from the <strong>Unit</strong>ed StatEs.<br />
c) Swedish ears get gas mileages that are between those of Japanese and U.S, ears.<br />
D) Mercedes Benz, Audi, Porsche, and BMW represent appro,~;~, atety a quarter of the<br />
cars tested.
A reporter wishes to portray-basebal! players as overpaid. V~’rfi.c~h - measure of center<br />
should he report as the average salary of major league players?<br />
A) the mean.<br />
B) the median.<br />
C) either the mean or median. It doesn~ matter since they wil! be equal.<br />
D) neither the mean nor median. Both will be much lower than the acvaal average salary.<br />
Use the following to answer <strong>questions</strong><br />
A <strong>sample</strong> was taken of the salaries of 20 employees of a large company. The following boxplot<br />
shows the salaries (in thousands of dollars) for this year.<br />
Based on.this boxplot, which of the following statements is true7<br />
A) The maximum salary is between 60 and 70 thousand dollars.<br />
B) The minimum salary is 20 thousand dollars.<br />
C) The range of the middle half of the salaries is about 20 thousand dollars.<br />
D) The median salary is about 40 thousand dollars,<br />
Based on this boxplot, which oft~e following statements is true?<br />
A) The salary distribution is fairly symmetric.<br />
B) About 10 employees make over $50,000.<br />
C) Nobody makes over $80,000.<br />
D) All of the above.<br />
~’t<br />
~aseu on Lms boxptot, Llae hw llUfnDer su~IInary iS<br />
A) 2g, 39, 48, 60.5, 77. C) 28, 39, 51, 58, 77.<br />
B) 28, 41, 48, 58, 77. D) 28, 41, 51, 60.5, 77.<br />
A set of data is found to have a <strong>sample</strong> standard deviation of 25. Suppose 9 were added to<br />
each of the numbers in the data. The standard deviation of the resulting data<br />
A) would still be 25. C) would now be 28.<br />
B) would now be 34. D) cannot be determined.
Yor a Phys~s course containing IO students, the maximum point total for the quar~" was 200.<br />
The point totals for the ~.0 students are given in the st~raplot below.<br />
I~37<br />
t426<br />
17 9<br />
This stemplot is most similar to<br />
A) a ldstograra with class intervals 110 _< score < 120, 120 _< scor.e < 130, etc.<br />
B) a time plot of the da ~ "- w~th .... the observatmns taken m increasing order.<br />
C) a boxplot of the data.<br />
D) reporting th~ 5 point sunmnary for the-data, with the mean.<br />
To which of the following data sets does this stemplot correspond?<br />
A) All integers between 116 and 179<br />
B) 1, 2, 3, 4, 6, 6, 7, 8, 8, 9 .<br />
C) 16, 18, 21, 24, 28, 33, 37,.42, 46, 79<br />
D)- 116, 118, 121,124, 128, 133, 137, 142, 146, !79 ¯<br />
[~, The median point total for this class is<br />
, ) 1~0._ C) D) IS7.<br />
A consumer group surveyed the prices for a certain item in five di~erent stores, and<br />
reported the average price as. $t5. We xdsited four of the five stores, and found the prices<br />
to be $10, $15, 815, and $25. Assturdng that the consumer group is correct, what is the<br />
price of-the item-at-the store that we did not visit~<br />
A) $10 B) $~5 ~ C) $20 D) $25 ’<br />
A set zf data~ a-mean that is much larger than the median. Which of the following<br />
statements is most Consistent with th~s information?<br />
A) A h~stogram of~he data is syrametrio.<br />
B) A histogram of’the data is.skewed left.<br />
C) A histogram of the data is’ skewed fight<br />
D) The data set probably has a few lbw ou~ers.<br />
The mean age of four people in a room is 30 years, A new person whose age is 55 years<br />
enters the room. The mean age of the five people now in the room is<br />
A) 30. B) 35. C) 40..D) Cannot be determined from the lnformation given~